
National Reference Test results digest 2026 (accessible)
Published 20 August 2026
Applies to England

© Crown copyright 2026
This publication is licensed under the terms of the Open Government Licence v3.0 except where otherwise stated. To view this licence, visit nationalarchives.gov.uk/doc/open-government-licence/version/3 or write to the Information Policy Team, The National Archives, Kew, London TW9 4DU, or email: psi@nationalarchives.gov.uk.
Where we have identified any third party copyright information you will need to obtain permission from the copyright holders concerned.
This publication is available at https://www.gov.uk/government/publications/the-national-reference-test-in-2026/national-reference-test-results-digest-2026-accessible
Authors: Bethan Burge, Louise Benson
Published in August 2026
By the National Foundation for Educational Research, The Mere, Upton Park, Slough, Berkshire SL1 2DQ
How to cite this publication: Burge, B. and Benson, L. (2026) National Reference Test Results Digest 2026. Slough: NFER.
A PDF version of this document is also available on the Ofqual website.
1. Introduction
Ofqual has contracted the National Foundation for Educational Research (NFER) to develop, administer and analyse the National Reference Test (NRT) in English and maths. The first NRT took place in 2017 and established a baseline from which any future changes in standards can be detected. This report represents an overview of the findings of the 2026 testing process.
The NRT, which consists of a series of test booklets, provides evidence on changes in the performance standards in GCSE English language and maths in England at the end of key stage 4. It does this by testing content taken from the GCSE English and maths curricula. It has been designed to provide additional information to support the awarding of GCSEs in English language and maths and is based on a robust and representative sample of Year 11 students who will, in the relevant year, take their GCSEs.
More information about the NRT can be found in the NRT document collection.
The outcomes of the 2017 GCSE examinations in English language and maths provided the baseline percentages of students at three grade boundaries and these were mapped to the NRT for 2017 to establish the corresponding proficiency level. The percentages of students achieving those proficiency levels in each subsequent year are calculated and compared.
The NRT structure remains the same each year. For each of English and maths, there are eight test booklets in use. Each question is used in two booklets, so that effectively all the tests can be analysed together to give a single measure of subject performance. This is similar to other studies that analyse trends in performance over time, for example, international surveys such as the Programme for International Student Assessment (PISA) and the Trends in International Mathematics and Science Study (TIMSS).
This report provides summarised information of the key performance outcomes for English and maths in 2026 and provides information on the changes from the baseline standards established in 2017. It also includes data on the achievement of the samples, their representativeness and the performance of the students on the tests. Further information on the nature of the tests, the development process, the survey design and its conduct, and the analysis methods used is provided in the accompanying document: Background Report: National Reference Test.
2. The sample
The NRT took place between 20 February and 9 March 2026. The numbers of participating schools and students are shown in Table 2.1 and Table 2.2. In 2026, 349 schools participated in English and 350 schools participated in maths, exceeding the target of 330 schools for each subject. The sample was stratified by the historical attainment of schools in GCSE English language and GCSE maths and by school size. In addition, the types of schools were monitored. Checks were made on all three of these variables to ensure that the achieved sample reflects the sampling frame. Students at independent schools have been consistently under-represented in the NRT across the years, but the match in historical GCSE performance between the sample and population is very good despite this, confirming the quality of the sample.
Table 2.1 Target sample sizes and achieved samples in current and previous years
| Subject | English: Number of Schools | Maths: Number of Schools |
|---|---|---|
| NRT Target Sample | 330 | 330 |
| Achieved sample 2026 | 349 | 350 |
| Achieved sample 2025 | 355 | 356 |
| Achieved sample 2024 | 339 | 341 |
| Achieved sample 2023 | 343 | 341 |
| Achieved sample 2022 | 334 | 334 |
| Achieved sample 2021 | 214 | 216 |
| Achieved sample 2020 | 332 | 333 |
| Achieved sample 2019 | 332 | 331 |
| Achieved sample 2018 | 312 | 307 |
| Achieved sample 2017 | 339 | 340 |
Table 2.2 shows the number of students for whom booklets were dispatched and the number who completed the assessments in English and maths. In 2026, 6,757 students completed the English assessment and 6,899 completed the maths assessment, representing participation rates of 81% and 82% respectively. These participation rates were similar to those observed in recent NRT cycles and provide confidence that the results reflect the performance of Year 11 students nationally. Although participation rates remain lower than the pre-pandemic NRT average of 85%, they are comparable to those required in large-scale international assessments that use similar sampling designs to produce nationally representative results.
Table 2.2. Completed student test returns for English and maths in all NRT administrations
| Year | No. of students: dispatched English tests | No. of students: completed English tests | % of students: completed English tests | No. of students: dispatched maths tests | No. of students: completed maths tests | % of students: completed maths tests |
|---|---|---|---|---|---|---|
| 2026 | 8,373 | 6,757 | 81 | 8,400 | 6,899 | 82 |
| 2025 | 8,494 | 6,889 | 81 | 8,531 | 7,060 | 83 |
| 2024 | 8,158 | 6,609 | 81 | 8,181 | 6,674 | 82 |
| 2023 | 8,200 | 6,630 | 81 | 8,152 | 6,567 | 81 |
| 2022 | 7,969 | 6,457 | 81 | 7,961 | 6,406 | 80 |
| 2021 | 5,124 | 4,030 | 79 | 5,152 | 4,143 | 80 |
| 2020 | 7,845 | 6,639 | 85 | 7,886 | 6,756 | 86 |
| 2019 | 7,928 | 6,739 | 85 | 7,917 | 6,825 | 86 |
| 2018 | 7,354 | 6,193 | 84 | 7,320 | 6,169 | 84 |
| 2017 | 8,040 | 7,082 | 88 | 8,080 | 7,144 | 88 |
The pattern of non-attendance differs slightly between maths and English in 2026. The principal reason for non-attendance was absence due to illness or other authorised reason, accounting for 55% of non-attendance in English and 61% in maths. Students being absent from the testing session while present in school was the second most common reason (14% in English and 11% in maths). Headteacher withdrawals accounted for 11% of non-attendance in both subjects, an increase compared with 2025. Other reasons for non-attendance were less common and included students leaving the school or studying at another venue.
2.1. Access arrangements
The NRT offers access arrangements consistent with JCQ requirements (for GCSE examinations) in order to make the test accessible to as many sampled students as possible. Schools were asked to contact NFER in advance of the NRT to indicate whether any of their students required modified test materials or if students’ normal working practice was to use a word processor or laptop during examinations. In cases where additional time would be needed for particular students, schools were asked to discuss this need with the NFER test administrator and ensure that the extra time for the testing session could be accommodated. All requests from schools for access arrangements and the type of arrangement required were recorded. Table 2.3 shows the different types of access arrangements that were provided to students for the 2026 NRT, organised by NFER. This table includes instances where students required more than one access arrangement. These are the access arrangements facilitated by NFER for the NRT in 2026; we do not collect complete data on the permitted arrangements that are organised by the school such as readers, scribes, extra time and examination pens so they are not included in the table below. Overall, the percentage of students whose school requested access arrangements for them for the 2026 NRT is slightly higher than the percentage requested in 2025, 6.7 per cent in 2026 compared to 5.6 per cent in 2025.
Table 2.3. Number of access arrangements facilitated by NFER in 2026
| Arrangement provided | No. of students: English | No. of students: maths | Total number of students | % of dispatched tests |
|---|---|---|---|---|
| Word processor | 481 | 278 | 759 | 4.5 |
| Different colour test paper | 170 | 162 | 332 | 2.0 |
| Modified enlarged print, enlarged print and braille copies | 11 | 17 | 28 | 0.2 |
| Total | 662 | 457 | 1,119 | 6.7% |
NB: Due to some students having multiple access arrangements, they will be featured twice in the table.
3. Results for the test booklets in 2026
Details of the analysis procedures are given in the accompanying document: Background Report: National Reference Test Information. The analysis process followed a sequence of steps. Initially, the tests were analysed using Classical Test Theory to establish that they had performed well, with appropriate difficulty and good levels of reliability. The subsequent analyses used Item Response Theory (IRT) techniques to link all the tests and estimate the ability of all the students on a common scale for each subject, independent of the test or items they had taken. These ability estimates were then used for calculating the ability level at the percentiles associated with the GCSE grade boundaries in 2017. From 2018 onwards, the percentages of students achieving above these baseline ability levels are estimated from the NRT.
3.1. English
The results of the Classical Test Theory analyses are summarised in Table 3.1. This shows the range of the main test performance statistics for the eight English test booklets used.
Table 3.1. Range of Classical Test Theory statistics for the English tests in 2026
| Classical Test Theory statistic | Lowest | Highest |
|---|---|---|
| Number of students taking each test booklet | 819 | 866 |
| Maximum score attained (out of 50) | 42 | 49 |
| Average score attained | 18.12 | 20.57 |
| Standard deviation of scores attained | 8.42 | 9.17 |
| Reliability of the tests (Coefficient Alpha) | 0.77 | 0.80 |
| Average percentage of students attempting each item (%) | 92 | 94 |
These results show that the English test booklets functioned well, and similarly to previous years. The booklets were challenging, with few students attaining over 40 marks and average scores somewhat less than half of the available marks. Maximum raw scores ranged from 42 to 49 across the eight booklets, showing a similar range to that seen in 2025 where maximum raw scores were between 39 and 46. The standard deviation shows that the scores were well spread out, allowing discrimination between the students. This is confirmed by the reliability coefficients, which are at a good level for an English test of this length. Finally, the average percentage of students attempting each item was over 90 per cent for all booklets, indicating that the students were engaging with the test and attempting to answer the majority of questions.
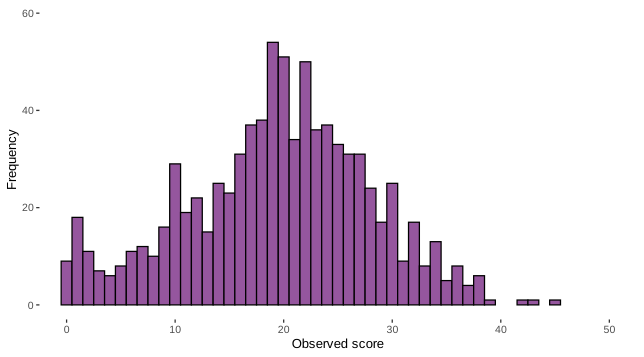
These results were confirmed by the distribution of scores students achieved on the tests. This is shown for one of the tests in Figure 3.1. It is an example of one test booklet only but the distributions were similar for the other tests. The figure shows that students were spread across the range, although no students attained the very highest marks.
Figure 3.1. Score distribution for one of the English tests
In addition, a full item analysis was carried out for each test, in which the difficulty of every question and its discrimination were calculated. These indicated that all the questions had functioned either well or, in a small number of cases, adequately and there was no need to remove any items from the analyses at this point. Additionally, an analysis was conducted to establish if any items had performed markedly differently in 2026 compared with the previous years. Where there are such indications, a formal procedure is followed for reviewing the items to establish whether there could be an external reason for the change. Two English reading items were identified for consideration based on a change in performance relative to the rest of the items. An additional two reading items were included in the investigation based on NFER’s review of performance and due to additional markers being moved into the relevant marking team late in the process due to withdrawals. Following the formal review procedure, the change in performance observed in the two English items originally flagged for differential item functioning (DIF) was considered likely to reflect external changes. For one item, this was a change in the standard applied to the marking of the item this year, while for the other there was evidence that students’ responses may have been influenced by topical news events. This supports the premise that external factors (e.g. a change in the marking) may have contributed to the change in performance. As a result, both items were removed from the link. There was no evidence to suggest an external factor could have affected performance on the additional English items included in the review and these were therefore retained in the link.
Using the common items, the IRT analysis equated the eight tests. The IRT analysis also used the items common between years to equate the tests over years, allowing ability estimates for students in all ten years to be on the same scale. After this had been done, the results showed that the mean ability scores for students were similar for all the tests, confirming that the random allocation to tests had been successful. The results also showed that the level of difficulty of the eight tests was very consistent, with only small differences between them.
Both the Classical Test Theory results and the IRT results for the English tests showed that these had functioned well to provide good measures of the ability of students, sufficient for estimating averages for the sample as a whole.
3.2 Maths
The results of the Classical Test Theory analyses are summarised in Table 3.2. This shows the range of the main test performance statistics for the eight maths tests used.
Table 3.2. Range of Classical Test Theory statistics for the maths tests in 2026
| Classical Test Theory statistic | Lowest | Highest |
|---|---|---|
| Number of students taking each test booklet | 845 | 883 |
| Maximum score attained (out of 50) | 48 | 50 |
| Average score attained | 21.10 | 23.86 |
| Standard Deviation of scores attained | 12.45 | 14.27 |
| Reliability of the tests (Coefficient Alpha) | 0.90 | 0.92 |
| Average percentage of students attempting each item (%) | 84 | 90 |
These results show that the maths tests also functioned well. The maximum score was attained on all but two of the booklets. The average scores were less than half marks for all of the booklets, which is similar to 2025. The standard deviation shows that the scores were well spread out, allowing discrimination between the students. This is confirmed by the reliability coefficients which are at a very good level for a maths test of this length and higher than for English, which is usual. Finally, the average percentage of students attempting each item (between 84 and 90 per cent) is similar to the percentages seen in 2025. As has been the case in previous years, the average percentage of students attempting each item for maths was also lower than that seen for the English test. However, there are more individual items for students to attempt in the maths test.
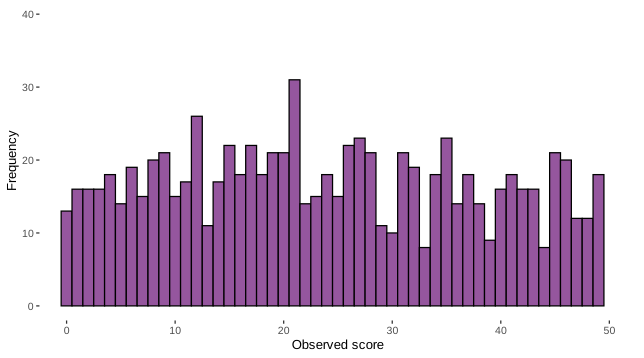
These results were confirmed by the distribution of scores achieved on the tests. This is shown for one of the tests in Figure 3.2. The distributions were similar for the other tests. The figure shows that scores were attained over the range of possible marks and that the students were fairly evenly spread over the range.
Figure 3.2. Score distribution for one of the maths tests
In addition, a full item analysis was carried out for each test, in which the difficulty of every question and its discrimination were calculated. These indicated that all the questions had functioned either well or, in a small number of cases, adequately. All items were therefore retained for the IRT analyses. Additionally, an analysis was conducted to establish if any items had performed markedly differently in 2026 compared with the previous years. Where there are such indications, a formal procedure is followed for reviewing the items to establish whether there could be an external reason for the change and if there is sufficient evidence to remove the item from the link between years. In 2026, no items were removed from the link. There was also no evidence that the continued provision of formulae sheets for GCSE maths exams has had an impact on performance on the NRT items.
Using the common items, the IRT analysis was used to equate the eight tests. The IRT analysis also used the items common between years to equate the tests over years, allowing ability estimates for students in all ten years to be on the same scale. After this had been done, the results showed that the mean ability scores for students were similar for all the tests, confirming that the random allocation to tests had been successful. The results also showed that, although the level of difficulty of the eight tests varied more than the English booklets, it was sufficiently consistent to enable comparable estimates of performance regardless of test taken.
Both the Classical Test Theory results and the IRT results for the maths tests showed that these had functioned well to provide good measures of the ability of students, sufficient for estimating averages for the sample as a whole.
Summary
These initial stages of the analysis, the Classical Test Theory evaluation of test functioning and the IRT equating of the tests, indicate that the NRT performed as well in 2026 as it had in previous years. This allowed the final stages of the analysis, the estimation of the percentages of students above the same ability thresholds as in 2017 and the calculation of their precision, to be undertaken with confidence. These are described in Sections 4 and 5 for English and maths respectively.
4. Performance in English in 2026
The objective of the NRT is to get precise estimates of the percentages of students each year achieving at a level equivalent to three key GCSE grades in 2017: these key grades are 4, 5 and 7. For the NRT in 2017, these baseline percentages were established from the 2017 GCSE population percentages. The NRT ability distribution, based on the IRT analysis, was then used to establish the ability thresholds which corresponded to those percentages. From 2018 onwards, the thresholds correspond to the same level of student ability as the thresholds established in 2017, thus allowing us to estimate the percentage of students above each of those thresholds and track performance over time. Alongside this, based on the sample achieved and the reliability of the tests, we can model the level of precision with which the proportion of students achieving the ability thresholds can be measured. The target for the NRT is to achieve a 95% confidence interval of plus or minus no more than 1.5 percentage points from the estimate at each ability threshold.
Ofqual provided the percentages of students at or above the three relevant grades (grades 4, 5 and 7) taken from the 2017 GCSE population. These are shown in Table 4.1. These percentages were mapped to three ability threshold scores in the NRT in 2017.
Table 4.1. English 2017 NRT baseline thresholds
| Threshold | Percentage of students above threshold from 2017 GCSE |
|---|---|
| Grade 7 and above | 16.8 |
| Grade 5 and above | 53.3 |
| Grade 4 and above | 69.9 |
In 2026, the NRT data for the years 2017 to 2026 were analysed together using IRT modelling techniques. By analysing all the data concurrently, ability distributions can be produced for the samples for each year on the same scale. The percentages of students at each of the three GCSE grade boundaries, fixed on the 2017 distribution, can then be mapped onto the distributions for the subsequent years to produce estimates of the percentage of students at the same level of ability in those years. For example, the percentage of students at the ‘Grade 4 and above’ threshold in the 2017 GCSE population was 69.9 per cent. This is mapped onto the 2017 distribution to read off an ability value at that grade boundary. The same ability value on the distributions for all other years can then be found, and the percentage of students at this threshold or above in those years can be established. In this way, we are able to estimate the percentage of students at the same level of ability as represented in the 2017 GCSE population for each year of the NRT going forward. The precision of these estimates is dependent on both the sample achieved and the reliability of the tests as measures.
Table 4.2 presents the percentages of students achieving above the specified grade boundaries for the years 2017 to 2026. The 95% confidence intervals for the percentages are provided in brackets alongside the estimates. This is important as it shows that, although there have been changes in performance, these are often within the confidence intervals. The statistical interpretation of the differences is discussed below.
Table 4.2. Estimated percentages at grade boundaries in English
| Year | Grade 4 and above | Grade 5 and above | Grade 7 and above |
|---|---|---|---|
| 2017 | 69.9 (68.3-71.5) | 53.3 (51.7-54.9) | 16.8 (15.6-18.0) |
| 2018 | 69.3 (67.6-71.0) | 53.5 (51.6-55.3) | 17.4 (16.2-18.7) |
| 2019 | 66.0 (64.4-67.7) | 50.2 (48.5-51.9) | 16.7 (15.5-17.9) |
| 2020 | 68.3 (66.7-69.9) | 52.8 (51.1-54.6) | 18.4 (17.2-19.7) |
| 2021 | 67.6 (65.6-69.6) | 53.2 (51.1-55.4) | 19.8 (18.1-21.6) |
| 2022 | 65.8 (64.1-67.6) | 50.1 (48.3-51.8) | 17.2 (15.9-18.6) |
| 2023 | 66.1 (64.4-67.9) | 50.8 (49.0-52.6) | 17.5 (16.2-18.8) |
| 2024 | 65.1 (63.4-66.8) | 49.1 (47.5-50.7) | 16.2 (15.1-17.4) |
| 2025 | 66.9 (65.3-68.6) | 51.8 (50.1-53.5) | 18.3 (17.0-19.6) |
| 2026 | 66.1 (64.6-67.6) | 50.3 (48.8-51.9) | 17.6 (16.4-18.9) |
The 2017 figures in the table above are based on the NRT study, rather than the 2017 GCSE percentages. Note that, because of the way in which they have been computed, they match closely with the GCSE percentages. The confidence intervals for them reflect the fact that the NRT 2017 outcomes carry the statistical error inherent in a sample survey, as per the subsequent years.
In each year of the NRT, the percentages for previous years are re-estimated due to the concurrent calibration approach which analyses all of the data together in a single IRT model. Some degree of variation is therefore expected with the addition of more data, and the differences seen are small.
Table 4.3 shows the half widths of the confidence intervals. The confidence intervals for 2021 are wider than other years, reflecting the smaller sample size in that year. For NRT 2026, the precision for all three grade boundaries is in line with the values for other years.
Table 4.3. English NRT half width of confidence intervals each year
| Year | Grade 4 and above | Grade 5 and above | Grade 7 and above |
|---|---|---|---|
| 2017 | 1.6 | 1.6 | 1.2 |
| 2018 | 1.7 | 1.8 | 1.3 |
| 2019 | 1.7 | 1.7 | 1.2 |
| 2020 | 1.6 | 1.8 | 1.3 |
| 2021 | 2.0 | 2.1 | 1.8 |
| 2022 | 1.7 | 1.8 | 1.3 |
| 2023 | 1.8 | 1.8 | 1.3 |
| 2024 | 1.7 | 1.6 | 1.2 |
| 2025 | 1.7 | 1.7 | 1.3 |
| 2026 | 1.5 | 1.5 | 1.3 |
Figure 4.1 presents 95% confidence intervals around the percentages achieving at least the specified grade boundary in 2026, as compared with previous years and the 2017 population baseline percentages. The 2017 population percentages are represented as dotted lines and the trend lines across years as solid lines. This format has been used to encourage the reader to compare the point estimate confidence bands for each year with the 2017 baseline population percentages, bearing in mind the confidence intervals.
Figure 4.1. Long term changes in NRT English over time from 2017 baseline
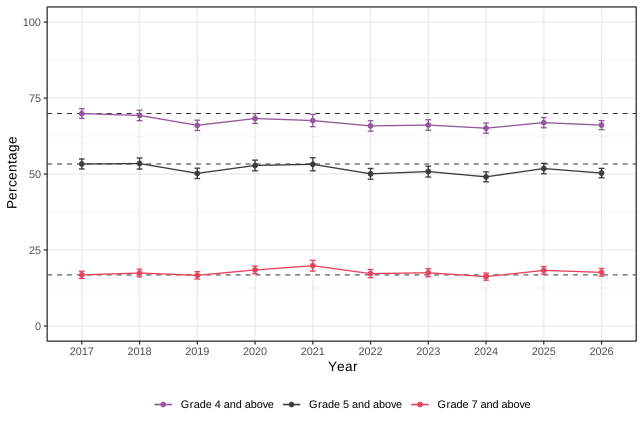
Some patterns in the results can be observed from the chart, though care should be taken not to over-interpret small differences which may arise due to statistical uncertainty around the measurements. Nevertheless, the chart suggests that performance in English in 2026 appears to have declined very slightly relative to 2025. In the first few years of the NRT, from the baseline in 2017 to 2019, there had been a small decline in the percentage of students achieving at-or-above both grades 4 and 5. In 2020 there was a small upturn in performance, which continued into 2021, despite the impact of school closures due to the Covid-19 pandemic. Following a dip in 2022, performance appears to have fluctuated by very small amounts.
A key question arising for the NRT results in a given year is to determine if differences in outcomes across the years are statistically significant. For the NRT, several comparisons could be made between different pairs of years at different grade boundaries, and this gives rise to the possibility that changes arising by chance may seem real. Hence, the criteria for significance that have been used are adjusted for multiple comparisons. For more information, see Appendix A.
The research question NFER was asked to address is to compare the performance in 2026 with the performance in the baseline year of 2017 at each of the three grade boundaries. Adjusting for three comparisons, the NRT English data shows that there has been a statistically significant overall decline in the proportion of students achieving grade 4 or above between 2017 and 2026 at the 1% level of significance and a decline in the proportion of students achieving grade 5 or above at the 5% level. There is no statistically significant difference in performance between 2017 and 2026 at the grade 7 grade boundary.
5. Performance in maths in 2026
The objective of the NRT is to get precise estimates of the percentages of students each year achieving at a level equivalent to three key GCSE grades in 2017: these key grades are 4, 5 and 7. For the NRT in 2017, these baseline percentages were established from the 2017 GCSE population percentages. The NRT ability distribution, based on the IRT analysis, was then used to establish the ability scores which corresponded to those percentages. From 2018 onwards, the thresholds correspond to the same level of student ability as the thresholds established in 2017, thus allowing us to estimate the percentage of students above each of those thresholds and track performance over time. Alongside this, based on the sample achieved and the reliability of the tests, we are able to model the level of precision with which the proportion of students achieving the ability scores can be measured. The target for the NRT is to achieve a 95% confidence interval of plus or minus no more than 1.5 percentage points from the estimate at each ability threshold.
Ofqual provided the percentages of students at or above three relevant grades (grades 4, 5 and 7) taken from the 2017 GCSE population. These are shown in Table 5.1. These percentages were mapped to three ability threshold scores in the NRT in 2017.
Table 5.1. Maths 2017 NRT baseline thresholds
| Threshold | Percentage of students above threshold from 2017 GCSE |
|---|---|
| Grade 7 and above | 19.9 |
| Grade 5 and above | 49.7 |
| Grade 4 and above | 70.7 |
In 2026, the NRT data for the years 2017 to 2026 were analysed together using IRT modelling techniques. By analysing all the data concurrently, ability distributions can be produced for the samples for each year on the same scale. The percentages of students at each of the three GCSE grade boundaries, fixed on the 2017 distribution, can then be mapped onto the distributions for the subsequent years to produce estimates of the percentage of students at the same level of ability in those years. For example, the percentage of students at the ‘Grade 4 and above’ threshold in the 2017 GCSE population was 70.7 per cent. This is mapped onto the 2017 distribution to read off an ability value equivalent to that grade boundary. The same ability value on the distributions for all other years can then be found, and the percentage of students at this threshold or above in those years can be established. In this way, we are able to estimate the percentage of students at the same level of ability as represented in the 2017 GCSE population for each year of the NRT going forward. The precision of these estimates is dependent on both the sample achieved and the reliability of the tests as measures.
Table 5.2 presents the percentages of students achieving above the specified grade boundaries for the years 2017 to 2026. The 95% confidence intervals for the percentages are provided in brackets alongside the estimates. This is important as it shows that although there have been changes in performance, these are often within the confidence intervals. The statistical interpretation of the differences is discussed below.
Table 5.2. Estimated percentages at grade boundaries in maths
| Year | Grade 4 and above | Grade 5 and above | Grade 7 and above |
|---|---|---|---|
| 2017 | 70.7 (69.3-72.1) | 49.7 (48.1-51.3) | 19.9 (18.6-21.2) |
| 2018 | 73.3 (71.9-74.7) | 52.4 (50.8-54.0) | 21.6 (20.2-22.9) |
| 2019 | 73.2 (71.8-74.6) | 51.8 (50.3-53.4) | 22.6 (21.3-23.9) |
| 2020 | 74.5 (73.2-75.9) | 54.9 (53.4-56.5) | 24.4 (23.1-25.8) |
| 2021 | 70.2 (68.3-72.2) | 49.9 (47.8-51.9) | 21.9 (20.0-23.8) |
| 2022 | 71.6 (70.1-73.1) | 50.3 (48.7-51.9) | 21.2 (19.8-22.6) |
| 2023 | 70.1 (68.6-71.5) | 48.8 (47.2-50.3) | 20.0 (18.8-21.2) |
| 2024 | 70.8 (69.3-72.3) | 50.3 (48.7-51.9) | 22.3 (21.0-23.7) |
| 2025 | 70.8 (69.5-72.2) | 50.7 (49.2-52.2) | 22.2 (21.0-23.4) |
| 2026 | 71.6 (70.2-73.0) | 51.4 (50.0-52.9) | 23.9 (22.6-25.2) |
The 2017 figures in the table above are based on the NRT study, rather than the 2017 GCSE percentages. Note that, because of the way in which they have been computed, they match closely with the GCSE percentages. The confidence intervals for them reflect the fact that the NRT 2017 outcomes carry the statistical error inherent in a sample survey, as per the subsequent years.
Since the percentages for previous years have been re-estimated following the concurrent calibration with the 2026 data, these figures differ slightly from those reported in previous years. Some degree of variation is expected given the addition of more data, and the differences seen are small.
Table 5.3 shows the half widths of the confidence intervals. The confidence intervals for all years are similar to those reported previously, despite a change in the way precision is calculated for the NRT since 2023. The confidence intervals for 2021 are wider than other years, reflecting the smaller sample size in that year. For NRT 2026, the precision for all three grade boundaries is in line with the values for other years.
Table 5.3. Maths NRT half width of confidence intervals each year
| Year | Grade 4 and above | Grade 5 and above | Grade 7 and above |
|---|---|---|---|
| 2017 | 1.4 | 1.6 | 1.3 |
| 2018 | 1.4 | 1.6 | 1.4 |
| 2019 | 1.4 | 1.6 | 1.3 |
| 2020 | 1.3 | 1.5 | 1.3 |
| 2021 | 1.9 | 2.1 | 1.9 |
| 2022 | 1.5 | 1.6 | 1.4 |
| 2023 | 1.5 | 1.5 | 1.2 |
| 2024 | 1.5 | 1.6 | 1.4 |
| 2025 | 1.3 | 1.5 | 1.2 |
| 2026 | 1.4 | 1.5 | 1.3 |
Figure 5.1 presents 95% confidence intervals around the percentages achieving at least the specified grade boundary in 2026, as compared to previous years and the 2017 population baseline percentages. The 2017 population percentages are represented as dotted lines and the trend lines across years as solid lines. This format has been used to encourage the reader to compare the point estimate confidence bands for each year with the 2017 baseline population percentages, bearing in mind the confidence intervals.
Figure 5.1. Long term changes in NRT maths over time from 2017 baseline
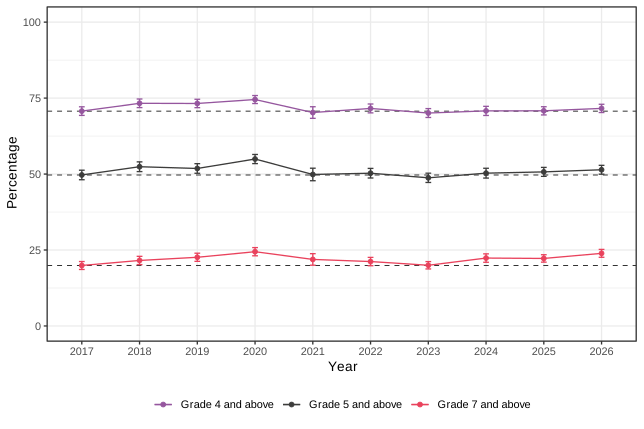
Some patterns in the maths results can be observed from the chart, though care should be taken not to over-interpret small differences which may arise due to statistical uncertainty around the measurements. Nevertheless, the chart shows a relatively steady increase in the percentage of students achieving at-or-above all three grade boundaries from 2017 to 2020, followed by a sharp drop in 2021, back to around the 2017 level of performance. Differences between the following two years were small, with a slight decline overall. The chart suggests some recovery from 2024 onwards, particularly at grade 7, which has continued in 2026.
A key question arising for the NRT results in a given year is to determine if differences in outcomes across the years are statistically significant. For the NRT, several comparisons could be made and this gives rise to the possibility that changes arising by chance may seem real. Hence, the criteria for significance that have been used are adjusted for multiple comparisons. For more information, see Appendix A.
The research question NFER was asked to address is to compare the performance in 2026 with the performance in 2017 at each of the three grade boundaries. Adjusting for three comparisons, the NRT maths data shows that there has been a statistically significant increase in performance between 2017 and 2026 at the grade 7 boundary, significant at the 1% level of significance. There are no statistically significant differences in performance between 2017 and 2026 at the grade 4 or grade 5 boundaries.
6. Appendix A: A brief summary of the NRT
English
The English test takes one hour to administer and follows the curriculum for the English language GCSE. In each of the eight English test booklets, there are two components; the first is a reading test and the second a writing test. Each component carries 25 marks and students are advised to spend broadly equal time on each component.
The reading test is based on an extract from a longer prose text, or two shorter extracts from different texts. Students are asked five, six or seven questions that refer to the extract(s). Some questions of one to four marks require short responses or require the student to select a response from options provided. In each booklet, the reading test also includes a 6-mark question and a 10-mark question, where longer, more in-depth responses need to be given. These focus on analysis and evaluation of aspects of the text or a comparison between texts.
The writing test is a single, 25-mark task. This is an extended piece of writing, responding to a stimulus. For example, students may be asked to describe, narrate, give and respond to information, argue, explain or instruct.
Maths
For maths, a separate sample of students is also given one hour to complete the test. The test includes questions on number, algebra, geometry and measures, ratio and proportion, and statistics and probability – the same curriculum as the current GCSE. Each of the eight test booklets has 13 or 14 questions with a total of 50 marks and each student takes just one of the test booklets.
Analysis
The analysis process followed a sequence of steps. Initially, the tests were analysed using Classical Test Theory to establish that they had performed well, with appropriate difficulty and good levels of reliability. The subsequent analyses used Item Response Theory techniques to link all the tests together from 2017 to 2026 and estimate the ability of all the students on a common scale for each subject for each year, independent of the test or items they had taken. These ability estimates were then used for calculating the ability level at the percentiles associated with the GCSE grade boundaries in 2017 and mapping these onto the distributions for subsequent years to generate percentile estimates for those years.
Multiple Comparisons
The statistical significance of the difference between two percentages estimated in two years, say 2017 and 2026, may be approached with a two-sample t-statistic. Because of the huge number of degrees of freedom, the value can be compared with the standard normal distribution rather than the t-distribution. For a comparison of two percentages, say the percentage of students at grade 4 or higher between two years, the critical value at a confidence level of 0.05 (5%) would usually be 1.96. However, since there are three grade thresholds across multiple years, there are several comparisons which could be made (up to 135 if all pairs of years were compared across all three grade boundaries). As the number of simultaneous comparisons grows, the probability that some of them are significant by chance rapidly increases. To ensure that the chosen level of significance is guaranteed overall, we implemented a Bonferroni adjustment for multiple comparisons.