The Future Cohort Study: understanding Universal Credit’s future in-work claimant group
Published 1 July 2021
Applies to England, Scotland and Wales

© Crown copyright 2021
This publication is licensed under the terms of the Open Government Licence v3.0 except where otherwise stated. To view this licence, visit nationalarchives.gov.uk/doc/open-government-licence/version/3 or write to the Information Policy Team, The National Archives, Kew, London TW9 4DU, or email: psi@nationalarchives.gov.uk.
Where we have identified any third party copyright information you will need to obtain permission from the copyright holders concerned.
This publication is available at https://www.gov.uk/government/publications/the-future-cohort-study-understanding-universal-credits-future-in-work-claimant-group/the-future-cohort-study-understanding-universal-credits-future-in-work-claimant-group
You may reuse this information (not including logos) free of charge in any format or medium, under the terms of the Open Government Licence. To view this licence, visit The Open Government Licence or write to the Information Policy Team, The National Archives, Kew, London TW9 4DU, or email psi@nationalarchives.gov.uk.
This document/publication is also available on our website at Research at DWP.
If you would like to know more about DWP research, email socialresearch@dwp.gov.uk
First published July 2021.
ISBN 978-1-78659-341-2
Views expressed in this report are not necessarily those of the Department for Work and Pensions (DWP) or any other government department.
Acknowledgements
The authors would like to thank all of the people who gave their time to participate in this research. We would also like to thank Amanda Langdon, Tanya Saunders, Peter Harrison-Evans and Kate Warner at DWP for their valuable input throughout this research programme.
The Authors
This report was authored by researchers at the Ipsos MORI Social Research Institute:
Trinh Tu, Head of Employment, Welfare and Skills, Ipsos MORI
Joanna Crossfield, Research Director, Ipsos MORI
Yasmin White, Research Manager, Ipsos MORI
Jamie Douglas, Graduate Research Executive, Ipsos MORI
Glossary of terms
| Term | Definition |
|---|---|
| Future Cohort | Current tax credit and Housing Benefit claimants who, based on their current individual and household income, would fall into the ‘Light Touch’ group in Universal Credit (UC) if moved across to UC today. |
| In-work progression | This refers to increasing hours, increasing pay, or gaining new skills/qualifications, or a combination of these, in a current or new job. |
| ‘Light Touch’ group | Group made up of claimants who are in work but on low pay – likely to be working part-time, at or near the National Minimum Wage or National Living Wage. |
| Pull factor | Something which allows, encourages or facilitates progression in work. |
| Push factor | Something which prevents, discourages or impedes progression in work. |
| Work Coaches | Front line Department for Work and Pensions staff based in Jobcentres. Their main role is to support benefit participants into work by challenging, motivating, providing personalised advice and using knowledge of local labour markets. |
List of Abbreviations
AET: Administrative Earnings Threshold
CATI: Computer Assisted Telephone Interviewing
CET: Conditionality Earnings Threshold
CTC: Child Tax Credit
DWP: Department for Work and Pensions
ESA: Employment and Support Allowance
ESOL: English as a Second Language
HB: Housing Benefit
JCP: Jobcentre Plus
JSA: Jobseeker’s Allowance
RCT: Randomised Controlled Trial
UC: Universal Credit
WTC: Working Tax Credit
Executive Summary
This report presents findings from quantitative and qualitative research undertaken on behalf of the Department for Work and Pensions (DWP) into the composition and characteristics of the “future cohort”. These are the current tax credit and Housing Benefit claimants who, based on their individual and household income, would fall into the ‘Light Touch’ group in Universal Credit (UC) if moved across to UC today. The ‘Light Touch’ group is made up of claimants who are in work but on low pay – likely to be working part-time, at or near the National Minimum Wage or National Living Wage.
The purpose of this study was to anticipate the likely composition of the ‘Light Touch’ group once the migration of tax credit and Housing Benefit claimants to UC is complete, thereby informing the development of DWP’s services to support these claimants to progress in work. The report explores claimants’ household and employment circumstances, their attitudes towards work and progression, including perceived barriers and enablers, and their needs and preferences around different types of support.
Research design
This research comprised a quantitative telephone survey conducted between April and September 2019 with 3,114 in-work claimants[footnote 1] who were in receipt of Working Tax Credits, Child Tax Credits and/or Housing Benefit. The survey was followed by 60 qualitative depth interviews with individuals (including some paired interviews with both the claimant and their partner) and 11 focus groups.
The quantitative data was used to conduct a segmentation analysis – a statistical technique to group respondents who are similar to one another into discrete segments. This will support DWP to develop tailored services to effectively meet the needs of different groups.
A summary of the findings from the quantitative and qualitative strands of research is presented below.
Composition and characteristics of the future cohort
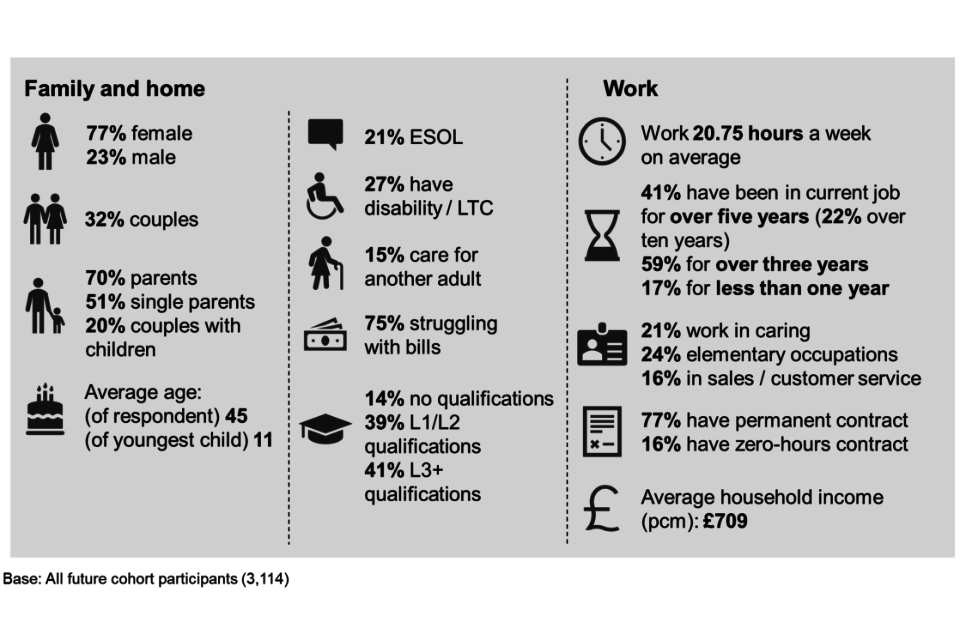
The future cohort is made up largely of women (77%) and parents (70%). Single parents are the largest group (51%), followed by couples with children (20%). Singles or couples without children make up 30% of the future cohort. The average age of individuals in the future cohort is those aged 45. The average age of singles or couples without children is slightly older at 47.5.
Among half of parents (50%), their youngest child is aged between 3 and 11 and for a quarter (23%) their youngest child is at or approaching secondary education. The average age of the youngest child is 11. Lone parents are more likely than couples to have children already in secondary education, with an average age of 12 and 10 respectively, for the youngest child. Where the respondent lives with a partner, 58% of partners are not in work. This type of household is more common among older respondents, aged 45 and over (65% of partners are not in work), and couples without any dependent children (70%).
A quarter (27%) of the future cohort say they are limited in their day-to-day activities because of a health condition or disability. Health conditions or disabilities are more common among men than women (36% compared with 24%), and older claimants (20% of under-35s rising to 40% of those aged over 60).
One fifth (18%) are from an ethnic minority and a similar proportion (21%) have English as a second language. The majority of respondents who have English as a second language classify themselves as from an ethnic minority (59%).
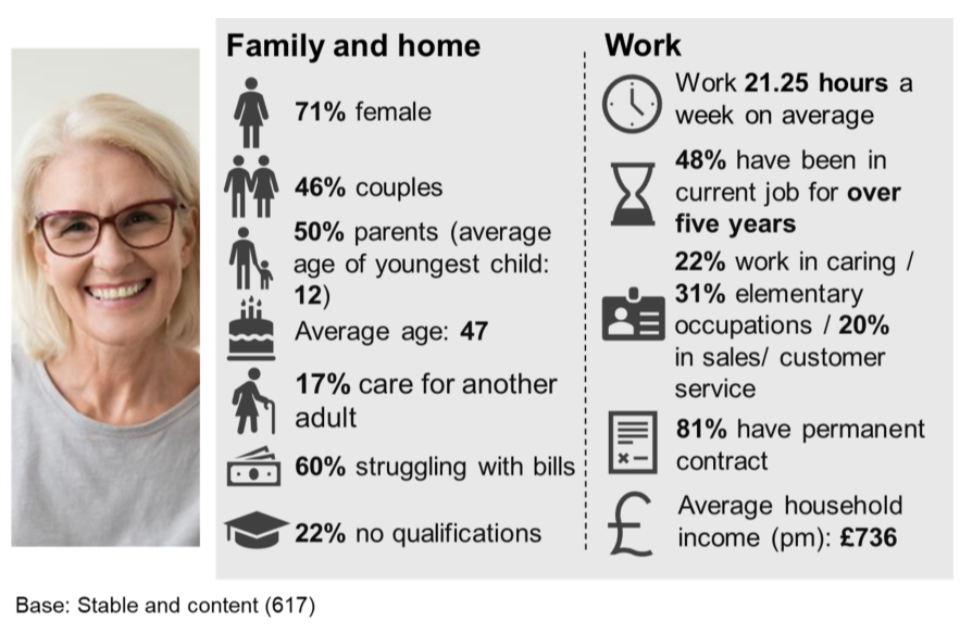
Overall key characteristics of the future cohort

" "
Work, income and skills
Many of the future cohort are in stable employment: 4 in 10 (41%) have been in their current job for over 5 years, and a similar proportion (42%) have been in their role for between one and 5 years. Respondents with no qualifications are more likely to have been in the same job for more than 5 years (48%). Three-quarters of future cohort respondents (77%) have a permanent contract compared to 16% on a zero-hours contract and 4% on a temporary/fixed term or seasonal contract.
Respondents work an average of 21 hours per week. Lone parents work slightly more hours than parents in couples on average: 21 hours compared with 20 hours. Average household earned income is £709 per month. A quarter (26%) have monthly earnings of less than £500 and 16% more than £1,000. Average earnings are highest among couples with children (£888), then couples without children (£696), then lone parents (£685) and lowest among lone adults without children (£586).
Among couples with children, there is a positive relationship between average household earnings and age of the youngest child: £796 where youngest child is aged 16 and over; £790 where youngest child is aged 12-15 and £700 where the youngest child is aged between 4 and 11.
Three-quarters (75%) of the future cohort report at least some difficulty with keeping up with their bills and other financial commitments. Parents are more likely to report financial difficulties than single adults (77% compared with 71%).
Finally, there is a wide variation in the qualification levels held by the cohort. The most common qualifications are levels 2 and 3 (21% and 25% respectively) but there is also a significant minority (17%) with a degree or above. Conversely, a third only hold a level 1 qualification (18%) or have no formal qualification at all (14%). Respondents with a health condition or disability are most likely to have a degree or higher (39%) but they are also most likely to have no qualifications (25%).
Attitudes towards current role and barriers to progression
The majority of the future cohort are satisfied with the work that they do. Eight in ten (81%) report feeling satisfied with their job overall. Satisfaction is highest with work-life balance (80%) and the number of hours worked (79%). Two-thirds are satisfied with their pay and training opportunities (64% and 66% respectively) and over half (56%) with opportunities for career development.
Reflecting the high overall satisfaction, two-thirds (64%) of respondents strongly agree that their biggest priority is keeping their current job rather than looking to get further at work.
When asked if anything made it difficult to progress in their current job or get a new job, nearly 8 in 10 (81%) of the future cohort reported at least one barrier: 35% mention one barrier to progression, 29% mention 2 barriers, and 17% mention 3 or more barriers. The types of barriers faced by the future cohort are diverse but a common theme among them is the need to balance work with caring responsibilities and health conditions – reflecting the high representation of parents and people with a long-term health condition or disability. These barriers restrict the number of hours that respondents feel they can work and the types of jobs they can consider.
Respondents in the qualitative research, particularly those with children, valued the stability of their current role, and were nervous about making changes (for example, getting a new job) which they felt could upset the balance of work and wider care/family responsibilities.
Motivation, capability and opportunity to progress
To support the design of in-work services a number of the questions in the quantitative survey were structured around the ‘COM-B’ behaviour change model (Michie et al. 2011[footnote 2]). This model identifies 3 fundamental drivers of behaviour (B): capability (C), opportunity (O) and motivation (M).
Considering motivation, the survey found that while the majority of the future cohort are satisfied with their current job, many are also taking steps to explore or pave the way for progression. Around 7 in 10 (72%) report taking at least one action to progress in the past 12 months, most commonly taking a training course (34%) or speaking to their manager about progression opportunities (32%). Lone parents and parents with young children are also more likely than average to have taken steps to progress, while respondents without children were more likely not to have taken any actions (35% compared with 26% of parents).
Motivation to increase pay the next 12 months is strong with 72% saying it is important for them to increase their pay. However, fewer say they want to increase their hours (42%) or get a new job (37%). Furthermore, 3 in 5 (58%) said they would find it difficult to increase their hours if they were offered. The groups more likely to struggle to increase their hours include lone parents, parents with children in primary education, and those with a health condition or disability.
In the qualitative research, parenting and childcare emerged as an important theme which influenced motivation to progress. There were examples of parents being held back from increasing their hours because of a lack of good quality, accessible and/or affordable childcare. However, parents’ considerations went beyond the practical and financial aspects of childcare. In particular, values in relation to parenting were widely discussed. Parents who emphasised the importance of teaching children about work and financial independence reported that this acted to motivate them to progress in work. However, those who felt that spending time with their children was the more important part of their role as a parent were reluctant to increase their hours. This was particularly the case for lone parents and/or those with young children.
In terms of capability, the majority of the future cohort express confidence in their ability to find progression opportunities (74%) and apply for a new job (63%). However, nearly half (47%) feel they first need to improve their skills and qualifications. Those lacking confidence tend to be older (aged 45 or over), without children, with a health condition or disability and without any formal qualification. Participants in the qualitative research cited a lack of up-to-date skills such as IT skills inhibiting their confidence to apply for jobs with progression opportunities. This was more common among older participants and those who had been in the same job for a long period of time.
When asked about opportunities to progress in the local labour market respondents were generally pessimistic. Three in five (61%) agree that the “jobs on offer do not pay enough to make working more hours financially worthwhile”, and more than half (54%) agree that “there just aren’t enough full-time vacancies for everyone at the moment”. Participants in the qualitative research also expressed doubts over the availability of permanent jobs with better pay or hours. There was a general impression that most vacancies were for zero-hours contracts, and a consensus that it was not worthwhile to trade their current stability for potentially more, but variable, hours.
Segmentation
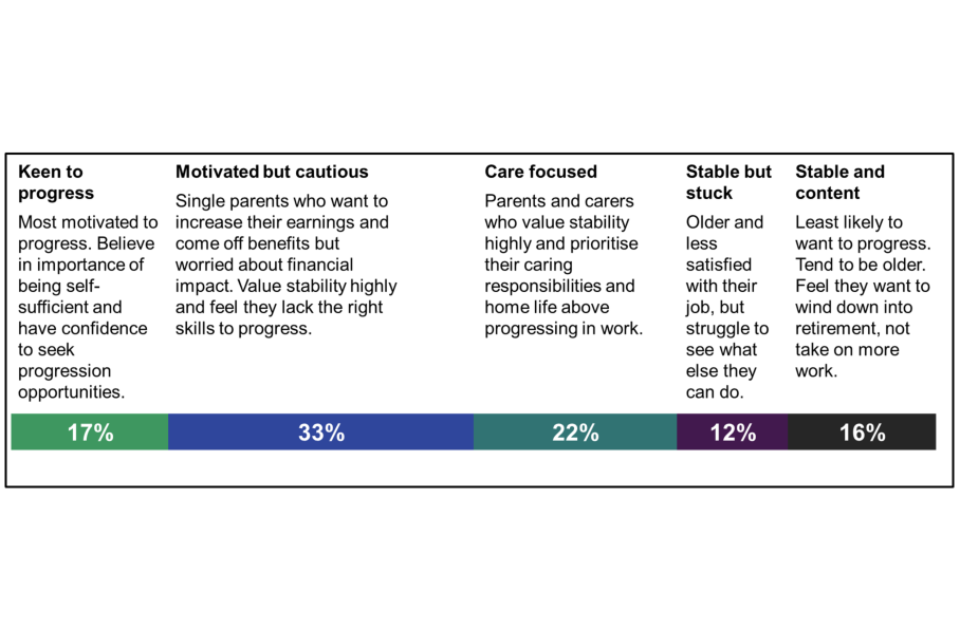
The segmentation analysis produced 5 discrete groups of the future cohort claimants, based on their attitudes and behaviour with respect to in-work progression. The 5 groups and their prevalence are: ‘Keen to progress’ (17%), ‘Motivated but cautious’ (33%), ‘Care focused’ (22%), ‘Stable but stuck’ (12%) and ‘Stable and content’ (16%).
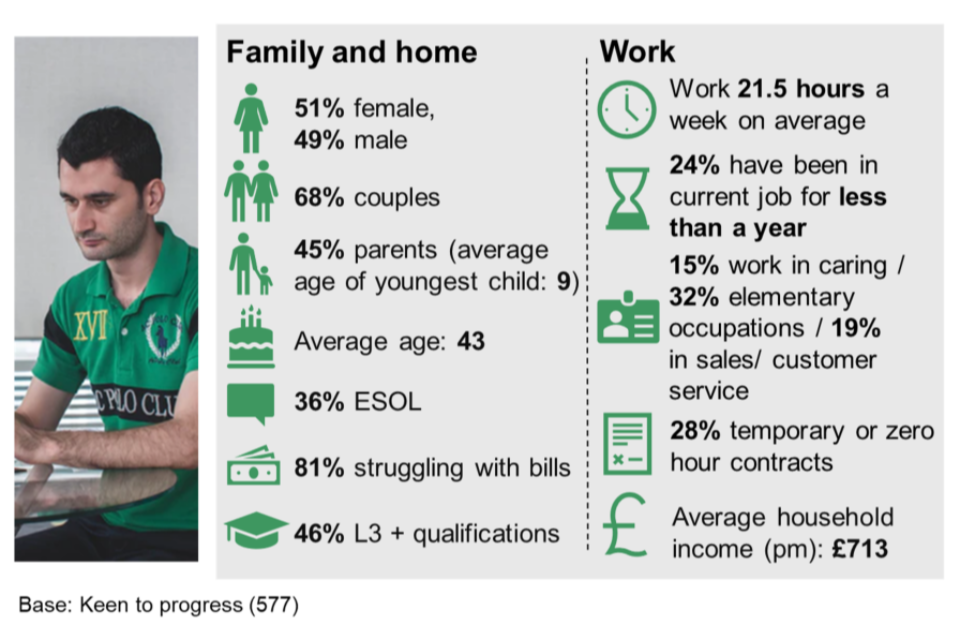
The ‘Keen to progress’ group is the most gender balanced segment (49% are male and 51% female). Unlike the other segments, the majority (68%) live with a partner, either with children (45%) or without children (23%). Compared with other segments, ‘Keen to progress’ respondents have higher qualification levels; almost half (46%) qualified to level 3 or above, however they are also more likely than other segments to be in zero-hours or temporary contracts (28%). Motivation to progress is high in this group; 88% have, for example, taken some action to progress in the past year, and 69% say they want to increase their hours over the next 12 months.
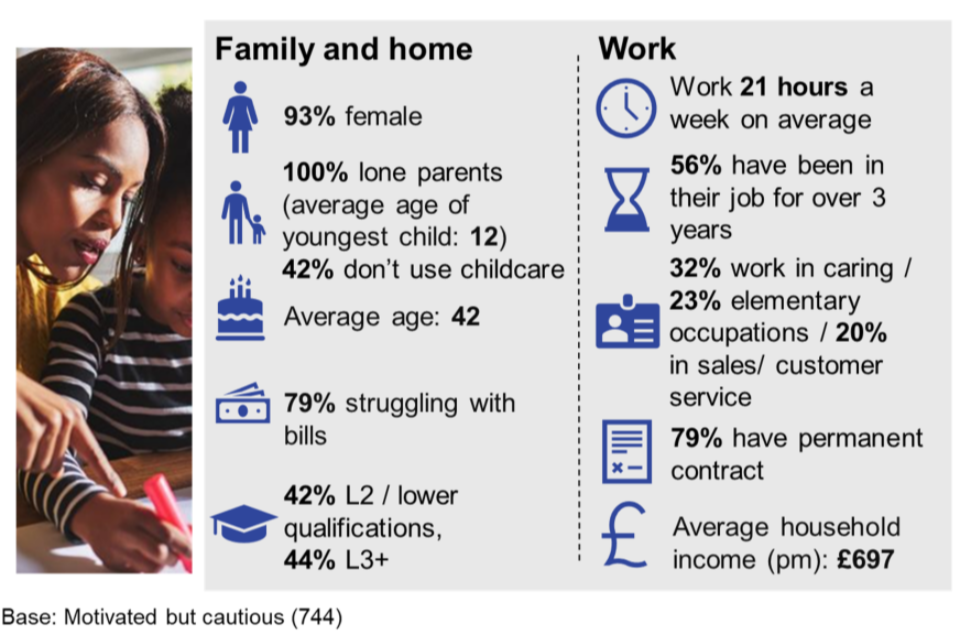
The ‘Motivated but cautious’ group is made up entirely of lone parents and is predominantly female (93%). They are more likely than average to have a child over the age of 16 (33%, compared with 27%). They have a younger age profile (56% are under 45 years old) and are more likely than other segments to say they struggle financially. This group consists of lone parents who want to increase their earnings and come off benefits but are concerned that changes to their work patterns could negatively impact their finances and stability. This group feel they need to develop their skills and qualifications before they are able to progress.
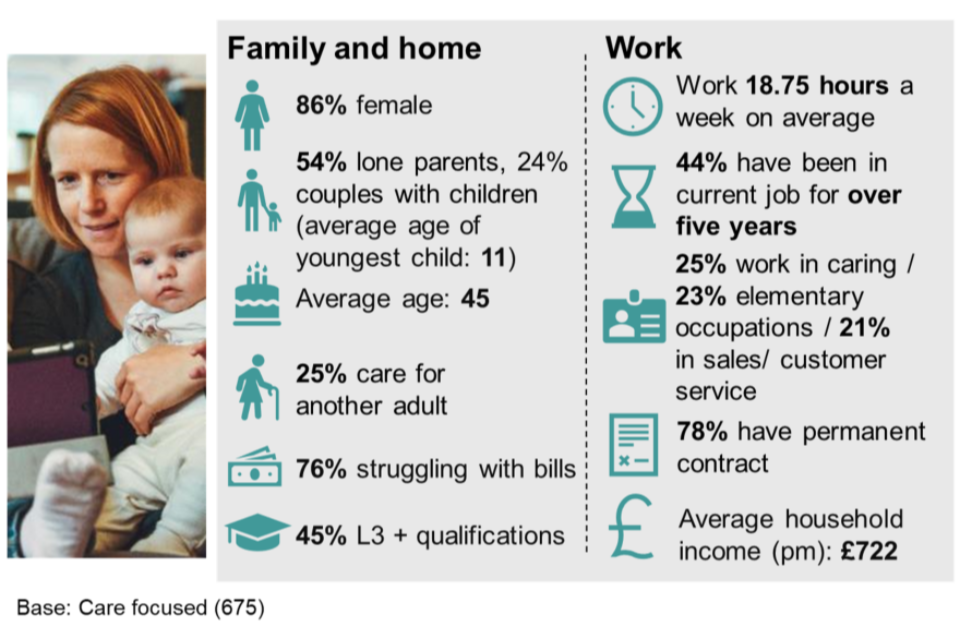
‘Care focused’ claimants are predominantly female (86%), and more than three-quarters have dependent children (54% are lone parents, and 24% live with a partner and children). A quarter (25%) have caring responsibilities for another adult, the highest of any segment. This group work the fewest hours on average (19 hours), and the vast majority say their home life would suffer if they increased their hours (88%). This group value stability, and prioritise their caring responsibilities above progressing in work.
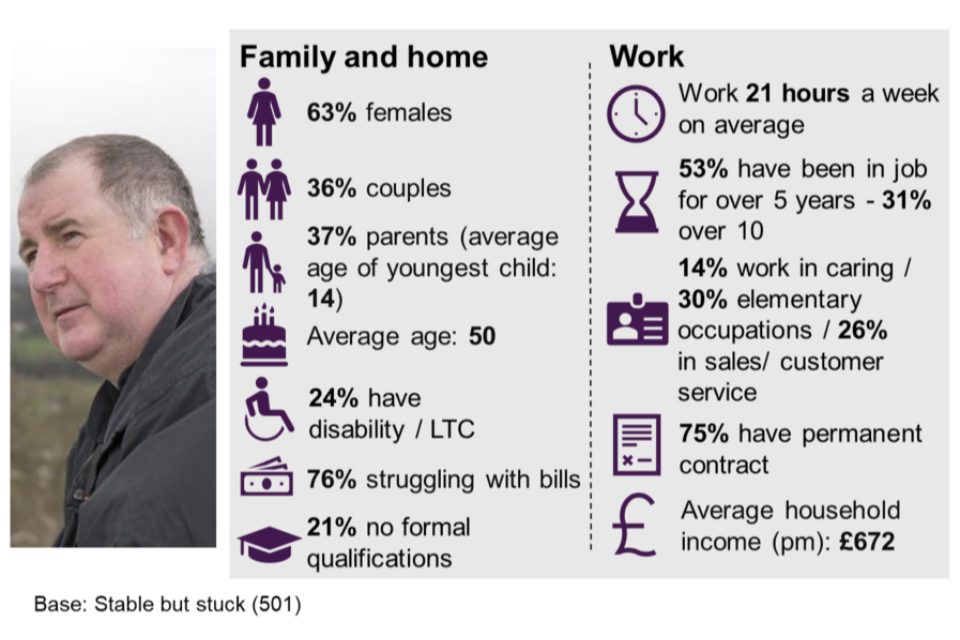
The ‘Stable but stuck’ segment has the second highest proportion of male claimants (37%) and older claimants: 72% are aged 45 or over, including 20% aged over 60. This group have mostly been in their job for more than 5 years (53%). This group are also more likely to have a long-term health condition or disability (40%) and no qualifications (21%), both of which impact on capability to progress. Respondents in this segment tend to be more dissatisfied with their job (17%, compared with the average, 10%) but they often don’t know how, or lack confidence, to progress (38% disagree that they feel confident applying for a new job, compared to the average, 26%).
The majority of the ‘Stable and content’ group are female (71%), and they too have an older age profile: 63% are 45 and over. Qualification levels tend to be lower than other segments (22% have no formal qualifications), but they are less likely than other segments to say they struggle financially (60%). ‘Stable and content’ respondents are the most likely to have a permanent contract in their job (81%). This group are the least likely to see progression as important; 78% do not feel it is important for them to increase their hours and almost all (97%) say that they are satisfied with their current job.
Support needs and preferences
Survey respondents were asked about their preferences surrounding progression, which involved them ranking different features of a job in terms of how much it would encourage them to progress. When considering the relative value of these different job features, respondents across the sample as a whole are most likely to value “a role which fits with my caring or family responsibilities and/or health condition”. However, for the ‘Keen to progress’ and ‘Motivated but cautious’ segments “a role that pays enough for me to come off benefits or tax credits completely and be better-off” is ranked the most highly.
When asked what support they would like to help them progress, respondents identified support and training with work-related skills (51%), support to pursue further or higher education (45%) and support and training on finding or getting a new job (42%). Respondents are most likely to say they would like their employer to support them to progress in work (61%), while fewer respondents wanted support from online sources (40%), friends or family (36%) or Jobcentre Plus (JCP) (34%).
The qualitative research found that the type of intervention which best suited participants depended on their needs, current work status and attitudes towards progression. Participants with more complex needs such as health, debt or family circumstances were most open to holistic support including funding for childcare or debt. Those with lower existing skills felt that JCP was an appropriate provider, but those with higher skills or qualifications were more reluctant to visit a JCP and preferred a private employment agency or accredited training provider. Participants who were happy in their job and could see progression opportunities with their current employer preferred to get training in this way.
How participants wanted support to be provided was related to the content. They felt that online was suitable for factual based content. For support relating to personal experiences or soft skills, participants preferred face-to-face support.
Overall, the future cohort has a diverse range of support needs, and this reflects the high variance in the barriers to progression faced by this group. These findings underscore the need for tailored support which can adapt to varying circumstances and requirements.
1. Background and methodology
1.1. Policy context and existing evidence
Welfare reform is a key government commitment, to make the welfare system fit for the 21st Century: fairer, simpler, providing a transitional support system in times of need, whilst protecting the most vulnerable and being affordable to the taxpayer. The aim is to reduce dependency on the benefits system; increase conditionality and activation policies; make work pay and increase incentives to work. Universal Credit is an essential component, replacing the majority of income-related working age benefits, or “legacy” benefits (Jobseeker’s Allowance (JSA), Employment and Support Allowance (ESA), Income Support (IS), Housing Benefit (HB)), and tax credits with a single monthly payment based on real-time information on earnings.
Over the next few years existing legacy benefit and tax credit claimants will be gradually moved over to Universal Credit, with ‘Full Service’ for all claimants established by 2024. DWP currently estimates that out of 7 million households claiming UC, at least 3 million will have someone in paid work.
Of this in work group, just over one million individuals are projected to fall into the ‘Light Touch’ group. ‘Light Touch’ claimants are those who are in work and have individual and household earnings falling between lower and upper earnings thresholds (the Administrative Earnings Threshold (AET) and Conditionality Earnings Threshold (CET) respectively). The level at which these income thresholds are set mean that those in the Light Touch group are generally working part-time and earning close to the National Minimum Wage or National Living Wage. Those earning above the CET fall into the ‘Working Enough’ group.
Increased numbers of in-work claimants represents a significant change to DWP’s customer base and as a result DWP is looking to develop services to support these claimants, with a particular focus on helping them to increase their earnings and progress in their careers. DWP has taken steps to build the evidence base around progression support in UC, through 3 small (‘Proof of Concept’) pilots[footnote 3] running between 2014 and 2016, and a large-scale national Randomised Controlled Trial (In-Work Progression RCT)[footnote 4].
The RCT focused on 30,000 claimants entering the ‘Light Touch’ group between 2015 and 2018, and findings from its evaluation were published in 2018 and 2019. The evaluation found that the RCT produced small, but significant, impacts on earnings for the groups receiving the highest frequency intervention, indicating that active labour market policies can be effective for in-work UC claimants. This added to earlier evidence on progression support from the previous benefit system, such as the Employment Retention and Advancement trial.[footnote 5]
While the RCT provided substantial evaluative evidence on the impact of in-work support on participants, the size, composition and characteristics of the ‘Light Touch’ group are set to change substantially as more people move over to UC. For example, on the RCT many participants had just entered work after a period on JSA, but as the ‘Light Touch’ group grows many more will have been working prior to moving onto UC and in receipt of in-work benefits, particularly Working Tax Credits (WTC) and Child Tax Credits (CTC).
This study aims to bridge the evidence gap between what is already known about current in-work UC claimants, and what has been, until this point, little known about the ultimate composition of the ‘Light Touch’ group. This will support DWP to develop and test more targeted interventions based on the circumstances, needs and preferences of the future ‘Light Touch’ cohort.
To do this the research focuses on exploring the characteristics and circumstances of current tax credit and HB claimants who would fall into the ‘Light Touch’ group if they moved over to UC today (those whose earnings falling between the AET and CET). This group represents the vast majority of claimants who will make up the ‘Light Touch’ cohort once the move to UC is complete. For the rest of this report we will refer to this group of tax credit and HB claimants – the focus of this research – as the future cohort.
1.2. Research objectives
This research aimed to help DWP better understand the current Working Tax Credits, Child Tax Credits and Housing Benefit population who, based on current earnings, will comprise the vast majority of the ‘Light Touch’ claimant group when moved across to UC.
The specific objectives of the research were to:
- understand the likely composition and characteristics of the future cohort
- understand the range of barriers and enablers to progression and the support needs of the future cohort
- assess awareness of, and reaction to, in-work support and understand how this might influence behaviour
- inform the development of effective and targeted interventions to support progression
For the purposes of this study, progression is defined as increasing pay, working hours, or activities such as training which could help respondents progress in work in the future.
A key output from this research is a segmentation of the future cohort based on their attitudes, behaviours and capabilities to progress in work. To meet this requirement, many of the research questions were structured around the COM-B behaviour change model (Michie et al. 2011[footnote 6]). This model identifies 3 fundamental drivers of behaviour (B): capability (C), opportunity (O) and motivation (M):
- capability: an individuals’ psychological and physical ability to carry out a behaviour or activity, for example, their skills, qualifications and health (this is covered in section 3.1.2)
- opportunity: external factors which make a particular behaviour or activity possible, for example, progression opportunities with their current employer and in the wider labour market (this is covered in section 3.1.3)
- motivation: reflective and automatic thought processes which affect decision making, for example current job satisfaction and future aspirations and goals (this is covered in section 3.1.1)
1.3. Research design
This research comprised 2 strands, summarised below and set out in detail in Appendix A.
1.3.1. Quantitative research
Quantitative research comprised a survey of claimants who were in work and in receipt of one or more of: Housing Benefit, Child Tax Credits or Working Tax Credits and whose earnings were between the AET and CET. Tax credit claimants were selected from Her Majesty’s Revenue and Customs’ (HMRC’s) claimant database and Housing Benefit claimants from DWP’s claimant database[footnote 7]. The sample was selected to be representative of DWP’s forecast for the future cohort in December 2023 (in terms of household composition, earnings and benefit type).
Fieldwork began on the 24 April 2019 and ended on the 30 September 2019. Fieldwork was conducted by Computer Assisted Telephone Interviewing (CATI). The survey took approximately 30 minutes to complete. Interviews were conducted with 3,114 future cohort respondents.
1.3.2. Qualitative research
Qualitative research comprised depth individual interviews, paired interviews and focus group discussions with a sample of claimants who had taken part in the quantitative survey.
In depth interviews
The main focus of these interviews was to understand claimants’ household and financial circumstances, household attitudes towards progression and their support needs[footnote 8].
Eighty-three people took part in follow-up face-to-face depth interviews lasting one hour each comprising 37 individual depth interviews and 23 paired interviews. Paired interviews were held between the main participants and their partner or another close family member. All lead participants were in work at the time of the interview. Participants were purposively selected from the survey sample to ensure a broad spread of age, gender, ethnicity and educational qualifications as well as diversity of employment history such as length of time in role and contract type. Full details of the quotas achieved are included in Appendix A.
Fieldwork took place in a number of locations across England, Wales and Scotland between the 10 September 2019 and 15 October 2019.
Focus groups
The purpose of the focus groups was to understand claimants’ support needs and their reactions to different support options[footnote 9].
Eleven focus groups were held; 3 in London, 2 in Manchester, 2 in Leeds, 2 in Glasgow and 2 in Birmingham. Each focus group consisted of between 2 and 6 people (39 participants in total). As with the in-depth interviews, participants were screened to ensure they were in work and in receipt of tax credits and/or Housing Benefit. Quotas were also set to ensure a good representation by age and gender (see Appendix A for further details).
Fieldwork took place between the 15 October 2019 and 24 October 2019.
1.3.3. Interpreting the findings in this report
This research presents a snapshot of WTC, CTC and HB claimants, whose income falls between the AET and CET. This cohort would make up the vast majority of the ‘Light Touch’ group if moved over to UC today. However, the authors and DWP acknowledge that this will not be fully representative of future in-work claimants as a whole, as the research sample does not contain claimants who are currently in UC ‘Light Touch’, as well as claimants who are also working but earning above the CET or below the AET.
The survey data were weighted by gender, age and presence of children based on DWP’s forecast for the size and composition of the future cohort group in December 2023. A detailed breakdown of the weighting profile is included in Appendix A.
Only statistically significant findings from the survey have been reported in the commentary (although charts and tables may include non-statistically significant differences)[footnote 10]. All tables and charts report weighted data but include the unweighted base.
The survey results are subject to margins of error, which vary depending on the number of respondents answering each question and pattern of responses. Where figures do not add to 100%, this is due to rounding or because the question allows for more than one response.
Qualitative research is detailed and exploratory. It offers insights into people’s opinions, feelings and behaviours. All participant data presented should be treated as the opinions and views of the individuals interviewed. Quotations and case studies from the qualitative research have been included to provide rich, detailed accounts, as given by participants.
Qualitative research is not intended to provide quantifiable conclusions from a statistically representative sample. Furthermore, owing to the sample size and the purposive nature with which it was drawn, qualitative findings cannot be considered representative of the views of the future cohort population as a whole. Instead, this research was designed to explore the breadth of views and experiences, in order to develop a deeper understanding of attitudes towards progression and support preferences.
2. Composition and characteristics
This chapter covers the characteristics and circumstances of the future cohort to provide context for interpreting the findings in later chapters. It also introduces the segment groups that form part of the analysis. Findings in this chapter are from the quantitative survey only.
Chapter summary
" "
Demographics
- around three-quarters of the future cohort are female (77%)
- the average age is 45
- around a quarter (27%) say that they have a health condition or disability that limits their ability to carry out day to day activities
Household composition
- seven in 10 (70%) have dependent children and half (51%) are lone parent households
- female respondents are more likely to be lone parents (61%, compared with 16% of males)
- where the respondent lives with a partner, 58% of partners are out of work
Employment
- on average, respondents work 21 hours per week, with 15% working less than 16 hours per week and 11% working more than 30 hours per week
- 9% of respondents have more than one job
- whilst most respondents (77%) have a permanent work contract in their sole or main job, suggesting a high level of stability, a fifth are in more precarious work - 16% have a zero-hours contract and 4% have a temporary/fixed term or seasonal contract
- around 4 in 10 (41%) have been in their current job for over 5 years
- the average household earned income is £709 per month. Around 1 in 4 households (26%) earn less than £500 per month, while 16% earn more than £1,000
Education and English for Speakers of Other Languages (ESOL)
- around half of the future cohort have qualifications equivalent to level 2 or below (53%), whilst 1 in 6 have qualifications equivalent to degree level or above (17%). One in 7 (14%) have no formal qualifications
- one in 5 respondents (21%) say that English is their second language
2.1. Demographics and household composition
Around three-quarters of the future cohort are female (77%) and a quarter (23%) are male. The average age is 45. For female respondents the average age is 44, whilst for male respondents it is 46. Figure 2.1 provides a breakdown by age band.
Figure 2.1: Respondent age
| Age | Percentage |
|---|---|
| Under 35 | 17% |
| 35 to 44 | 30% |
| 45 to 60 | 46% |
| Over 60 | 6% |
Base: All future cohort participants (3,114)
Around a quarter of future cohort respondents (27%) say that they have a health condition or disability that substantially limits their ability to carry out normal day to day activities. Of these, 37% consider themselves to be disabled (equivalent to 10% of all respondents). Nearly three-quarters (72%) of those who consider themselves to be disabled receive Personal Independence Payments.
Men are more likely than women to say they have a limiting health condition or disability (36% compared with 24%), and this also increases with age (20% of under-35s rising to 40% of those aged over 60).
Four in 5 future cohort respondents describe themselves as having a white ethnic background (80%), while 18% say they are from an ethnic minority. Details are shown in Figure 2.2.
Figure 2.2: Ethnic background
| Ethnic background | Percentage |
|---|---|
| White | 80% |
| Mixed | 3% |
| Black | 7% |
| Asian | 6% |
| Other | 2% |
| Do not know or refused | 2% |
Base: All future cohort participants (3,114)
Around 1 in 5 respondents (21%) say that English is their second language. This applies to 12% of white respondents and 59% of respondents from an ethnic minority. Men are more likely than women to say that English is their second language (31% compared with 18%).
2.1.1. Household composition and caring responsibilities
Around half of the future cohort are lone parents with children aged under 16 (51%). A full breakdown of household composition is provided in Figure 2.3. Overall, 70% of respondents live with dependent children. Six in 10 female respondents are lone parents (61%), compared with only 16% of male respondents.
Figure 2.3: Household composition[footnote 11]
| Household composition | Percentage |
|---|---|
| Single adults with children | 51% |
| Couples with children | 20% |
| Single adults without children | 18% |
| Couples without children | 12% |
Base: All future cohort participants (3,114)
Among those with children, 50% have one child, 34% have 2, 12% 3 and 4% have 4 or more. Half have a youngest child below secondary school age. Details on the age of the youngest child are shown in Figure 2.4.
Figure 2.4: Age of youngest child[footnote 12]
| Age | Percentage |
|---|---|
| 3 to 11 | 50% |
| 12 to 15 | 23% |
| 16 or over | 27% |
Base: All future cohort participants who are living with dependent children (1,594)
Lone parents’ youngest child is on average older than the youngest child of couples with children (12 years old compared with 10 years old).
Among those with children, almost half (45%) look after their children themselves and do not use childcare. A similar proportion (42%) use informal childcare, most commonly family members. Just over a third (36%) use formal childcare[footnote 13], most commonly breakfast or after school clubs/activities (see Figure 2.5). Compared with the average, respondents with children aged 12 to 15 were more likely to not use any form of childcare (70%), whereas those with children aged 3 to 11 were more likely to use informal childcare, such as family members (38%) and breakfast or after-school clubs (32%).
Figure 2.5: Types of childcare
| Types of childcare | Percentage |
|---|---|
| Family member | 33% |
| Breakfast club or after school clubs/activities | 24% |
| Ex-husband/wife/partner | 14% |
| Friend or neighbour | 11% |
| Nursery, playgroup, or pre-school | 9% |
| Holiday club or scheme | 9% |
| Childminder/nanny/au pair in our home or somewhere else | 4% |
| Other | 2% |
| No, cared for by me (or me and my partner) | 45% |
Base: All future cohort participants with younger children aged under 6 (1,594)
30% of the future cohort do not have children. Four in 10 (41%) have a partner and 6 in 10 (59%) are single. This group are older than the future cohort on average and have a mean age of 47.5 compared with 43.3 for those with children.
In total, 15% of the future cohort have caring responsibilities for people other than their children; specifically, 6% care for a parent, 5% for their partner and 5% for other family members. Older respondents are more likely to have caring responsibilities (18% of those aged 45 or over, compared with 12% of those aged under 45). Men and women are equally likely to report caring responsibilities. Couples without children are particularly likely to have caring responsibilities (36%), most commonly for their partner (24%).
2.1.2. Partner’s work status
Where the respondent lives with a partner (32% of cases), 29% of partners are in paid employment and 13% are self-employed. More than half of partners (58%) are not in paid employment (see Figure 2.6).
Three-quarters of partners in work (76%) have a permanent or open-ended job or contract with a fixed or minimum number of hours per week, while 17% are on a zero-hours contract (see Figure 2.13).
Figure 2.6: Partner work status and contract type
Which of the following best describes your partners’ employment status at the moment?
| Partner work status | Percentage |
|---|---|
| Self employed | 13% |
| Working for an employer in paid employment | 29% |
| Not working in paid employment | 58% |
Base: All future cohort participants with a partner (1,035)
Which of the following best describes their contract?
| Contract type | Percentage |
|---|---|
| Permanent or open ended contract | 76% |
| Temporary/fixed term contract | 5% |
| Zero hours contract | 17% |
| Other | 3% |
Base: All future cohort participants with a partner in work (383)
Female respondents are more likely than male respondents to have a partner who is working (52% compared with 28%). The partner is also more likely to be in work where the couple have children (49%) than where they have no children (30%). The use of childcare also varies: where the partner is in work, around half (51%) use childcare, particularly informal childcare (38%). However, where the partner is not in work, only 38% use childcare and this is more likely to be formal (30%) than informal (23%).
The partner is less likely to be working among older respondents. 65% of those aged 45 or over have a non-working partner compared with 49% of those under 45. In addition, 7 in 10 (70%) of those who are in a couple without children have a non-working partner. Those with no qualifications (81%) are the most likely to have a non-working partner, compared with 50% of those with level 3 or higher qualifications. Respondents from an ethnic minority (67%) are also more likely to have a non-working partner than white respondents (55%).
2.1.3. Tenure and financial management
Just over a quarter of respondents (28%) own their home (with partial or full ownership) while the majority (69%) rent their home, either from a local authority (25%), private landlord (24%) or Housing Association (18%).
The majority of the future cohort have some difficulty keeping up with their bills and financial commitments (75%). This includes 10% who say they are falling behind with payments, 17% who are keeping up but find it a constant struggle, and 49% who keep up but struggle from time to time. Just under a quarter (23%) say they keep up without difficulty (see Figure 2.7).
Home owners are more likely than renters to say they keep up without difficulty (30% compared with 19%) and are less likely to say they are falling behind with payments (4% compared with 12%).
Figure 2.7: Ability to keep up with bills
| Thinking about the last 2 months, which of the following statements describes best how well you have been keeping up with your bills and commitments? | Percentage |
|---|---|
| Keeping up – no difficulty | 23% |
| Keeping up – struggle from time to time | 49% |
| Keeping up – constant struggle | 17% |
| Falling behind – some bills | 6% |
| Falling behind – many bills | 4% |
| No bills or commitments | 1% |
Base: All future cohort participants (3,114)
2.1.4. Internet use
The vast majority of respondents have access to the internet; 4% do not use or have access to the internet at all. Respondents are most likely to connect to the internet through a smartphone (80%), while more than half use a laptop or desktop computer, either at home (54%) or at work (29%). One in 6 (17%) only access the internet through a smartphone (see Figure 2.8), which may have implications for the types of activity they carry out online and the types of support that may be needed.
Older respondents are more likely to have no internet access at all (21% of those aged over 60), while younger respondents are more likely to access the internet only through a smartphone (24% of those aged under 35). Respondents without formal qualifications are particularly likely either to lack internet access at all (15%) or to go online solely through a smartphone (25%).
Figure 2.8: Ways of connecting to the internet
| Which, if any, of the following do you use to connect to the internet | Percentage |
|---|---|
| Smartphone | 80% |
| Laptop/desktop computer at home | 54% |
| Tablet | 35% |
| Laptop/desktop computer at work | 29% |
| Smart TV | 29% |
| Video game console | 19% |
| Do not use or have access to internet | 4% |
| Only smartphone | 17% |
Base: All future cohort participants (3,114)
2.2. Work, income and skills
Nine in 10 (90%) have one job and work on average 20.66 hours per week. Hours worked are slightly higher among men (22 per week) than women (20). There are indications of high levels of stability within the future cohort: most have a permanent contract and 4 in 10 have been in their current role for over 5 years. Work history further demonstrates these high levels of stability: a fifth have worked solidly since leaving school and among those who have had time out of the labour market, the most common reasons are maternity or paternity leave or to care for a child. However, there are a substantial minority who are in more insecure or unstable work, a fifth have a zero-hours or fixed term contract. Across all contract types, the future cohort are most likely to be working in low-skilled occupations, which may limit their scope for progression.
2.2.1. Current employment
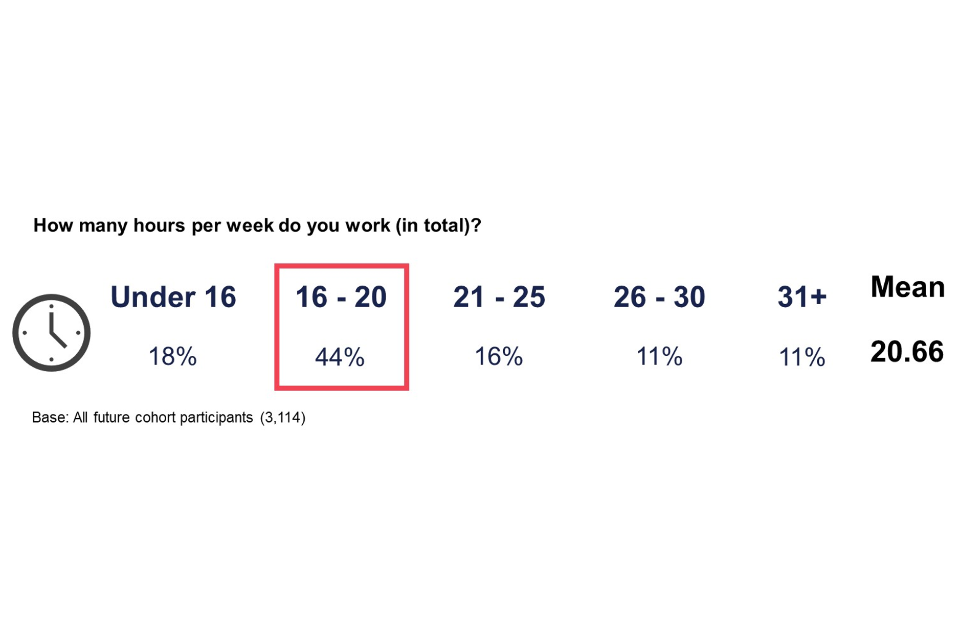
Nine in 10 (91%) of the future cohort have one job and on average, respondents work 21 hours per week in their main or sole job, with 15% working less than 16 hours per week and 44% working between 16 and 20 hours per week. One in nine (11%) work more than 30 hours per week (see Figure 2.9)[footnote 14].
Hours worked in their main job tend to be higher for men than women (22 compared with 20 hours per week on average). Those without children work slightly more hours than those with children (21.2 hours compared with 20.4). Among parents, hours increase with the age of the youngest child (average of 19 hours per week where the youngest child is aged 4 to 11, rising to 22 hours per week where the youngest child is 16 or over). There are no differences in the hours worked by those with a working or non-working partner.
Figure 2.9: Hours worked per week (in main job)
" "
9% of the future cohort have more than one job. Among those with more than one job they work an average of 12 hours per week in their second job. Combining both their main job and other roles, the average number of hours worked per week is 22.
The reasons why respondents have more than one job are: not being able to get enough hours in one job (53%), because jobs do not pay enough to have one job only (29%), needing or wanting the flexibility (27%) and liking the variety (20%). There is no difference in the proportion of men and women who have more than one job, but those aged 45 and over are more likely than under 45s to have more than one job.
Respondents are most likely to work in elementary occupations (27%), in caring, leisure or other service jobs (24%) or in sales or customer service roles (21%). The main industries are health and social work (23%), wholesale and retail trade (19%) and education (16%) (see Figure 2.10). Overall, respondents are mostly in low-skilled work, which may limit their scope for progression in the absence of further skills development. Indeed, the survey data suggests a link between occupation, hours worked and qualifications, with more highly qualified respondents tending to work more hours per week in more skilled occupations.
Figure 2.10: Occupation and Industry
| Occupation | Percentage |
|---|---|
| Elementary | 27% |
| Caring, leisure and other service | 24% |
| Sales and customer service | 21% |
| Adminstrative and secretarial | 10% |
| Skilled trade | 4% |
| Associate professional and technical | 3% |
| Process, plant and machine operatives | 3% |
| Industry | Percentage |
|---|---|
| Health and social work | 23% |
| Wholesale and retail trade | 19% |
| Education | 16% |
| Accommodation and food services | 10% |
| Administration and support | 9% |
| Manufacturing | 6% |
| Transportation and storage | 4% |
Base: All future cohort participants (3,114)
Most respondents (77%) have a permanent or open-ended job or a contract with a fixed or minimum number of hours per week, indicating that they are in stable employment. However, a substantial minority are in more unstable work. One in six (16%) have a zero-hours contract or a job with no specified minimum number of hours each week, and 4% have a temporary or fixed term or seasonal contract with a specified end date and regular or minimum number of hours (Figure 2.11).
Women are more likely than men to have a permanent contract (79% compared with 69%). Respondents from an ethnic minority (67%) and those who speak English as a second language (69%) are less likely to have a permanent contract.
Four in 10 respondents (41%) have been in their current role for over 5 years and a similar proportion (42%) have been in their job for between one and 5 years. One in 6 (17%) have been in their job for less than a year (Figure 2.10).
Figure 2.11: Contract type and length of time in current job
| Contract type | Percentage |
|---|---|
| Permanent contract | 77 |
| Zero hours | 16 |
| Temporary | 4 |
| Length of time | Percentage |
|---|---|
| Less than 6 months | 7 |
| 6 months to one year | 10 |
| 1 to 5 years | 42 |
| Over 5 years | 41 |
Base: All future cohort participants
2.2.2. Income
The average household income from employment earnings is £709 per month. Around 1 in 4 (26%) have a monthly earned income of less than £500 per month, while 16% have a monthly income of more than £1,000. The cumulative distribution of household income is illustrated in Figure 2.12.
Figure 2.12: Household income per month
| Household income per month | Percentage |
|---|---|
| Under £500 | 26% |
| £500 to £749 | 36% |
| £750 to £999 | 23% |
| Over £1,000 | 16% |
Base: All Light Touch participants (3,114)
Where respondents live with a partner who is also in work, the average household earned income is £1,098 per month, higher than where the partner is not in work (£611). Among couples with children, there is a positive relationship between average household earnings and age of the youngest child: £796 where youngest child is aged 16 and over; £790 where youngest child is aged 12 to 15 and £700 where the youngest child is aged 4 to 11. Earned income is higher among those with older children: £796 where youngest child is aged 16+ and £790 where youngest child is aged 12 to 15, compared with £700 where youngest child is aged 4 to 11.
Qualification levels also have an impact on average earned income. Those qualified to level 3 or above have an average earned income of £748 compared with £695 among those qualified to level 2 or below, and £628 for those with no qualifications. Those who have been in their current role for more than 5 years also have a higher than average earned monthly income (£737).
2.2.3. Work history
The majority of the future cohort have spent most of the time since they left full-time education in work. This includes 1 in 5 (20%) who have worked solidly without a break, and a further 59% who have worked solidly with one or two breaks. The remainder have either spent as much time working as not working (14%) or have spent most of the time not working (8%).
The most common reasons for breaks in employment are maternity or paternity leave (39%), while 23% have taken time off to care for a child or someone else, and 16% have taken time off for health reasons.
2.2.4. Education
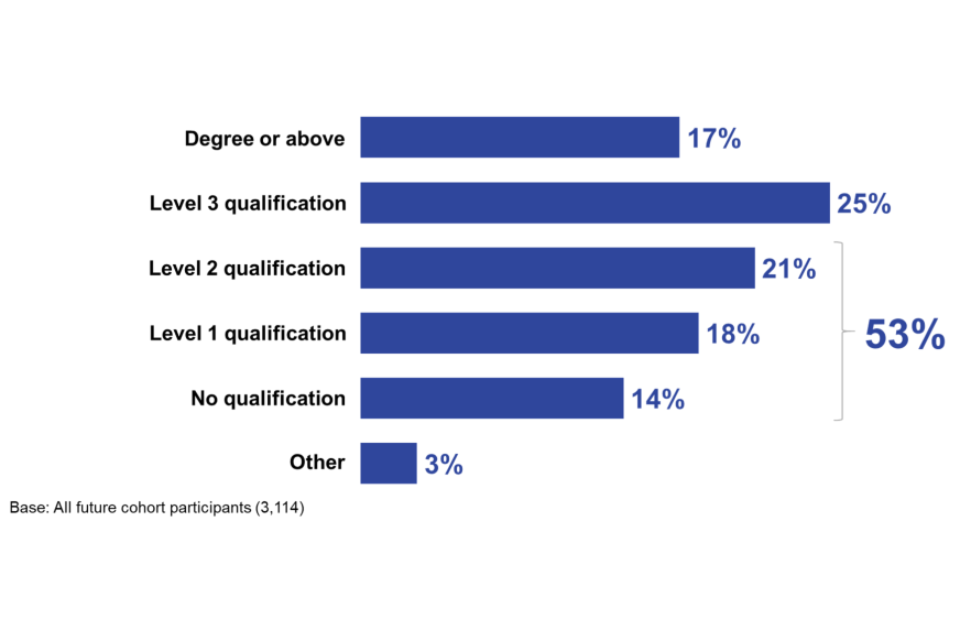
Just over half (53%) of the future cohort respondents have qualifications equivalent to level 2 or below (53%), including 14% that have no formal qualifications. One in 6 respondents are qualified to degree level or above (17%), as shown in Figure 2.13.
Men are more likely than women to have no qualifications (22% compared with 12%) and older respondents are also much more likely not to have any qualifications (19% of those aged 45 and over compared with 9% of under 45s). Respondents who have English as a second language are more likely to have a degree (24%) than those who have English as their first language (15%). This variation is likely to lead to different expectations and requirements for support and the types of job they may be interested in. Variation in expectations requirements for support is discussed further in the qualitative findings (chapter 3.2.5).
Figure 2.13: Highest qualification level[footnote 15]
" "
Qualification levels are related to current work status. Those with level 3 or higher qualifications work more hours on average per week (21.38) than those with level 2 qualifications or below (20.22). They are also more likely to work in more skilled occupations, such as human health and social work (28%) and education (22%) than those with level 2 and below qualifications who are more likely to work in wholesale and retail (22%) or those with no qualifications who are most likely to work in administrative and support roles (16%).
Respondents who report themselves as having a disability are most likely to have level 3 qualifications or higher (42%), a third (35%) have level 2 qualifications or lower and a quarter (25%) have no qualifications.
2.3. Segmentation
A key objective of the research was to differentiate the future cohort according to their capability, motivation, beliefs about opportunity in the labour market, together with their support preferences in relation to in-work progression[footnote 16]. A segmentation analysis was conducted using a statistical technique known as Latent Class Analysis (see Appendix A). The segmentation identified 5 groups of respondents, each sharing similar attitudes, behaviours and capability with respondents within their segment but being distinctly different to respondents outside their segment.
At this stage, it is important to re-iterate that the segments were modelled to differ on a range of circumstances, attitudes and behaviours. The segments are intended only to show broad characteristics, and as a result no claimant will ever conform perfectly to the segmentation typology, but they will still be closer in their characteristics to one of these groups rather than the others. Fuller technical details of the segmentation approach used can be found in Appendix A including details of the questions used for the analysis.
Figure 2.14 shows the proportions of each segment group, as well as a brief summary.
Figure 2.14: Summary of segment groups
" "
The remainder of this chapter provides a short summary of the characteristics of each segment, before providing a detailed exploration of their demographics, and household and employment arrangements. To compare segment statistics with the future cohort as a whole please refer to the chart the Chapter Summary. Subsequent chapters describe the attitudes, motivations and support needs which define each segment.
2.3.1. ‘Keen to progress’ segment
The ‘Keen to progress’ segment (Figure 2.15) make up 17% of the total sample of the future cohort. This group demonstrated the highest motivation to progress. They strongly believe in the importance of being self-sufficient and are confident in seeking progression opportunities.
Figure 2.15: ‘Keen to progress’ segment: key characteristics
" "
This is the most gender balanced segment (49% are male and 51% female). Unlike the other segments, the majority (68%) live with a partner, either with children (45%) or without children (23%). The age profile is similar to the total sample of the future cohort.
Compared with other segments, ‘Keen to progress’ respondents have higher qualification levels, with almost half (46%) qualified to level 3 or above. Respondents in this segment are the most likely to speak English as a second language (36%) and to be from an ethnic minority (37%).
Respondents in this group work the highest number of hours per week on average (21.6 hours). They are the most likely to have a temporary or zero-hours contract (28%) and to have started their job in the last year (24%). A high proportion in this group rent their home (75%) and are the most likely of all segments to say they struggle financially (81%).
2.3.2. ‘Motivated but cautious’ segment
The ‘Motivated but cautious’ group is the largest of the segments (Figure 2.16), making up a third (33%) of the total sample of the future cohort. This group consists of lone parents who want to increase their earnings and come off benefits but are concerned that changes to their work patterns could negatively impact their finances and stability. This group feel they need to develop their skills and qualifications before they are able to progress.
Figure 2.16: ‘Motivated but cautious’ segment: key characteristics
" "
All respondents in this segment are lone parents and the vast majority are female (93%). They have a young age profile (56% are aged under 45).
Employment details are similar to the future cohort overall: they work 21 hours per week on average and around 4 in 5 (79%) have a permanent contract.
Compared with the average, ‘Motivated but cautious’ respondents are more likely to speak English as a second language (25%) and are less likely to have a limiting health condition or disability (18%). A high proportion in this group rent their home (73%) and they are more likely than the future cohort as a whole to say they struggle financially (79%).
2.3.3. ‘Care focused’ segment
The ‘Care focused’ (Figure 2.17) group makes up 22% of the total sample of the future cohort. This group value stability and prioritise their caring responsibilities above progressing in work.
Figure 2.17: ‘Care focused’ segment: key characteristics
" "
They are predominantly female (86%), and more than three-quarters have dependent children (54% are lone parents, and 24% live with a partner and children). A quarter (25%) have caring responsibilities other than for children, the highest of any segment.
They work the lowest number of hours of any segment (average of 18.8). Compared with other segments, ‘Care focused’ respondents are most likely to own their home (37%).
2.3.4. ‘Stable but stuck’ segment
The ‘Stable but stuck’ segment (Figure 2.18) is the smallest, making up 12% of the total sample of the future cohort. This segment is older than average and they feel less satisfied with their job but are uncertain about what they could do to progress in work.
Figure 2.18: ‘Stable but stuck’ segment: key characteristics
" "
More than a third are male (37%), and they are older than average: 72% are aged 45 or over, including 20% aged over 60. This segment is the least likely to have dependent children (37%), and almost half are single adults without children (46%). Among those who have a partner, nearly 7 in 10 (68%) are not working, higher than the other segments.
Among those with children, use of childcare is much lower than other segments (61% do not use childcare); this is likely to reflect the age of their children (84% have a youngest child aged 12 or over).
Over half (53%) of ‘Stable but stuck’ respondents have been in their job for more than 5 years.
Compared with other segments, ‘Stable but stuck’ respondents are the most likely to have a limiting health condition or disability (40%). Their qualification levels also tend to be lower than other segments (21% have no formal qualifications).
2.3.5. ‘Stable and content’ segment
The ‘Stable and content’ segment (Figure 2.19) makes up 16% of the total sample of the future cohort. This group are the least likely to want to progress in work and are particularly likely to be reluctant to take on more hours.
Figure 2.19: ‘Stable and content’ segment: key characteristics
The majority (71%) are female, and they are older compared with the average: 13% are aged over 60 and over a third (37%) are aged under 45. Almost half (47%) live with a partner, higher than most other segments, and half (50%) have dependent children.
Qualification levels tend to be lower than other segments (22% have no formal qualifications), but they are less likely than other segments to struggle financially (60%). ‘Stable and content’ respondents are the most likely to have a permanent contract in their job (81%).
3. Attitudes towards progression
This chapter focuses on the attitudes of the future cohort towards progression in work, examining their barriers, motivation, capability and opportunities for progression. For the purposes of this study progression was defined as increasing hours or pay, or activity which could help respondents to improve their ability to progress in work in the future, such as training. Findings from the quantitative survey are presented first – at the overall level and for the different segments, followed by findings from the qualitative research.
Chapter summary
Attitudes towards current job
- respondents had high levels of satisfaction with their current job, though more so with the lifestyle elements such as work-life balance and hours than pay and opportunities for career development
Barriers to progression
- when asked if there is anything that makes it difficult for them to progress in their current job, the barriers mentioned by the future cohort are diverse, with 65% reporting at least one barrier, but no single barrier being mentioned by more than 15% of respondents. This illustrates the diverse needs among this group. The most commonly mentioned barriers are a lack of opportunities to gain promotion (15%), caring responsibilities (14%), their health (10%)
- as far as new jobs are concerned, barriers the future cohort mention are caring responsibilities (17%), their health (11%), lack of skills or qualifications (11%) and their age (8%)
- combining the 2 questions, around a third (35%) mention one barrier to progression in a new or existing job, 29% mention 2 barriers, and 17% mention 3 or more barriers
Motivation
- seven in 10 (72%) say it is important for them to increase their pay over the next 12 months and three-quarters (74%) agree that becoming self-sufficient and not receiving benefits or tax credits to top up their earnings is important, suggesting that there is widespread motivation to increase earnings
- however, respondents are less likely to say it is important for them to increase their hours (42%) or get a new job (37%). This is possibly because nearly 7 in 10 respondents (68%) agree that if they worked more hours, their home life would suffer, and 58% agree that it would be difficult for them to increase the hours they work, even if they were offered more hours. This illustrates that for this cohort any progression is likely to need to fit with their wider family commitments
- there is also a strong drive for stability, which could act as a counterbalance to motivation to progress. Over 8 in 10 (83%) agree that their biggest priority is keeping their current job rather than looking to get further at work
Capability
- self-perceived capability to progress suggests high confidence levels in ability to explore the labour market, but less confidence in skills. Around 7 in 10 (72%) say they have taken some kind of action related to progression in the past 12 months, most commonly taking a training course (34%) or speaking to their manager about progression opportunities (32%)
- respondents express fairly high levels of knowledge about their capability to progress in work; for example, 74% agree they know where to look for opportunities to progress in their work or career, and 63% agree that they feel confident about applying for a new job
- however, another 47% agree that they need to improve their skills and qualifications before they can get further at work (compared with 37% who disagree)
Opportunity
- there is broad agreement that there are limited job opportunities available that offer progression. Three in five (61%) agree that ‘jobs on offer do not pay enough to make working more hours financially worthwhile’, while more than half (54%) agree that ‘there just aren’t enough full-time vacancies for everyone at the moment’
3.1. Quantitative findings
3.1.1. Attitudes towards current job
The main reasons why respondents say they are in their current job are because they enjoy the work (37%), it fits around their childcare responsibilities (20%), they have the right skills or experience (14%), it offers a good work/life balance (12%), gives good pay (13%) or because it was the only job they could get (10%).
Figure 3.1 shows the answers given by at least 5% of respondents.
Figure 3.1: Reasons for being in current job
| Reasons for being in current job | Percentage |
|---|---|
| Enjoy the work/working with that team | 37% |
| Fits with my childcare responsibilities | 20% |
| Right skills/experience | 14% |
| Pay is good/the hours offer the money I need to support myself financially | 13% |
| Good work/life balance | 12% |
| Only job I could find | 10% |
| Accessible/close to home | 8% |
| Flexible working | 7% |
| Been there a long time | 5% |
| Health-related reasons | 5% |
Base: All future cohort participants (3,114)
These reasons for doing a particular job illustrate that motivation (enjoyment), capability (fits with childcare, having the right skills) and opportunity (the only job I could find, accessibility) are all important in determining job choices. For progression opportunities to appeal, they will also have to suit the future cohorts across these 3 domains.
Women are more likely to say they do their job because they enjoy it than men (38% compared with 31%). Men are more likely to report that they do the job they do due to their skills and experience (18%), compared with women (13%). Respondents on temporary and zero-hours contracts are also more likely to state this (21% and 18% respectively, compared with the average, 14%).
Although for all groups enjoyment is the most common reason why they do their job, lone parents are more likely that to say they do their job because it fits in with childcare responsibilities (30% compared with 20% overall).
Respondents were asked to what extent they were satisfied with various aspects of their job (or specifically their main job if they have more than one) (see Figure 3.2). Eight in ten future cohort respondents (81%) are satisfied with their job overall, and this includes 48% who are very satisfied. The ‘Stable and content’ segment (97%) and ‘Care focused’ (85%) are more likely than average to say they are satisfied with their job overall. One in ten (10%) are dissatisfied, higher among respondents from ethnic minorities (15%). These high levels of satisfaction indicate that the future cohort may be reluctant to seek changes to their job role.
Figure 3.2: Satisfaction with current job
| Aspect of job | Somewhat satisfied | Very satisfied | Total |
|---|---|---|---|
| Job overall | 33% | 48% | 81% |
| Number of hours worked per week | 33% | 46% | 79% |
| The commute to and from work | 23% | 63% | 86% |
| Training opportunities available | 27% | 39% | 66% |
| Opportunities for career development | 28% | 29% | 57% |
| Work life balance | 34% | 46% | 80% |
| Pay, including benefits/tax credits | 40% | 24% | 64% |
| Childcare arrangements when at work | 19% | 51% | 70% |
Base: All future cohort participants (3,114)
When looking at specific aspects of work, satisfaction tends to be higher with lifestyle measures (such as hours, work-life balance and travel to work) than with progression and pay. Specifically:
- 8 in 10 (80%) are satisfied with their work-life balance. Whilst there are few differences among sub-groups on these satisfaction measures, those who have been in their job for more than 5 years are most satisfied with their work-life balance (83%). Those with children (82%) are also more satisfied with their work-life balance than those without (78%)
- a similar proportion (79%) are satisfied with the number of hours they work. Again, there are few differences, but those with no qualifications are more likely to be satisfied with the hours they work (84%). Those working under 16 hours a week (22% compared with 13% overall) and men are more likely to be dissatisfied (18% compared with 12% of women)
- over 8 in 10 (86%) are satisfied with their commute to and from work
- among those who have children, 7 in 10 (70%) are satisfied with their childcare arrangements whilst at work. Those with a non-working partner were most likely to be satisfied with this (78%)
- over 6 in 10 (64%) are satisfied with their pay (including their benefits or tax credits), with 24% dissatisfied. Those with qualifications below level 2 and those who had been in their job for less than 6 months were more likely to say they were satisfied with their pay (69% and 71% respectively). Those with level 3 or higher qualifications are more likely to be dissatisfied with their pay (29%) as are those with a non-working partner (24% compared with 17% of those with a working partner) and lone parents (26%)
- two-thirds (66%) are satisfied with the training opportunities available to them; just over half (56%) are satisfied with their opportunities for career development, with 24% dissatisfied. Those under the age of 35 or with no qualifications were more likely than average to be satisfied with their opportunities for career development (both 62%)
3.1.2. Barriers to progression
Number of barriers
Around half of respondents (49%) mention one barrier to progressing in their current job, while 11% give 2 barriers and 5% mention 3 or more. A third (34%) of respondents say they have no barriers to progression in their current job. In terms of getting a new job with better progression opportunities, 28% have no barriers, 53% have one barrier, 13% have 2 and 4% have 3 or more barriers.
Combining the 2 questions, 19% state they have no barriers, around a third (35%) mention one barrier to progression in a new or existing job, 29% mention 2 barriers and 17% mention 3 or more barriers. Figure 3.4 shows the number of barriers respondents report to progressing in either their current job and new job.
Overall, respondents with qualifications at Level 3 and above are more likely say they have 2 or more barriers (51%), when compared to those qualified to level 2 or below (45%) and those with no qualifications (34%). Those with a youngest child aged 12-15 are more like to report more than 3 barriers to progressing in a current or future job (23%, compared with 19% of those with children overall).
Types of barriers
Among the future cohort, perceptions of barriers to progression were highly diverse (figure 3.3). When asked if there is anything that makes it difficult for them to progress in their current job, the future cohort mention lack of opportunities to gain promotion (15%), caring responsibilities (14%), their health (10%), lack of opportunities for training and development (9%), lack of opportunities to increase pay or hours (8%) and not wanting to progress (8%). This reflects the diversity of this cohort in terms of education, skills, age and household composition and suggests that interventions will benefit from being tailored to these diverse needs.
Grouping the barriers helps clearer patterns of support needs to emerge. Overall, 37% mention ‘personal’ barriers (such as health or lack of skills), while 31% refer to ‘external’ barriers (lack of jobs or opportunities) and 7% mention ‘financial barriers’ such as not being able to afford training; not being able to afford to move to an area with more opportunities; having to pay more for childcare; debt or concern about losing benefits.
The main reasons respondents give as to why it is difficult for them to get a new job with better progression opportunities are again highly diverse, with no one barrier accounting for the majority. The most common barriers cited by respondents were their caring responsibilities (17%), their health (11%), lack of skills or qualifications (11%) and their age (8%). Nearly 3 in 10 (28%) say they have no barriers to getting a new job. As far as new jobs are concerned, ‘personal’ barriers feature prominently (56%), to a greater extent than ‘external’ or ‘financial’ barriers (15% and 8% respectively). Women are more likely to report financial barriers to getting a new job (13%) whereas men cite external barriers (18%).
Figure 3.3: Barriers to progression
| Barriers to progressing in current job | Percentage |
|---|---|
| Lack of opportunities for promotion | 15% |
| Caring responsibilities | 14% |
| Health | 10% |
| Lack of training/development opportunities | 9% |
| Lack of opportunities to increase pay/hours | 8% |
| Do not want to progress | 8% |
| Childcare costs | 4% |
| Lack of skills | 4% |
| None | 34% |
| Barriers to progressing in new job | Percentage |
|---|---|
| Caring responsibilities | 17% |
| Health | 11% |
| Lack of skills | 11% |
| Do not want to progress | 9% |
| Age | 8% |
| Travel costs | 5% |
| Childcare costs | 4% |
| Insufficient full-time jobs | 4% |
| None | 28% |
Base: All future cohort participants (3,114)
Combining the answers to both questions (barriers to progression in current job, and barriers to getting a new job with better progression opportunities), a quarter of respondents (24%) mention caring responsibilities as a barrier to progression, while 16% mention lack of promotion opportunities, 14% their health, 13% their lack of skills or qualifications and 11% the lack of opportunities for training or development.
One in 5 (19%) respondents say they have no barriers to either progressing in their current or a new job. Men (22%), those aged 45 or over (20%), those without children (21%) and without qualifications (25%) are most likely to say they have no barriers either to progressing in their current or a new job.
Barriers to progression: segments
The key finding relating to barriers is that respondents report a varied range of them; there is no one barrier which emerges as being experienced by the majority. This is also true within the segments, further illustrating the diversity of support needs among the future cohort. However, there is also some variability around barriers between as well as within the segments, these are as follows:
- ‘keen to progress’ respondents are more likely to cite a ‘lack of skills/qualifications’ (19%, compared with the average, 13%) and a ‘lack of opportunities for training or development’ (14% compared with the average, 11%) as barriers.
- ‘motivated but cautious’ are more likely than average to say there are a ‘lack of opportunities to gain a promotion’ at their employer (20% compared with 15% overall). This segment is more likely than average to work in ‘Caring and Personal Service’ occupations (29% compared with the average, 21%), and this may reflect that the more limited opportunities for progression in this sector
- ‘care focused’ are more likely to cite ‘caring responsibilities’ (29%) and childcare costs (7%) as being barriers. This reflects the priorities of this group, who are more likely to say they would find it difficult to work more hours or that this would negatively affect their home life
- ‘stable but stuck’ respondents are more likely than other respondents to mention their health (21%) as a barrier.
- ‘stable and content’ are the most likely to mention no barriers (in either their current job or a new job, 36%). This reflects the high job satisfaction among this segment and low motivation to progress. They may not see barriers to progression because they have little interest in doing so
3.1.3. Motivation to progress in work
This section examines respondents’ motivation to progress in work, firstly for the future cohort sample overall followed by analysis for each of the 5 segments.
Respondents are generally very satisfied with their current job(s), particularly with the number of hours they work and their work-life balance. Subsequently, whilst many would like to increase their pay, fewer want to increase the number of hours they work or change job. Few benefits are attached to working more hours or full-time whilst increasing the hours worked is seen as having a negative effect on home life and being difficult to accommodate.
Respondents who have been in their job for longer are more likely to have high satisfaction, as well as being less likely to think that increasing their hours or pay is important. Conversely, those who have moved jobs most recently appear to be more interested in progression opportunities. Household composition also influences motivation: those with younger children prioritise family life and those with older children are more open to increasing the number of hours they work.
Attitudes towards progression
Respondents were asked whether they agreed or disagreed with a number of statements about work (see Figure 3.4). Over 8 in 10 (83%) agree that their biggest priority is keeping their current job rather than looking to get further at work. This focus suggests there will be lower motivation to seek or take-up new opportunities among this group.
In terms of pay, 7 in 10 of the future cohort (72%) say it is important for them to increase their pay over the next 12 months. A similar proportion (74%) agree that “becoming self-sufficient and not receiving benefits or tax credits to top up their earnings” is important. A smaller proportion, 4 in 10 (40%) agree that “I don’t need to work more hours or earn more money because I get by okay on what I currently earn”, and respondents are more likely to disagree with this statement than agree with it (48%). This confirms that an increase in pay would be important for the future cohort. At the same time, 7 in 10 (70%) agree that “earning more would impact my benefits or tax credits”.
However, less importance is placed on increasing the number of hours worked. Four in ten (42%) say it is important to increase their hours in their current job. Respondents are as likely to disagree (43%) as agree (40%) that they would be happier and more fulfilled if they were working more hours, and they are more likely to disagree than agree that people who work full-time earn more respect (49% compared with 38%). More specifically, over two-thirds of respondents (68%) agree that if they worked more hours, their home life would suffer, and 58% agree that it would be difficult for them to increase the hours they work, even if they were offered more hours.
Getting a new job has least importance for this group. A quarter say this is very important for them to achieve this in the next 12 months and 37% that it is very or somewhat important. This suggests that progression in their current job will be most attractive to this audience.
Figure 3.4: Importance of changes to current work
| Change | Fairly important | Very important | Total |
|---|---|---|---|
| Increase hours in current job | 18% | 24% | 42% |
| Increase pay in current job | 26% | 46% | 72% |
| Get a new job | 13% | 24% | 37% |
Base: All future cohort participants (3,114)
Actions taken to progress
When asked what actions they had taken in relation to progression in the past 12 months, around 7 in 10 (72%) say they have taken some kind of action, most commonly starting or completing a training course (34%) or speaking to their manager about progression opportunities (32%). Full details are shown in Figure 3.5.
Figure 3.5: Actions taken in relation to progression
| Action taken | Percentage |
|---|---|
| Started or completed a training course(s) to improve your qualifications skills | 34% |
| Talked about progression opportunities with your manager | 32% |
| Requested additional hours in your current job | 23% |
| Applied for a new job to replace your current job | 22% |
| Tried to get a pay rise in your current job | 20% |
| Applied for a promotion in your current job | 7% |
| None of these | 29% |
Base: All future cohort participants (3,114)
Motivation: sub-group variations
This section considers the findings by age, household composition, age of youngest child, job tenure and education level. Overall the findings show that younger people demonstrate more interest in progression generally and those who have been in their job longer appear to have less motivation to progress. Household composition influences motivation to increase hours. Those with younger children are more likely to find changing their hours challenging and do their job because it fits with their childcare responsibilities. Those with older children are more interested in increasing their hours. In terms of motivation to increase pay, parents are particularly motivated to do so but face practical constraints that limit their ability to do so.
There is no difference in job satisfaction between those aged over and under 45. However, respondents under 45 are more likely than those aged 45 and over to say that increasing their hours (45% compared with 40%) and getting a new job (and 40% compared with 35%) are important. In contrast, those aged 45 and over are more likely to agree that keeping their current job is their biggest priority (85%, compared with 80%) demonstrating that stability is more important to older respondents.
Respondents under the age of 45 also demonstrate higher motivation to progress. They are more likely to agree that they would be happier and more fulfilled if they worked more hours (44% compared with 37%) and that they had made a commitment to themselves to attend training by a certain date (52% compared with 42%). However, under 45s are also more likely than those aged 45 and over to agree that if they worked more hours their home life would suffer (71% compared with 65%), it would be difficult for them to increase their hours, even if they were offered more hours (63% compared with 54%) and that earning more would impact their benefits (72% compared with 68%). Despite this, those under 45 are more likely to have taken action to progress (77% compared with 67% of those aged 45 or over). This shows that under 45s demonstrate somewhat more motivation to progress but feel constrained by their circumstances.
Motivation to progress among parents, particularly lone parents, reflects the challenges this group are likely to have in balancing work and childcare. Whilst parents, and particularly lone parents, express higher satisfaction with the lifestyle elements of their current job they also demonstrate slightly higher motivation to progress than those without children. Parents are more satisfied with their work-life balance than those without children at home (82% compared with 77%). Lone parents are more satisfied than those in couples with the hours they work (81% compared with 75%). As may be expected, couples are more satisfied with their childcare arrangements than lone parents (76% compared with 68%) and this is slightly more common for those with a non-working partner (78% compared with 74% with working partners). Although they are more satisfied on these measures, those with children are more likely than those without to say that it is important for them to increase their hours (44% compared with 38%), and to a lesser extent, their pay (73% compared with 69%) and get a new job (39% compared with 34%). There are no differences in the proportions of lone parents or parents in couples who say it is important for them to increase their hours or get a new job.
Parents are also more likely to say that they have taken action to progress in work in the past year (74% compared with 66%) and lone parents are most likely to have taken action (76% compared with 70% of couples). However, lone parents are also more likely to agree that working more hours would be difficult (61% compared with 54% of parents in couples – there are no differences between parents and those without children) and that they are worried that working more would affect their benefits (74% compared with 63% of couples). In contrast, those without children at home are more likely than parents to say that their priority is keeping their current job (85% compared with 82% of parents) and that they don’t need to work more because they get by on their current income (43% compared with 38% of parents).
Among parents, those with younger children may feel that their ability to progress now is constrained by their childcare responsibilities, however they appear interested in building skills that could support progression in the future. Those with a youngest child aged 16 or over are most likely to be doing their job because they have the right skills or experience (19%), while those with a youngest child aged 4 to 11 are most likely to say that the job fits around their childcare responsibilities (34%). Fitting with this, those with younger children are most likely to agree that it would be difficult for them to increase their hours (67% agree) and that their home life would suffer if they worked more hours (77% agree). However, those with a youngest child aged 4 to 11 are also most likely to have started or completed a training course to improve their qualifications or skills in the past 12 months (40%) potentially setting up their ability to progress when their children are older. The change in priorities as children become more independent is demonstrated by respondents whose youngest child is aged 16 or above. They are most likely to say it is important for them to increase their pay (79%) or increase their hours (52%). They are also the most likely to agree that becoming self-sufficient is important (78%).
Respondents who have been in their job longer than 5 years demonstrate less motivation to progress. They are the most likely to say they are satisfied with their work-life balance (83%) and that they do their job because they enjoy the work (40%). This group are least likely to have taken action in relation to progression in the past 12 months (65% compared with 72% overall). Respondents who have been in their job for longer than 5 years are also less likely to say that it is important for them to increase their hours (38%).
In contrast, those who have moved jobs more recently demonstrate greater motivation to progress. Those who have been in the job for between 6 months and a year are most likely to have taken action to progress (84%), specifically by talking about progression with their manager (43%). Respondents who started their job in the last 6 months are most likely to say they are doing the job because the pay is good (19%) and to agree that they have made a commitment to attend training (61% of those in the job for up to a year).
Those with higher levels of education are less satisfied with their current job, more interested in getting a new job and more likely to have taken action to progress. Respondents with no formal qualifications are generally more satisfied with their job: 84% are satisfied overall, compared with 79% of those who are qualified to level 3 or above. The same pattern applies to many specific aspects of the job, such as hours worked, pay, training opportunities and opportunities for career development. Reflecting these findings, respondents qualified to level 3 or above are most likely to say it is important for them to get a new job (43%) and are least likely to say that their priority is to keep their current job (78% agree, compared with 89% of those with no qualifications). This group are also most likely to have made a commitment to attend training (51% agree). The more highly qualified respondents are, the more likely they are to have taken action in relation to progression in the past 12 months (80% among those qualified to level 3, falling to 57% among those with no qualifications).
Motivation to progress in work by segments
This section examines the motivations of respondents in the 5 segment groups. The ‘Keen to progress’ group were the most motivated to progress. They would like to make changes to their current job and are most likely to have taken action to progress in the past 12 months. ‘Motivated but cautious’ respondents were the next most motivated. Half agree it is important for them to increase their earnings in the next 12 months and they are the second most likely to have taken action to progress. ‘Care focused’ saw progression (particularly in terms of hours) as less important. They are the most likely to do their job because it fits around their childcare and caring responsibilities and are reluctant to make changes. The ‘Stable but stuck’ group were least satisfied with their job but were also broadly pessimistic about work and training opportunities. They were least likely to have taken action to progress in the past 12 months. The ‘Stable and content’ group were most satisfied with their current job and demonstrated that progression was not a priority for them. They are most likely to say they don’t need to work more hours or earn more as they get by on what they earn. Full details are shown in Figure 3.6.
Figure 3.6: Importance of different forms of progression, and keeping current job, in next 12 months by segment (percentage of participants describing these as important)
| Form of progression | Get a new job | Increase hours | Increase pay | Prioritiy is keeping current job | |
|---|---|---|---|---|---|
| Total sample | 37 | 42 | 72 | 83 | |
| Keen to progress | 64 | 69 | 88 | 74 | |
| Motivated but cautious | 49 | 54 | 83 | 78 | |
| Care focused | 22 | 27 | 60 | 88 | |
| Stable but stuck | 33 | 30 | 69 | 83 | |
| Stable and content | 10 | 22 | 53 | 92 |
Base: All future cohort participants (3,114); Keen to progress (577); Motivated but cautious (744); Care focused (675); Stable but stuck (501); Stable and content (617)
Keen to progress
Respondents in the ‘Keen to progress’ segment are more likely than other respondents to say that they are in their current job because it is the only one they can find. Otherwise, their reasons for doing their job are similar to other segments.
Satisfaction with work is relatively low in this segment. Three-quarters are satisfied with their job overall (74% compared with 81% of the future cohort overall), and they are less satisfied than other respondents on most aspects of their work, such as the number of hours worked (62% satisfied compared with 79% overall) and work-life balance (70% satisfied compared with 80% overall).
The ‘Keen to progress’ segment is the most keen to make changes to their current job, with almost 9 in 10 saying it is important for them to increase their pay (88% compared with 72% overall) and 7 in 10 saying it is important to increase their hours (69% compared with 42% overall) or get a new job (64% compared with 37% overall). Respondents in this segment are the least likely to agree that their priority is keeping their current job (74% agree compared with 83% overall). As 8 in 10 (81%) are struggling with their bills, financial imperative could be underpinning this motivation. This segment are also younger (52% are under 45) and more highly educated (46% have level 3 qualifications or higher), both characteristics that correlate with motivation to progress.
This segment is the most likely to see the benefit of increased working hours: 65% agree that “I would be happier and more fulfilled if I was working more hours” (compared with 40% overall) and 51% agree that “people who work full-time gain more respect” (compared with 38% overall). They are less concerned about the impact on home life of working more hours (51% agree that home life would suffer, compared with 68% overall) and are least likely to agree that they don’t need to increase hours or pay because they “get by okay on what they earn” (21% compared with 40% overall).
‘Keen to progress’ respondents are the most likely to have taken action in relation to progression in the past 12 months, such as talking about progression opportunities with their manager (44%) or requesting additional hours in their current job (40%). A quarter (24%) have been in their current job for less than a year, suggesting that action has paid off for these respondents.
Figure 3.7: Satisfaction with job: ‘Keen to progress’ segment
| Satisfaction with job | Keen to progress (percentage very satisfied) | All respondents (percentage very satisfied) |
|---|---|---|
| Job overall | 34% | 48% |
| Number of hours worked per week | 25% | 46% |
| The commute to and from work | 51% | 63% |
| Training opportunities available | 33% | 39% |
| Opportunities for career development | 20% | 29% |
| Work life balance | 30% | 46% |
| Pay, including benefits/tax credits | 14% | 24% |
| Childcare arrangements when at work | 46% | 51% |
Base: All Keen to progress (577), All future cohort participants (3,114)
Motivated but cautious
Among the ‘Motivated but cautious’ group, solely made up of single parents, satisfaction with work is slightly lower than the future cohort overall. Over three-quarters are satisfied with their job overall (78%), and they are less satisfied than other respondents on specific aspects of their work, notably pay (57% satisfied compared with 64% overall) (see Figure 3.8).
‘Motivated but cautious’ respondents are relatively motivated to make changes to their current job, with more than half saying it is important for them to increase their pay (83% compared with 72% overall) and half saying it is important to increase their hours (54% compared with 42% overall) or get a new job (49% compared with 37% overall). Almost 8 in 10 in this segment (78%) say that their priority is keeping their current job (lower than the overall figure of 83%). Nearly 8 in 10 (79%) are struggling with their bills, which as with the ‘Keen to progress’ segment may underpin their motivation to earn more. However, this group are also more likely than average to be concerned about the impact that earning more will have on their benefits (75%, compared with the average, 70%).
Respondents in this segment show relatively high motivation to progress in work with 8 in 10 (80%) agreeing that becoming self-sufficient is important (compared with 74% overall). More than a half (53%) agree that they have made a commitment to attend training (compared with 46% overall). Around 3 in 10 (31%) agree that they don’t need to increase hours or pay because they “get by okay on what they earn” (compared with 40% overall). As with the ‘Keen to progress’ segment, this group are younger (56% under 45) and 44% have qualifications equivalent to level 3 or higher, both of which have a positive relationship with motivation to progress.
The ‘Motivated but cautious’ group are more likely than other respondents to have taken action in relation to progression in the past 12 months, such as taking a training course to improve their qualifications (42%) or talking about progression opportunities with their manager (40%). However, this group are concentrated in low-skill jobs (29% work in caring and personal service occupations, compared to 21% overall), suggesting there may be limited scope for them to progress in their current role.
Figure 3.8: Satisfaction with job: ‘Motivated but cautious’ segment
| Satisfaction with job | Motivated but cautious (percentage very satisfied) | All respondents (percentage very satisfied) |
|---|---|---|
| Job overall | 41% | 48% |
| Number of hours worked per week | 37% | 46% |
| The commute to and from work | 60% | 63% |
| Training opportunities available | 33% | 39% |
| Opportunities for career development | 25% | 29% |
| Work life balance | 41% | 46% |
| Pay, including benefits/tax credits | 15% | 24% |
| Childcare arrangements when at work | 46% | 51% |
Base: All Motivated but cautious (744), All future cohort participants (3,114)
Care focused
A majority ‘Care focused’ respondents are satisfied with their job (85%), similar to the proportion of the future cohort overall (81%). Satisfaction with various aspects of work is also on a par with the overall sample (see Figure 3.9), although this segment is more satisfied with the hours worked (86% compared with 79% overall). ‘Care focused’ respondents are more likely than other respondents to say that they are in their current job because it fits in with their childcare responsibilities (28%) or their wider caring responsibilities (8%). This group are also younger (49% under 45) and a large proportion are parents, 54% are lone parents and 24% couples with children. Nearly half (45%) have level 3 or higher qualifications.
The ‘Care focused’ group are less keen than some of the other segments to make changes to their current job, with 6 in 10 saying it is important for them to increase their pay (60% compared with 72% overall). They are also less likely than other respondents to say it is important to increase their hours (27% compared with 42%) or to get a new job (22% compared with 37% overall). More than two-thirds (71%) strongly agree that their priority is keeping their current job (higher than the overall figure of 64%).
‘Care focused’ respondents are slightly less likely than other groups to have taken action in relation to progression in the past 12 months, with 64% having taken some form of action compared with 72% overall. This segment prioritises their family and home life above progressing in work. A quarter (25%) also report caring for another adult, which can limit motivation to progress as respondents prioritise their caring responsibilities and the stability of a job which fits with these.
The importance of fitting work around other responsibilities is clear in the attitudes to work for this segment. Almost 9 in 10 agree that ‘if I worked more hours, my home life would suffer’ (88% compared with 68% overall), and almost three-quarters agree that it would be difficult for them to increase their hours (73% compared with 58% overall). They are less likely than other respondents to worry about becoming self-sufficient (63% agree that this is important compared with 74% overall) or to have made a commitment to attend training (36% compared with 46% overall).
Figure 3.9: Satisfaction with job: ‘Care focused’ segment
| Satisfaction with job | Care focused (percentage very satisfied) | All respondents (percentage very satisfied) |
|---|---|---|
| Job overall | 49% | 48% |
| Number of hours worked per week | 55% | 46% |
| The commute to and from work | 66% | 63% |
| Training opportunities available | 37% | 39% |
| Opportunities for career development | 27% | 29% |
| Work life balance | 48% | 46% |
| Pay, including benefits/tax credits | 26% | 24% |
| Childcare arrangements when at work | 54% | 51% |
Base: All Care focused (675), All future cohort participants (3,114)
Stable but stuck
The ‘Stable but stuck’ segment is the least satisfied with their job. Nearly 7 in 10 are satisfied overall (68% compared with 81% of the future cohort overall), and they are less satisfied than the future cohort overall with training opportunities (50% satisfied compared with 66% overall) and opportunities for career development (37% compared with 56% overall). They are more likely than other respondents to say that they are in their current job because it was the only one they could find (15%) (see Figure 3.10).
Despite their dissatisfaction, ‘Stable but stuck’ respondents are reluctant to make changes to their hours, with only 20% saying it is important, compared with 42% overall.
This segment expresses pessimistic attitudes towards work. Only 33% agree that they would be happier and more fulfilled if they worked more hours (compared with 40% overall). This segment is least likely to have made a commitment to attend training (27% agree compared with 46% overall).
‘Stable but stuck’ respondents are the least likely to have taken action in relation to progression in the past 12 months, with 55% having taken some form of action compared with 72% overall. This may be due to the high proportion who have been in their role for a long time (53% have been in their current role for over 5 years and 31% for over 10 years). Respondents who had been in their job for longer were less interested in training. Three in ten (30%) work in elementary occupations which may offer fewer opportunities for progression.
Figure 3.10: Satisfaction with job: ‘Stable but stuck’ segment
| Satisfaction with job | Stable but stuck (percentage very satisfied) | All respondents (percentage very satisfied) |
|---|---|---|
| Job overall | 26% | 48% |
| Number of hours worked per week | 29% | 46% |
| The commute to and from work | 48% | 63% |
| Training opportunities available | 15% | 39% |
| Opportunities for career development | 7% | 29% |
| Work life balance | 25% | 46% |
| Pay, including benefits/tax credits | 8% | 24% |
| Childcare arrangements when at work | 45% | 51% |
Base: All Stable but stuck (501), All future cohort participants (3,114)
Stable and content
Respondents in the ‘Stable and content’ segment are by far the most satisfied with their job. Almost all are satisfied with their job overall (97% compared with 81% overall), and they are more satisfied than other respondents on all of the specific aspects of their work, including hours (97% satisfied compared with 79% overall) and pay (87% compared with 64% overall). They are more likely than other respondents to say that they are in their current job because they enjoy it (50%). Reflecting this satisfaction, 48% have been in their job for over 5 years and 81% have a permanent contract. Full details in Figure 3.11.
‘Stable and content’ respondents are reluctant to make changes to their current job, with 10% saying it is important to get a new job (compared with 37% overall). Over half saying it is important for them to increase their pay (53% compared with 72% overall), and fewer still say it is important to increase their hours (22% compared with 42% overall). More than 9 in 10 in this segment (92%) say that their priority is keeping their current job (higher than the overall figure of 83%). A fifth (22%) have no formal qualifications.
Attitudes towards work are similar to other respondents, except that they are much more likely to agree they don’t need to work more hours or earn more money because they “get by okay” on what they earn (65% compared with 40% overall). Six in 10 (60%) also say they struggle with their bills, the lowest proportion of all the segments, which helps to explain their lower motivation to increase their earnings.
‘Stable and content’ respondents are less likely than other respondents to have taken action in relation to progression in the past 12 months, with 59% having taken some form of action compared with 72% overall.
Figure 3.11: Satisfaction with job: ‘Stable and content’ segment
| Satisfaction with job | Stable and content (percentage very satisfied) | All respondents (percentage very satisfied) |
|---|---|---|
| Job overall | 90% | 48% |
| Number of hours worked per week | 86% | 46% |
| The commute to and from work | 86% | 63% |
| Training opportunities available | 79% | 39% |
| Opportunities for career development | 63% | 29% |
| Work life balance | 87% | 46% |
| Pay, including benefits/tax credits | 61% | 24% |
| Childcare arrangements when at work | 71% | 51% |
Base: All Stable and content (617), All future cohort participants (3,114)
3.1.4. Capability to progress in work
This section looks at respondents’ capability to progress in work for the overall the future cohort sample, for key sub-groups and finally for each of the 5 segments. Overall, the findings show that respondents in the future cohort feel confident navigating the labour market to find progression opportunities but less so in their skills.
The future cohort express fairly high levels of knowledge about being able to progress in work but are more confident about doing so in their current job than applying for a new job. Three in four (74%) agree that they know where to look for opportunities to progress in their work or career, including 45% who agree strongly. A similar proportion (76%) agree that they feel confident talking to their employer about progression or promotion opportunities, and this includes 57% who agree strongly. The majority agree that they feel confident about applying for a new job (63%).
Respondents also feel confident about taking on more responsibility. Approaching two-thirds (63%) disagree that the thought of more responsibility at work makes them nervous, while 29% agree.
However, respondents are less confident in their skills. They are more likely to agree than disagree that they need to improve their skills and qualifications before they can get further at work (47% compared with 37%), while 39% agree that they don’t have the right skills to move to a job with better progression opportunities (although 49% disagree). Full details in Figure 3.12.
Figure 3.12: Capability to progress in work
| Capability to progress | Somewhat disagree | Strongly agree | Total |
|---|---|---|---|
| I feel confident about applying for a new job | 27% | 36% | 63% |
| I know where to look for opportunities to progress in my work/career | 29% | 45% | 74% |
| I feel confident talking to my employer about progression and/or promotion opportunities | 20% | 57% | 77% |
| I need to improve my skills and qualifications before I can get further at work | 21% | 25% | 47% |
| I do not have the right skills to move to a job with better progression opportunities | 19% | 20% | 39% |
| The thought of more responsibility at work makes me nervous | 15% | 14% | 29% |
Base: All future cohort participants (3,114)
Capability: sub-group variations
This section examines the findings by age, job tenure, education level and household composition. Overall, respondents under the age of 45 are more likely than those aged 45 and over to report feeling capable to progress, as are those with qualifications level 3 and above. Respondents who feel less capable of progressing include those who have been in their current job role for over 5 years and respondents with no qualifications.
Age is related to perceived capability. Those under 45 are more likely than those aged 45 and over to agree that they feel confident about applying for a new job (67% compared with 59%); that they know where to look for opportunities to progress (79% compared with 70%); and that they feel confident talking to their employer about progression (79% compared with 73%). However, those under the age of 45 are also more likely to say that they need to improve their skills and qualifications before they can get further in work (54% compared with 41%), indicating that they can feel held back by their skills and education and that support in these areas may be beneficial.
The longer respondents have been in their role, the less confident they feel about their ability to seek new opportunities in the labour market. Those who have been in their role for 5 years or more are more likely than average to disagree that they feel confident applying for a new job (33% compared with 26%) and disagree that they know where to look for opportunities to progress (20% compared with 16%). However, they are also more likely to disagree that they need to improve their skills before they can get further in work (41% compared with 37%), this suggests they have confidence in their skills and qualifications but not in interview skills and job-seeking.
Self-perceived capability to seek a new job and progress is related to existing qualification levels. Those with level 3 qualifications and above were more likely than average to agree that they feel confident about applying for a new job (69% compared with 63%) and that they know where to look for opportunities to progress (78% compared with 74%). Those with no qualifications, however, were not as confident in their ability. This group were more likely than average to agree that the thought of more responsibility at work made them nervous (38% compared with 28%) and that they don’t have the right skills to move to a job with better progression opportunities (61% compared with 39%).
Those who have children at home have more confidence in their ability to get a new job than those who do not but are also more likely to agree that they need to improve their skills. Those with children at home are more likely to agree that they are confident about applying for a new job (67% compared with 55%). There are no differences between lone parents and couples. However, those with children are more likely to agree they need to improve their skills before they can get further in work (49% compared with 41% of those without children) and this is driven by lone parents (51% compared with 45% of those in couples). Those without children at home are also more likely to agree that the thought of more responsibility at work makes them feel nervous (34% compared with 26% of those with children).
Capability to progress in work by segments
This section examines respondents’ capability to progress in work in the 5 segment groups. There is variance in perceived capability to progress among the segments: ‘Keen to progress’ and ‘Care focused’ respondents have confidence in their ability to seek new opportunities but are most likely to identify themselves as needing to improve their skills. ‘Motivated but cautious’ and ‘Stable but stuck’ respondents feel they need improve both to their skills and their confidence. ‘Stable and content’ respondents have the highest levels of confidence in their ability to progress, but as covered above, lack motivation to do so.
Respondents in the ‘Keen to progress’ segment express fairly high levels of knowledge about being able to progress in work. Eight in ten (80%) agree that they know where to look for opportunities to progress in their work or career, higher than the figure for the future cohort overall (74%). They are also more likely to agree that they feel confident about applying for a new job (73% compared with 63% overall) (see Figure 3.13). This group are likely to be younger (under 45) and a quarter (24%) have been in their job for less than a year. This may give them greater confidence, or mean they have better skills in navigating the labour market, than people who have been in their job for longer.
However, they are more likely than other respondents to agree that they need to improve their skills and qualifications before they can get further at work (68% compared with 47% overall).
Figure 3.13: Capability to progress at work: ‘Keen to progress’ segment
| Capability to progress | Keen to progress (percentage strongly agree) | All respondents (percentage strongly agree) |
|---|---|---|
| I feel confident about applying for a new job | 47% | 36% |
| I know where to look for opportunities to progress in my work/career | 52% | 45% |
| I feel confident talking to my employer about progression and/or promotion opportunities | 57% | 57% |
| I need to improve my skills and qualifications before I can get further at work | 43% | 25% |
| I do not have the right skills to move to a job with better progression opportunities | 20% | 20% |
| The thought of more responsibility at work makes me nervous | 12% | 14% |
Base: Keen to progress (577), All future cohort participants (3,114)
‘Motivated but cautious’ respondents are similar to other future cohort respondents in feeling confident about applying for a job and in knowing where to look for progression opportunities (see Figure 3.14).
They are more likely than other respondents to agree that they need to improve their skills and qualifications before they can get further at work (68% compared with 47% overall). As with the ‘Keen to progress’ group, a majority work in low-skill occupations which may explain this. In addition, 4 in 10 (42%) have level 2 or lower qualifications.
Figure 3.14: Capability to progress at work: ‘Motivated but cautious’ segment
| Capability to progress | Motivated but cautious (percentage strongly agree) | All respondents (percentage strongly agree) |
|---|---|---|
| I feel confident about applying for a new job | 39% | 36% |
| I know where to look for opportunities to progress in my work/career | 46% | 45% |
| I feel confident talking to my employer about progression and/or promotion opportunities | 52% | 57% |
| I need to improve my skills and qualifications before I can get further at work | 35% | 25% |
| I do not have the right skills to move to a job with better progression opportunities | 22% | 20% |
| The thought of more responsibility at work makes me nervous | 11% | 14% |
Base: Motivated but cautious (744), All future cohort participants (3,114)
‘Care focused’ respondents are very similar to the future cohort overall in their confidence in applying for a new job (see Figure 3.15), talking to their employer and knowing where to look for progression opportunities. They are also relatively confident in their skills: just 31% agree that they need to improve their skills and qualifications before they can progress at work (compared with 47% overall). As discussed earlier, whilst almost half of this group (45%) have level 3 or higher qualifications nearly 7 in 10 (69%) work in low skill occupations. This suggests that despite their confidence in their skills they may still benefit from skills development to help them progress. The perception that they don’t need to improve their skills may be related to their particularly high levels of job satisfaction and low interest in progressing, which is likely to mean they see little benefit in improving their skills. Alternatively, there could be limited scope to progress in their current position, even with improved skills, hence a lack of interest.
Figure 3.15: Capability to progress at work: ‘Care focused’ segment
| Capability to progress | Care focused (percentage strongly agree) | All respondents (percentage strongly agree) |
|---|---|---|
| I feel confident about applying for a new job | 32% | 36% |
| I know where to look for opportunities to progress in my work/career | 42% | 45% |
| I feel confident talking to my employer about progression and/or promotion opportunities | 57% | 57% |
| I need to improve my skills and qualifications before I can get further at work | 11% | 25% |
| I do not have the right skills to move to a job with better progression opportunities | 15% | 20% |
| The thought of more responsibility at work makes me nervous | 16% | 14% |
Base: All care focused (675), All future cohort participants (3,114)
The ‘Stable but stuck’ segment is one of the older groups and they express the lowest levels of confidence in their capability to progress. This applies to their confidence in applying for a job (43% compared with 63% overall), talking to their employer (60% compared with 76% overall) and knowing where to look for progression opportunities (55% compared with 74% overall). However, they are more likely to disagree that they need to improve their skills and qualifications before they can get further in work (46%, compared with 37% overall) (see Figure 3.16). As discussed, this group are most likely to have a limiting health condition or disability (40%) and their qualification levels are also lower (20%) which may underpin this lack of confidence in their capability to progress. They are also likely to have been in their job for longer (53% over 5 years). Lack of familiarity with changing job and navigating the labour market can lead to lack of confidence in doing so.
Figure 3.16: Capability to progress at work: ‘Stable but stuck’ segment
| Capability to progress | Stable but stuck (percentage strongly agree) | All respondents (percentage strongly agree) |
|---|---|---|
| I feel confident about applying for a new job | 17% | 36% |
| I know where to look for opportunities to progress in my work/career | 21% | 45% |
| I feel confident talking to my employer about progression and/or promotion opportunities | 31% | 57% |
| I need to improve my skills and qualifications before I can get further at work | 7% | 25% |
| I do not have the right skills to move to a job with better progression opportunities | 20% | 20% |
| The thought of more responsibility at work makes me nervous | 18% | 14% |
Base: Stable but stuck (501), All future cohort participants (3,114)
Respondents in the ‘Stable and content’ segment express fairly high levels of knowledge about being able to progress in work. They are more likely to agree that they feel confident about talking to their employer about progression or promotion opportunities (90% compared with 76%). This group are most likely to have a permanent contract (81%) which could underpin their confidence about talking to their employer.
They are less likely than other respondents to agree that they need to improve their skills and qualifications before they can get further at work (35% compared with 47% overall). Full details in Figure 3.17.
Figure 3.17: Capability to progress at work: ‘Stable and content’ segment
| Capability to progress | Stable and content (percentage strongly agree) | All respondents (percentage strongly agree) |
|---|---|---|
| I feel confident about applying for a new job | 38% | 36% |
| I know where to look for opportunities to progress in my work/career | 56% | 45% |
| I feel confident talking to my employer about progression and/or promotion opportunities | 82% | 57% |
| I need to improve my skills and qualifications before I can get further at work | 20% | 25% |
| I do not have the right skills to move to a job with better progression opportunities | 25% | 20% |
| The thought of more responsibility at work makes me nervous | 16% | 14% |
Base: Stable and content (617), All future cohort participants (3,114)
3.1.5. Opportunities to progress in work
This section looks at respondents’ opportunities to progress in work overall, and for key sub-groups and each of the 5 segments. Overall, the findings show that respondents were pessimistic about the opportunities afforded by the labour market, the pay of jobs on offer, or the availability of full-time vacancies.
There is broad agreement among the future cohort that there are limited job opportunities available that offer progression. Three in five (61%) agree that “jobs on offer do not pay enough to make working more hours financially worthwhile”, including 39% who agree strongly, while 21% disagree. More than half (54%) agree that “there just aren’t enough full-time vacancies for everyone at the moment” (35% agree strongly), while 27% disagree.
However, only around a third of respondents (35%) agree that “there isn’t enough advice and support available to help me increase my hours”, while 45% disagree with this statement. Full details in Figure 3.18.
Figure 3.18: Opportunity to progress at work
| Opportunity | Somewhat agree | Strongly agree | Total |
|---|---|---|---|
| Jobs on offer do not pay enough to make working more hours financially worthwhile | 22% | 39% | 61% |
| There just are not enough full-time vacancies for everyone at the moment | 19% | 35% | 54% |
| There is not enough advice and support available to help me increase my hours | 17% | 18% | 35% |
Base: All future cohort participants (3,114)
Opportunity: sub-group variations
This section examines the findings by age and education level. There were no statistically significant responses by job tenure or age of youngest child. Overall respondents under the age of 45 and those with no qualifications are more likely to report fewer opportunities.
Respondents under the age of 45 were more likely than those aged 45 and over to agree that jobs on offer do not pay enough to make working more hours financially worthwhile (66% compared with 61%).
Those with no qualifications are more likely than average to agree that there isn’t enough advice and support available to help them increase their hours (44% compared with 35%) and that there aren’t enough full-time vacancies available (66% compared with 54%). These findings show that these groups may need more support to broaden the scope of opportunities available to them.
Opportunities to progress in work by segments
Findings are broadly consistent across the segments in relation to respondents’ opportunities to progress in work (see Figure 3.19). The differences are as follows:
- ‘keen to progress’ respondents are more likely to agree that “there just aren’t enough full-time vacancies for everyone at the moment” (60%, compared with 54%) and “there isn’t enough advice and support available to help me increase my hours” (46%, compared with 35%)
- ‘motivated but cautious’ respondents are more likely to agree that “jobs on offer do not pay enough to make working more hours financially worthwhile” (68%, compared with 61%). As with the ‘Keen to progress’ group the majority of this group have sought progression opportunities with their current employer: 81% report having taken action to progress in the past year and for 60% this was action relating to their existing job or employer
- ‘care focused’ respondents are less likely to agree that “there just aren’t enough full-time vacancies for everyone at the moment” (49%, compared with 54%) and “there isn’t enough advice and support available to help me increase my hours” (28%, compared with 35%)
- there were no differences between the ‘Stable but stuck’ and ‘Stable and content’ segments and the future cohort overall
Figure 3.19: Opportunity to progress in work: segments
| Opportunity | Keen to progress | Motivated but cautious | Case focused | Stable but stuck | Stable and content |
|---|---|---|---|---|---|
| Jobs on offer do not pay enough to make working hours more financially worthwhile | 40% | 44% | 35% | 35% | 37% |
| There just are not enough full-time vacancies for everyone at the moment | 40% | 35% | 29% | 34% | 38% |
| There is not enough advice and support available to help me increase my hours | 23% | 21% | 10% | 15% | 17% |
Base: All keen to progress (577), All motivated but cautious (744), All care focused (675), All stable but stuck (501), All stable and content (617)
3.2. Qualitative findings
This section explores the themes which shaped attitudes towards progression in work. These themes can be divided into factors which ‘push’ participants away from progression or ‘pull’ participants towards it (see Figure 3.20):
- push factor: a factor which prevents, discourages or impedes progression in work
- pull factor: a factor which allows, encourages or facilitates progression in work
Figure 3.20: Summary of themes affecting progression
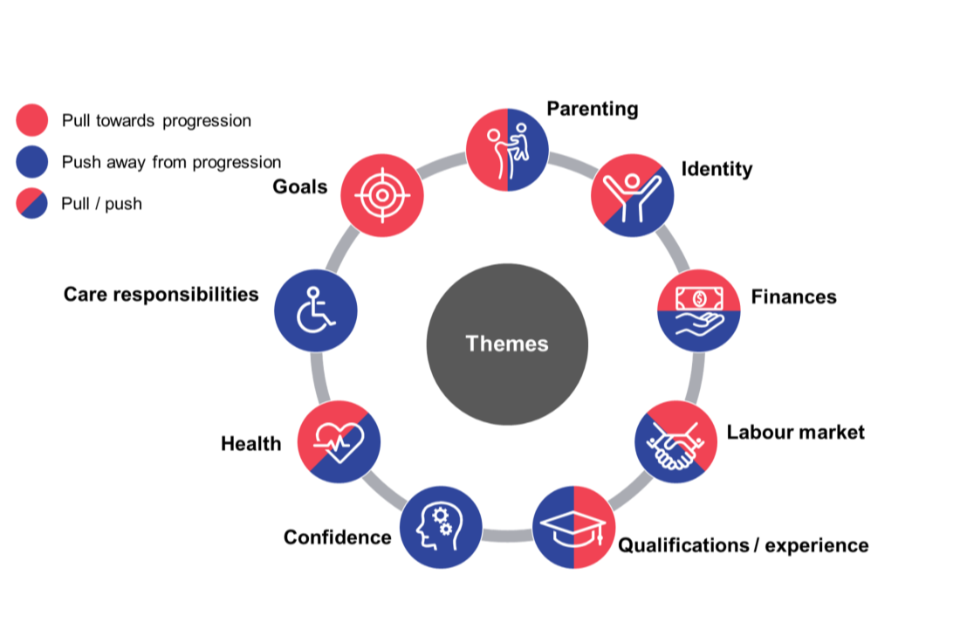
" "
3.2.1. Parenting
Parenting shaped attitudes towards progression both through identity as a parent and the practicalities of combining work with childcare.
Push factors
Parents faced practical challenges to increasing their working hours or changing their role. The cost of formal childcare was viewed as a ‘push’ away from progression. Participants who believed, or had calculated, that additional hours worked would only just cover the cost of formal childcare saw little point in working additional hours for little or no additional financial gain.
In addition to cost, there were participants who were reluctant to use formal childcare for personal reasons. They worried this could be unsettling for their child(ren) and negatively impact their development, particularly if they would have to use multiple childcare providers. Other reasons for not using formal childcare included a reluctance to leave their child(ren) with ‘strangers’ or poor past experiences with childcare providers. For example, one couple who were about to have a baby said that, although they felt childcare was generally good, they had heard stories where this was not the case. The husband said they would feel more secure if they cared for their child themselves, rather than leaving them with strangers. The father was working on a zero-hours contract in merchandising and was keen to get a full-time job, whilst the mother had taken time off work for health reasons. She was keen to return to being a teaching assistant but her husband said she would only think about returning to work once their child reached primary school age.
Parents also reported that childcare provision in their area did not meet their requirements. For example, facilities were not always open during school holidays, and did not always offer breakfast and after school clubs, all of which were needed to support longer working hours. A couple, living in Wales, wanted their children to attend a Welsh-speaking school in their area, however there were no after school clubs available at this school. This meant they had to rely on informal childcare which limited the number of hours they could work.
Some expected suitable childcare to become less of a consideration when their youngest child was old enough to be more independent, for example when they started secondary school. One participant, a single mother, said she was keen to progress once her youngest child was old enough to travel to and from school on their own. This suggests that for these parents, this push factor is only short term. However, there were participants with older children who were reluctant to progress in work. Participants reported several reasons for this:
- children still relied on them to transport them to and from school if public transport provision was poor, unreliable or too expensive. This applied particularly to rural areas but also in some suburban areas
We didn’t have a local office and they wanted me to travel down to Poole [for training], and I said ‘I need to take my son to school, I’m a single parent’.
Female, 55 to 60
- children had physical, psychological or behavioural needs, which means their parents feel more comfortable taking them to and from school themselves
- being content with their routine and work-life balance. In some cases, this attitude persisted even after children had left home
As well as the practical and personal reasons for not using formal childcare among those for whom parenting acted as a ‘push’ away from progression, their identity as a parent meant that they wanted to be present for their children as much as possible. As such their work needed to fit around school hours and school holidays, for example, working as a teaching assistant or in a school kitchen. These parents were reluctant to increase their working hours as it would reduce the time they had to spend with their children. This view reflects those in the ‘Care focused’ segment most strongly who have higher job satisfaction, lower motivation to progress and are particularly likely to feel that it would be difficult for them to increase their working hours or that their home life would suffer if they worked more.
My childcare fits around [work] and everything’s just good. So, I’m dropping her to school every day, I’m picking her up every day and nothing needs to change at the moment.
Female, under 45
Lone parents with this belief felt it was particularly important that they spent plenty of quality time with their child(ren) as they were the only parental role model.
Being a lone parent means I’m aware that I don’t want to leave my children for long periods of time – it feels like the right thing to be around for as much as I can be.
Female, 35 to 44
Among couples, there were examples of women stopping work to be at home with children whilst the father worked as they felt this was the best way to raise their children. These participants felt very strongly about the value they were bringing to society in raising the next generation of citizens. For example, in a couple with 2 teenage children the father worked 10 hours per week for a maintenance company and was the sole earner; the mother looked after their children. She felt it was important that the children have a parent at home and described being a mother as a full-time job. She had not looked for work when the children went to secondary school as she still felt they needed her and she had responsibilities at home and she had also taken on caring responsibilities for her father.
Participants with this perspective believed that increasing their hours would be stressful which would have a negative impact on parenting ability and family relationships. They valued the stability of their current job and were reluctant to change this in case it did not fit as well with their family responsibilities or caused them additional stress. Again, this is particularly likely to be those in the ‘Care focused’ segment who were most likely to be couples with younger children.
[It] was a really hard decision [to turn down a job] … but that’s not as important to me as having a good relationship with my daughter and that’s what matters to me above everything else.
Female, 45 to 54
Pull factors
There were also examples of parental identity serving as a ‘pull’ factor towards progression. These parents wanted to be a positive role model for their children, by demonstrating the benefits of being financially independent, contributing to society and not relying on benefits. Parents in this position were motivated to progress in work. These attitudes were more common among those who felt their children were less dependent on them, for example, when they were of an age where they could walk to and from school themselves. This was evident among participants in the ‘Motivated but cautious’ group who demonstrated feeling caught between wanting to work more and not being sure if it would benefit them financially (due to the cost of formal childcare). For example, one lone parent was working as a nursery assistant and training to be a counsellor, so that when her children went to school, she would be able to work more hours in something she found more personally fulfilling. She thought it was important to demonstrate the importance of working and being financially self-sufficient to her children.
What I’ve got is mine and I’ve worked for it and once your kids see that it should continue.
Female, 45 to 54
I think it’s important for children to see their parents work.
Female, 35 to 44
There were parents using a combination of free formal childcare provision and informal childcare provided by friends and family to enable them to work more. For example, one single mother placed her youngest child in nursery school for 3 days each week, with her aunt one day a week and she had one day off in the week to look after him. The benefit of using informal childcare was that her child got to spend time with their extended family.
3.2.2. Identity
Push factors
As with parental identity, there were examples of personal identity ‘pushing’ participants away from progression. Participants who were motivated to work in a particular role or sector, could become ‘stuck’ as a result of setting difficult to achieve goals or being inflexible about the type of role they would accept or want to progress in. This was more likely among individuals with high qualifications who were resistant to pursuing options that could enable them to increase their income, if it did not relate to their interests or passion. For example, one participant was working 16 hours a week as a retail assistant. She wanted to pursue a career in journalism so was unwilling to accept additional hours in a retail role to allow her time to do so. This was evident among the ‘Keen to progress’ group, reflecting their self-identified need to improve their skills before they were able to progress.
Identity acting as a push away from progression was also seen among participants who were in a job that they enjoyed and felt was important to society, or who saw their job as part of their identity. This prevented participants from seeing value in moving job roles even if there was little or no opportunity for progression in the current role. For example, participants who worked as teaching assistants found this role very satisfying and were unwilling to consider other types of role. However, they recognised that there was no opportunity for them to increase their hours or earn more in the role.
Another element of identity that acted as a ‘push’ away from progression was life stage. Those who felt they were drawing closer to retirement (mid-50s onwards) were reluctant to progress in work as they believed they should be winding down and pursuing their own interests rather than working more. This was particularly evident among the ‘Stable and content’ segment who wanted to continue working at their current pace, or wind down, rather than start working more.
I can’t see that there would be anything better for 2 days a week … I feel I should be winding down not winding up … I’m working now because I have to work. I have no option.
Female, 61 to 64
Pull factors
There was a strong theme among participants of believing that working is about more than just making a living and feeling it was important to do something that they enjoy, are passionate about or is valuable to society. For example, one mother of 4 worked part-time in accountancy and also made jewellery in her parents’ shed which she sold at craft markets. She enjoyed this balance and wanted to pursue a job that incorporated her passion for crafts and manufacturing. This suggests that ensuring opportunities for progression, in their current or a new job, which appeal to this belief could help encourage participants to progress in work. This belief was particularly strong among people who were working in schools or with children. They wanted to contribute positively to society and so a job in retail or an office was less appealing.
For participants with clear and achievable goals, their drive to pursue a certain career acted as a strong motivation to progress in work. Participants with opportunities available to them in their field of interest had a sense of direction and wanted to progress.
Participants who wanted to come off benefits and be self-sufficient were also more motivated to progress in work and the type of work was less important to them. These beliefs were more strongly associated with the more motivated segments, ‘Keen to progress’ and ‘Motivated but cautious’.
3.2.3. Finances
Push factors
There were participants who had little motivation to progress as they believed that, under the current tax credit and benefit system, they would not be financially better-off if they worked more hours. Overall, they thought the increase in earnings would not offset the loss to their benefits. This belief was found both among those who had used online calculators to establish whether or not this was the case and those who believed it to be true but had not checked. This belief was found across the segments. The more motivated segments (‘Keen to progress’ and ‘Motivated but cautious’) were more likely to report that they had checked what effect working more hours would have on their income. However, the older, less motivated segments (‘Stable but stuck’ and ‘Stable and content’) were less likely to report this.
So, with myself, if the option came up for extra hours, I could potentially look into it, consider it as an option and try and work around it, but doing that, my tax credits will drop, and I’d potentially would be working probably getting the same income when that increases, if my tax credit decreases.
Female, under 45
Participants were also unwilling to take on jobs or roles which were seen as more stressful or demanding for what they saw as little additional reward, such as an additional 50p an hour. For example, one individual felt that the additional pay of being promoted to a senior carer would not compensate for the added stress and responsibility she felt that she would be given.
There’s no way of me progressing [by becoming leader] … there’s only 50p difference in our wage … I can’t be doing with the stress and the hassle.
Female, 35 to 44
Those who were more vulnerable, for example, those with a disability or health condition, debt, caring responsibilities or who were highly financially dependent on their benefit claim, were particularly worried about the risk of losing benefits, described by one participant as a “security blanket”. This group were concerned that they would be unable to access benefits in the future if they needed them. Participants felt that they understood how tax credits and Housing Benefit interacted with work and planned their time carefully to make sure they stayed within the limits. For example, one participant had grown up children who had left home. She worked 16 hours a week as a personal assistant for a man with physical disabilities, helping with his shopping and household management. She had been diagnosed with a mental health condition and did not feel capable of changing job and working with other people. She also raised concerns about losing her benefits and not being able to claim them again in the future.
Pull factors
As shown in the quantitative findings, participants were driven by increasing their pay. This was a clear motivator for participants, as having more disposable income was seen as being beneficial for both themselves and their family. However, participants in all segments felt that they would need to feel better off every month (after any reduction to their benefits) for them to increase their hours. A small or marginal increase was not enough.
3.2.4. Labour market
Push factors
Respondents who felt there was a lack of full-time and permanent job vacancies, reported feeling less motivated to progress by getting a new job. This finding is mirrored by the quantitative research. The quantitative survey found that over half (54%) believe ‘there just aren’t enough full-time vacancies for everyone at the moment’. This belief was particularly common among the ‘Keen to progress’ segment (60%). This meant they saw little chance of getting a better, more stable job, which reduced their motivation to progress, for example, by investing time and money in getting training and qualifications. This applied especially to those living in rural or deprived areas. As discussed above, this pessimism about the labour market was seen in all segments both among those who had, and had not, taken action to explore the opportunities available. This shows that among those who had not explored the available opportunities there is still a perception that there is a lack of jobs, particularly permanent jobs, which may affect motivation to look.
I don’t think my interview performance is a barrier as much as the fact there are too few jobs.
Female, 35 to 44
The perception of the prevalence of zero-hours contracts and unwillingness to take this type of job also served to push people away from looking for alternative jobs. A permanent job (albeit with fewer hours) was seen as better than a more unstable or insecure job which could offer more hours one week and less the next. For those who were keen to progress, zero-hours contracts were not seen as a good place to start from, as they felt employers focused training opportunities on employees with permanent contracts. One participant, for example, spoke about how despite expressing interest in building her skills, her company had not offered her training in 2 years because they prioritised provision for full-time staff and those with permanent contracts.
There were also participants who felt there was a lack of opportunity in their local area that would fit around their routine and family responsibilities. This was a concern among parents and those with caring responsibilities, who valued stability and flexibility and were less willing to increase their hours or travel further for work. This was particularly the case for ‘Care focused’ participants who were particularly likely to say they would find it difficult to work extra hours or that their home life would suffer if they did. The ‘Motivated but cautious’ segment were also likely to need flexibility and for their job to fit around their family responsibilities.
The travel can add 2-3 hours. I’m too old for this type of work now but there’s nothing else locally. I’m looking all the time.
Female, 45 to 54
There were also structural challenges to progressing in work. For example, participants working short-hours jobs in schools, for example, as a lunchtime cook or teaching assistant felt that their job was important and valuable. It was not possible to increase their hours in their current job and difficult to find a second job around these hours which would fit with their family responsibilities. It was also difficult for participants in roles with limited opportunity to progress, such as childcare and social care, to see what progression could look like. All segments were affected by this, as a high proportion of the ‘the future cohort’ group are working in low-skill sectors.
They’re all offering 16 hours but you have to be flexible so you can’t take 2 jobs and I’d need 2.
Female, 45 to 54
Pull factors
A strong ‘pull’ towards progression was the possibility of a job that offered more money, hours, opportunities and stability, whilst also being flexible, convenient and aligned with the individual’s interests. People who felt optimistic about progression and could see opportunities with their current employer had been able to find out about these, for example, by talking to their manager. They reported that discussing job opportunities was helpful in planning what they could realistically expect to achieve and plan concrete steps to progression. Greater awareness of the opportunities and support available made them both more positive and more motivated about progression. The ‘Keen to progress’ segment was the most likely to have explored opportunities for progression, particularly within their current employer.
Given the opportunity I am more than willing to go into a higher paid job. I’d love to be out of the house more often bringing in more money.
Male, 25 to 34
Participants on zero-hours or fixed-term contracts were also motivated to progress into a permanent contract which would give them greater financial stability. Again, the ‘Keen to progress’ segment were most likely to be on a fixed-term or zero-hours contract which may explain some of their motivation to progress.
3.2.5. Qualifications and experience
Push factors
Participants with higher level qualifications were likely to have a particular view of the type of work they wanted to do and were reluctant to progress in an area or sector which was unrelated to this. These claimants would need support to think about different, but related, fields or areas which offer greater opportunities for progression. For example, a participant who taught one class per week in the music department at a university knew that there would not be an opportunity to work more hours in her current job but said she could not imagine herself teaching music anywhere else (for example a secondary school), or doing another sort of job where she could not apply her interests, experience or qualifications.
Those with low qualifications lacked confidence in their ability to progress. This reduced their motivation to try and progress in work as they did not feel it would be possible. Addressing the confidence gap, as well as the skills gap, could be an important step in helping to build motivation.
My only anxiety about [getting another job] is not having the qualifications. I’d do anything if someone wanted me, unless it is something I would really hate, like being a driver and being on my own.
Female, 35 to 44
Participants also raised concerns about the cost of improving their qualifications as they had little financial capacity to invest in this. As well as this, participants reported experiences of qualifications not having helped them to get a job. These participants felt that work experience was sometimes more important than qualifications.
I done a few courses that, I got a security badge, I tried to find a job in that, couldn’t get a job. So, they’re saying you need 6 months experience. Forklift license, I had that, the Jobcentre paid for that, same thing with that, you needed experience.
Male, over 35
Pull factors
Participants who reported feeling positive about gaining qualifications saw this as a motivating achievement which could open up new opportunities. This suggests that for qualifications and training to be attractive and help support progression, claimants will need reassurances that the qualifications will be recognised and valuable in helping them to progress. Some will also need support to gain experience in a new sector or learn how to transfer their skills. The cost and accessibility of training also determined participants’ interests in building their skills and qualifications. This is covered in more detail in chapter 4.
If someone were offering me free training, I would take it up.
Female, 35 to 44
3.2.6. Confidence
Push factors
Participants who lacked confidence in their ability to learn new skills or to perform well in an interview were ‘pushed’ away from progression. For example, one participant who had been working in a school for a long time, wanted to work as a receptionist but felt she lacked the IT skills to be able to do so and she lacked the confidence to address this skills gap. There were also examples of older participants reporting that IT skills training was for ‘younger people’ and not for them. The ‘Motivated but cautious’ and ‘Stable but stuck’ groups were most likely to lack confidence in their ability to progress.
For those who lack confidence, addressing this alongside skills gaps will help them seek and take-up opportunities to progress.
It was a bit of a head freeze for me to do a CV.
Male, 45 to 54
3.2.7. Health
Push factors
27% of the future cohort participants reported having a long-term health condition or disability. The ‘Stable but stuck’ group were most likely to have a limiting health condition or disability. In the qualitative interviews, these participants reported that this limited the number of hours and the types of activities they felt able to do and therefore their perceived ability to progress. For example, one participant had suffered a stroke 3 years prior which had left him with physical disabilities. He said that, although he wanted to work more hours, he did not have the physical energy to do so. In addition, certain tasks were no longer open to him for health and safety reasons. He felt that being physically restricted in both the hours he could work and the type of work he could do limited his progression opportunities.
Participants with a health condition or disability reported that it was easier to manage their condition if their day-to-day workload did not vary and that they knew that their employer or colleagues would be flexible if necessary. This was particularly the case for those who had a mental health condition such as anxiety or depression. These participants also described being unable to increase their hours or responsibilities because this would lead to stress or fatigue which could exacerbate their condition.
I can only do what I can do. I’d like to do more, but I get stressed and anxious and lose it.
Male, 35 to 44
People in these circumstances were likely to value stability and flexibility above progression. They were content to have a job which allowed them to successfully manage their health condition or disability and were wary of changing this in case it did not fit with their personal circumstances. This is reflected in the lack of confidence and motivation the ‘Stable but stuck’ group demonstrate towards progression.
I’m comfortable with what I’m doing, how much I’m doing at the moment. I’m managing well. Doing more might be too stressful.
Male, 35 to 44
These factors acted as a pull away from increasing hours or undertaking training, at least until they felt their health issues were resolved or manageable (if this was likely to change or improve). This was particularly the case for those with short- to medium-term conditions, as they did not want to jeopardise their recovery or current health. There were also examples of a sudden health change or scare having triggered a re-evaluation of priorities away from work and progression. A participant with this experience discussed how work and future progression had decreased in importance after a cancer diagnosis and treatment. Goals such as spending more time with children or grandchildren or on their own interests became higher priorities. There were also examples of people who had to reduce or change their work in response to a health condition finding this knocked their confidence. This group was reluctant to progress or make longer-term career plans in case of any further setbacks.
When you’ve nearly kicked the bucket and you’re a mum, the time that you have with your loved ones, you appreciate … it doesn’t actually really become something that is your only consideration that matters to you unless you’ve actually nearly died.
Female, 45 to 54
Pull factors
Health acted as a pull towards progression among people with long-term health conditions or physical disabilities who reported that working gave them something positive to focus on and, for those in recovery, helped to lift their mood and aided their rehabilitation. This group were happy to progress provided it was within their physical and mental limits.
[It] feels like I’m contributing to the family … I’m not stuck indoors 24/7, sat on the couch doing nothing, watching TV – that’s not me, that’s never been me.
Male, 45 to 54
Supporting people with health conditions and disabilities to progress in work requires a clear understanding of the individual’s condition and how this affects what work they can do and signposting to relevant training and employment opportunities.
3.2.8. Caring responsibilities
Push factors
Caring responsibilities for adults and disabled children affected the hours participants felt able to work, their preferred location of work and the flexibility they required. Fifteen per cent report having caring responsibilities for another adult, rising to a quarter (25%) of the ‘Care focused’ segment. Participants who were caring for someone with particularly complex needs or someone other than a direct relative felt that this acted as a particularly strong pull away from progression as it required greater investment of their time, leaving less time for work or training.
We [me and my husband] should be having quality time together but we can’t [because of his health condition] … If I went back to working more hours – he’s diabetic and has to eat at certain times – I’d have to leave food out for him.
Female, 61 to 64
We don’t make any plans. It’s doesn’t take much, he could have another stroke.
Female, 61 to 64
Participants who saw caring as their main priority had little motivation to progress in work. Having secured a job which fit with their caring opportunities they had little interest in other opportunities or progression. They were also less interested in social care provision to support them and enable them to progress as they felt providing care was their responsibility. For example, a couple whose youngest daughter was severely disabled have jobs that allow them to care for their daughter whilst also managing their own health and wellbeing. The mother works 20 hours a week at a children’s hospice and the father works 25 hours a week as a bus driver for children with special needs. Their daughter requires 24-hour care as she is unable to walk, talk or feed herself, and the mother thinks that she will have to stop working and become a full-time carer when her daughter turns 18 and leaves school later in the year to provide care for her in the daytime. This couple value the balance they have achieved and are reluctant to risk this by changing jobs or increasing their hours, especially when they are anticipating a big change in the near future.
There were also those who wanted to progress but felt that their caring responsibilities limited their capability do so. This group felt that there was no-one to take over their caring responsibilities if they were working more and/or that current social care provision in their area was inadequate to enable this. If additional social care support could be provided, this group were more open to exploring progression. For example, one participant had 3 children who had disabilities and support needs. They went to 3 different schools and needed transporting there each morning and collecting in the evening. This limited her ability to work more.
We are carers by need, not by choice.
Male, 45 to 54
3.2.9. Goals
Push factors
Participants with no goals or aspirations for their future work or career were less likely to be motivated to progress in work.
My job just earns some money to help pay the bills really – a means to an end.
Female, 45 to 54
Pull factors
Having a clear goal for what they wanted to achieve and the steps they would need to take acted as a strong push towards progression. For example, one lone parent was working as a kitchen assistant in a school. She wanted to progress to be the head cook as she felt she could do the job as well as or better than the current person in the role. She knew that to be able to take on this role she would need an NVQ level 3 in food preparation and had approached her employer about supporting her to take this. She was confident that she would be able to fit studying in around her job and family commitments as she had done a previous NVQ and had managed this. This participant had a clear strategy for achieving her goal and this helped motivate her to do so.
Helping claimants set clear and achievable goals, and identify clear steps to achieving these, could help underpin motivation to progress.
4. Support
This chapter explores respondents’ understanding of available support and what forms of support would enable them to progress in work. This section also examines the suitability of different forms of support for different groups of respondents. Findings from the quantitative survey are presented first – at the overall level and for the different segments, followed by findings from the qualitative research.
Chapter summary
Supporting progression
- when considering the relative value of different features that may be positively associated with a job, respondents are most likely to value “a role which fits with my caring or family responsibilities and/or health condition”, followed by “a role that pays enough for me to come off benefits or tax credits completely and be better-off”
- respondents say that a number of things would make it easier for them to progress in work: support and training with work-related skills (51%), support to pursue further or higher education (45%) and support and training on finding or getting a new job (42%)
- respondents are most likely to say they would like their employer to support them to progress in work (61%). Alternatively, they would like to find support from online sources (40%), friends or family (36%) or Jobcentre Plus (JCP) (34%)
- the qualitative research found that participants with more complex childcare, social care or debt support needs wanted more holistic support to help them to overcome these obstacles and consider progression
- among participants who felt they needed support to develop their skills in order for them to progress support preferences depended on existing skills and education levels. Participants with low qualifications and positive perceptions of JCP were open to support from JCP, whereas those with higher qualification would be more receptive to support from an accredited training provider
- participants who were confident in their skills and motivated to progress by moving job wanted support to find a new job including CV writing, interview skills and job-seeking. Again, those with lower skills would be responsive to support from JCP, whilst those with higher qualifications would be interested in receiving this support from an employment agency
- participants who were satisfied with their current job and could see, and wanted to take up, progression opportunities with their current employer found work-related support most appealing
4.1. Quantitative findings
4.1.1. Progression preferences
Respondents were asked to consider the relative importance of different features in a job to them. The features are presented in Figure 4.1. The analysis is derived from a ‘MaxDiff’ exercise which produces a relative importance score for each feature[footnote 17].
Respondents are most likely to value “a role which fits with my caring or family responsibilities and/or health condition” (importance score of 63), followed by “a role that pays enough for me to come off benefits or tax credits completely and be better off” (score of 48).
The following have a medium ranking in importance: “a role that is permanent” (importance score of 36), “a role which allows flexible working” (35), “a role that pays more than I am currently earning” (32) and “a role that is interesting and fulfilling” (30).
Of lower importance are “a role with good prospects for career development and promotion” (importance score of 19), “a role with additional benefits” (19), “a role with training and support to get qualifications” (18) and “a role that is easy and affordable for me to get to” (18).
This analysis demonstrates that for the future cohort, family and home commitments are most important and work and progression will need to be flexible to fit around this. They place this above career development and training and also ease of access (however, it can also be inferred that, to fit with caring or family responsibilities, a role would need to be easy to get to). However, the future cohort also demonstrate that they are motivated to come off benefits. A job which ‘pays more’ is relatively less important than a job which allows respondents to come off benefits and be better off, suggesting that an uplift in total household income would be important to motivate progression.
Figure 4.1: Progression preferences
| Progression preference | Max Diff analysis – importance of different elements in encouraging progression |
|---|---|
| Fits with family/care/health | 62.7 |
| Pays enough for me to come off benefits | 47.9 |
| Permanent | 36.3 |
| Flexible, for example hours/work from home | 35.4 |
| Pays more | 32.4 |
| Interesting and fulfilling | 30.3 |
| Good prospects for career development | 19.2 |
| Additional benefits, for example pension or bonus | 18.8 |
| Training and support for qualifications | 17.7 |
| Easy and affordable to get to | 17.7 |
Base: All respondents (3,114)
Progression preferences: segments
The main variations in the progression preferences of each segment are as follows (see Figure 4.2):
- ‘keen to progress’ respondents place a relatively low priority on work that fits in with family, caring or health (in comparison with other segments), and place a higher value on earning enough to come off benefits and on career development and promotion. Eight in 10 say they are struggling with bills and a similar proportion (81%) say it is important to be self-sufficient, which may help to explain the relatively higher priority of earning enough to come off benefits. Less than half (45%) of this segment are parents, explaining why family or caring responsibilities might be relatively lower priority than for other segments. In addition, nearly 7 in 10 (68%) are in couples, so those who are parents may have childcare support, again making this relatively less important
- ‘motivated but cautious’ respondents place an equal value on “a role that pays enough for me to come off benefits or tax credits completely and be better off” and “a role which fits with my caring or family responsibilities and/or health condition”. Otherwise, priorities are similar to the future cohort as a whole, although ‘Motivated but cautious’ respondents place a relatively high emphasis on good prospects for career development. As with the ‘Keen to progress’ group, 80% of this segment say it is important to be self-sufficient and a similar proportion are struggling with their finances (79%), which helps to explain the importance of earning more and coming off benefits. However, they are all lone parents, which explains the equal importance of a role fitting with family responsibilities
- ‘care focused’ respondents place a very high emphasis on “a role that fits in with caring or family responsibilities or their health”, as well as “a role with flexible working”. Increasing pay and coming off benefits are less important than for other segments. Nearly 8 in 10 (78%) of this segment are parents, of which half are lone parents. A quarter (25%) have caring responsibilities for another adult. These factors explain the high relative importance of a role which fits around their caring responsibilities
- ‘stable but stuck’ respondents place equal value on “a role that pays enough for me to come off benefits or tax credits completely and be better off” and “a role which fits with my caring or family responsibilities and/or health condition”. Career development and training have a low priority for respondents in this segment. This group are more likely than the future cohort as a whole to have a limiting health condition or disability (24%), which may be which may be why a role which fits with this has relatively high importance for them
- ‘stable and content’ respondents are most concerned with a role that “fits with my caring or family responsibilities and/or health condition”. They also place a relatively high value on work that is interesting and fulfilling and a role which has additional benefits. This group are least likely to say they struggle with their bills, which may be why earning more is relatively less important. They were also the least likely to have taken action to progress and most satisfied with their current role, which may be why a role which fits with wider responsibilities are important, as their current job allows them to do this
Figure 4.2: Progression preferences: ‘Keen to progress’ and ‘Motivated but cautious’, ‘Care focused’, ‘Stable but stuck’ and ‘Stable and content’ segments
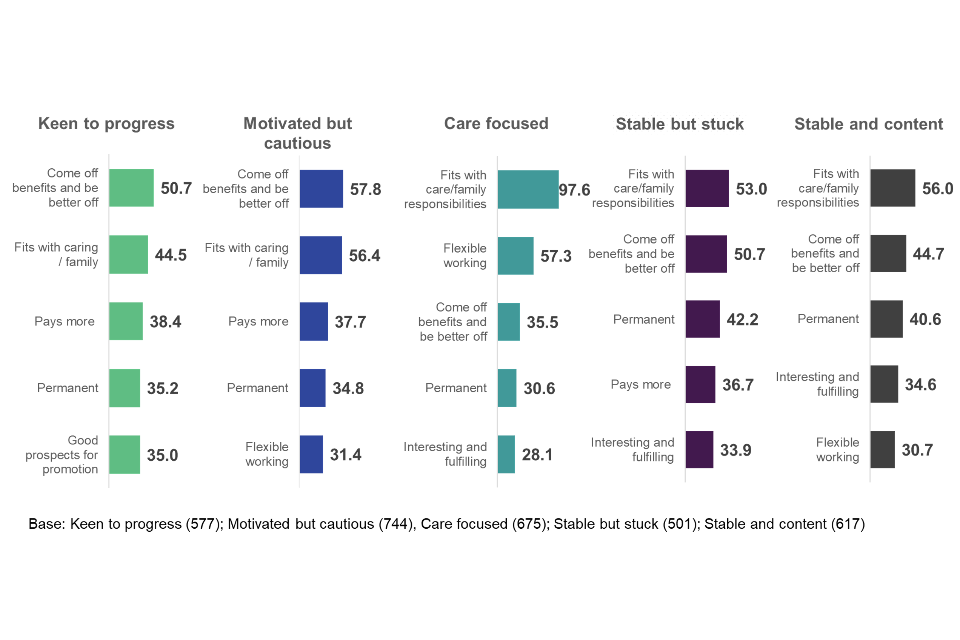
" "
4.1.2. Support preferences
Respondents were asked what would make it easier for them to progress in work (see Figure 4.3). They are most likely to say that support and training with work-related skills would help them to progress (51%), while 45% feel that support to pursue further or higher education would help them, and 42% specify support and training on finding or getting a new job. Similar proportions say that it would be easier for them to progress if they had help with cost of travel to and from work (38%) or support to manage a physical or mental health condition (37%), while 26% specify access to affordable or good quality childcare.
Figure 4.3: Support measures that would help progression
| Support measure | Percentage |
|---|---|
| Support and training with work-related skills | 51% |
| Support to pursue further or higher education | 45% |
| Support and training around finding/getting a new job | 42% |
| Help with the cost of travel to and from work | 38% |
| Support to manage physical or mental health condition | 37% |
| Access to affordable/good quality childcare | 26% |
| Support to manage caring responsibilities | 6% |
| Other | 4% |
| None | 13% |
| Do not know | 1% |
Base: All future cohort participants (3,114)
When asked who they would like to support them to progress in work, respondents are most likely to specify their employer, company or line manager (61%), suggesting they see progression in the context of their existing workplace and job. Outside of work, 40% would like support from online sources, 36% would go to friends or family, and 34% would like support from Jobcentre Plus (JCP). Other sources of support are a library or other community hub (28%), the National Careers Service (25%) and a children’s centre (12%). Full details in Figure 4.4.
Figure 4.4: Sources of support
| Source of support | Percentage |
|---|---|
| Employer/company/line manager | 61% |
| Online sources | 40% |
| Other friends/family | 36% |
| Jobcentre Plus | 34% |
| Library or other community hub | 28% |
| National Careers Service | 25% |
| Children’s centre (parents only) | 12% |
| Partner | 9% |
| Someone else | 10% |
| None | 3% |
| Do not know | 2% |
Base: All future cohort participants (3,114)
Support preferences: sub-group variations
There are variations in the findings on support preferences in relation to demographic sub-groups. This section examines the findings analysed by presence of children, partner work status, age, hours currently worked, education level, health or disability and English as a second language.
Those with children at home were more likely than those without children to want support with work-related skills (54% compared with 44%) or support to pursue more education (50% compared with 33%). Those without children at home expressed a greater preference for support to manage their health condition (41% compared with 35%) or support to manage care responsibilities (14% compared with 3%). Respondents with children at home were more likely to be open to support from all providers.
Lone parents were more likely than average to say that support with further or higher education would help them to progress in work (51%, compared with 45%), as well as access to good quality childcare (38%, compared with the average, 26%). This group were more likely than average to say they would want this advice from the National Careers Service (29%, compared with 25%) and a children’s centre (17%, compared with 12%).
Respondents with a working partner were more likely than those with a non-working partner to say that support to pursue further education (46% compared with 36%) or affordable childcare (28% compared with 18%) would make it easier for them to progress. Those with a non-working partner may be less likely to see the need for access to childcare to help them to progress as their partner is able to take care of the children, in contrast to those in a couple where both work. However, both those with a working partner and non-working partner agree equally (53% and 57% - not significant) that it would be difficult for them to increase their hours of work. This suggests that for those with a non-working partner attitudinal rather than practical barriers hold them back from working more.
Under 45s demonstrated greater openness to support for progression than those aged 45 and over. They were more open to all forms of support, including support with work related skills (54% compared with 49%), support to pursue education (53% compared with 38%) and support to get a new job (45% compared with 39%). Those aged 45 and over were more likely to say that no type of support would help them to progress (16% compared with 11%). Under 45s were also more open to support from all types of providers than those aged 45 and over, including employer (64% compared to 58%); online (42% compared with 38%); friends and family (38% compared to 34%) and the National Careers Service (28% compared with 23%). However, there were equal levels of preference across age groups for JCP (34%).
Respondents working fewer hours were more likely to welcome support from JCP. Those working under 25 hours (36%) a week are more likely than those working 26 to 35 hours (28%) to say they would want support from JCP.
There are some differences by level of education. Respondents with no formal qualifications are less likely than those with higher qualifications to want support to pursue further or higher education (39% compared with 46% of those with qualifications). They are more likely to say that they would like support from JCP to help them progress (43% compared with 32%) but are less likely to say they would like support from their employer (55% compared with 62%).
Respondents with a limiting health condition or disability are more likely than other respondents to say that support to manage a physical or mental health condition would help them to progress (63% compared with 37%). They are also more likely to say that help with the cost of travel to and from work would be beneficial (43% compared with 38%). They are also less likely than other respondents to say they would like support from online sources (32% compared with 40%).
Respondents who speak English as a second language are more likely than those who speak English as their first language to want support to help them to progress in work, specifically: support and training with work-related skills (61% compared with 48%); support to pursue further or higher education (52% compared with 43%); support and training in finding or getting a new job (50% compared with 40%); help with cost of travel to and from work (43% compared with 37%) and access to affordable or good quality childcare (32% compared with 24%). They are more likely than those who speak English as their first language to say that they would like support from JCP to help them progress (40% compared with 33%), but less likely to want support from online sources (31% compared with 42%) or friends or family (31% compared with 37%).
Support preferences: segments
The main variations by the 5 segment groups in terms of their support preferences are as follows (see Figure 4.5):
- ‘keen to progress’ respondents are most likely to say that there are numerous types of support that would help them to progress, particularly support and training with work-related skills (66%). As explored earlier, this group had demonstrated high levels of motivation to progress, which may explain their openness to such a wide range of types of support. However, they are less likely than average to say that access to better or more affordable childcare would help them (19%). Less than half (45%) are parents and nearly 7 in 10 (68%) are couples, they are therefore less likely to need formal or informal childcare. In terms of where they would like help from, they are more likely than other respondents to specify JCP (40%) and the National Careers Service (31%)
- ‘motivated but cautious’ respondents are the most likely to say that access to better or more affordable childcare would help them progress (39%). This is likely to be the result of all of this group being lone parents, who could feel constrained due to their parental responsibilities. They are also the most likely to say that support to pursue further or higher education would help them progress (59%). The same proportion (59%) also agree that they need to improve their skills and qualifications before they are able to progress in work, explaining their interest in this form of support. In terms of who they would like help from, they are more likely than other respondents to specify libraries (32%), the National Careers Service (32%) and children’s centres (17%)
- ‘care focused’ respondents are less likely than average to see the value in most of the types of support, with the exception of access to better or more affordable childcare, which 32% think would help them to progress. This ties in with this group’s unwillingness to progress due to their caring responsibilities. In particular, 88% state that their home life would suffer if they worked more and 73% believe it would be difficult to increase their hours even if this was offered to them. This will need to be considered before they can be encouraged to take up support to progress in work
- those in the ‘Stable but stuck’ segment are less likely than average to see the value of most of the types of support, especially support to pursue further or higher education (28%) and access to better or more affordable childcare (6%). They are also less likely to say they would like support from various sources. This group were least likely to have taken any action to progress in the past 12 months, suggesting they could be hardest to engage with support
- ‘stable and content’ respondents are also less likely to see the various types of support as helping them, with relatively low proportions mentioning help with travel costs (31%) or access to better or more affordable childcare (14%). This segment is the most likely to say that they would like their employer to help them to progress (70%). This group were in the most long-term employment, which may reflect their higher levels of preference for progressing with their current employer. This suggests that they may be among the harder groups to engage with support and that support is most likely to appeal if it focuses on progressing in their current role
Figure 4.5: Support preferences: segments
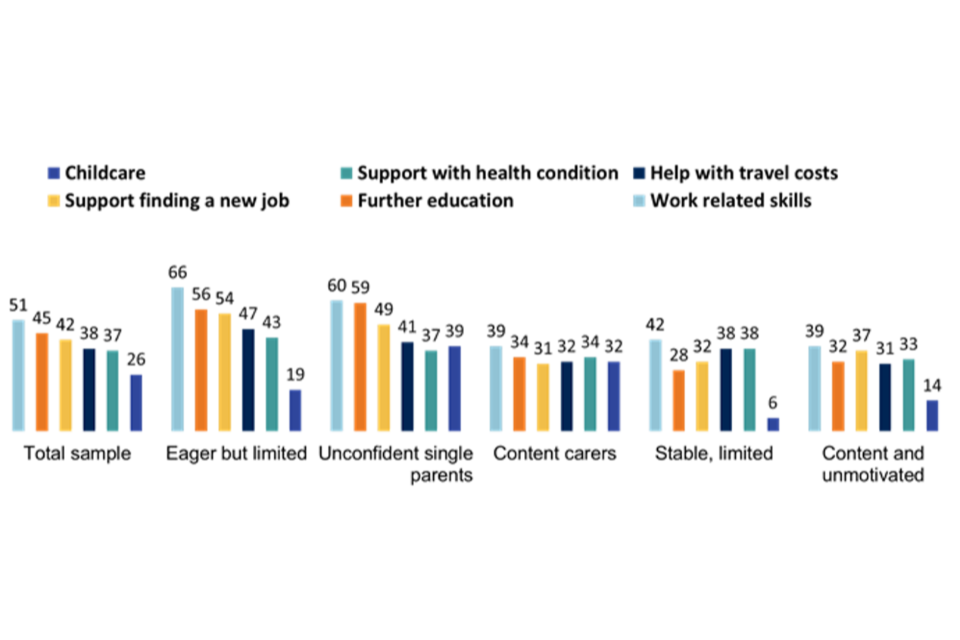
" "
4.2. Qualitative findings
The qualitative research explored participants’ responses to different hypothetical support options to help them progress in work.
Four hypothetical support options were presented to participants:
- Progression Coach: Regular face-to-face meetings with a dedicated “progression coach”. Firstly, your coach would establish what your needs are, followed by support to address needs and achieve your goals. This includes providing guidance and encouragement around speaking to your line manager or employer about progression; identifying jobs with better progression opportunities; and referral to registered training to improve your skills. The aim of this would be to support people to get further in current job or get new job with better opportunities. It would take place at your local Jobcentre Plus.
- Skills Action Plan: One initial face-to-face meeting with progression advisor, followed by online support. This would include developing your personal learning or skills plan, with guidance on relevant training courses. You would be given a personal budget to spend on training and any associated costs. You would be responsible for enrolling on courses and attending training. The aim of this would be to provide guidance and financial assistance for people to address skills needs, to support them to progress in work. This would be supplied by an employment agency.
- Work and Family Support: Online communication with an advisor, supporting participants to conduct a personal and family needs assessment. Establishes what support is needed in work and household, and provides referrals to appropriate support (e.g. training, financial or debt advice, housing advice, childcare or caring support). You would then be given a personal budget to spend on training, transport, and childcare. The aim of this would be to address personal and household factors which may influence people’s ability to progress in work. A charity would provide this service.
- In-Work Training: Training and skills development provided by external suppliers and organised through your current employer. You would be able to access courses relevant to your personal or career development and given time off to attend. You would work with your current line manager to identify relevant courses and develop personal development plan. Small cash bonuses are paid to employees that complete each course. The aim of this would be to support people to get further in their current job. Your current employer or a registered training provider would provide this service.
These hypothetical support options were then used as a starting point to consider the different elements (provider; content; mode and frequency) of any future support option to establish how interventions can be designed to appeal to and best support participants. The discussion found that the type of intervention which best suited participants depended on their needs and attitudes towards progression.
The rest of this chapter explores the themes which influenced how participants responded to the support options and which types of support are most appropriate for different types of claimant.
4.2.1. Themes affecting responses to support preferences
The following themes affected participants’ attitudes towards support:
Perceived need for support and motivation to progress
As shown in section 3.2, a range of factors affected attitudes towards progression including care responsibilities, high job satisfaction, health, confidence and the perception that they may be worse off financially due to becoming ineligible for benefits. Participants who were content with their current position reported little need for, or interest in, support as they had little desire or motivation to progress. For these claimants, building motivation to progress would be the first step to encouraging them to take up support. Those who were less content with their current job or circumstances were more open to support to progress. Goal-setting could help support motivation to progress for these claimants. Participants who had clear and achievable goals were more motivated to progress to achieve them than those who did not.
Yes, I am happy, it’s the first job that I’ve been in that I’m enjoying my job role and every day challenge, and I like it. I’m not looking to better myself, I’m not looking to move in any direction, I’m just happy where I am.
Female, 25 to 44
Complex needs
Participants with additional, or complex needs, including caring for a family member or debt welcomed holistic support options. They felt that work and progression needed to be viewed in the context of their wider life circumstances and that support with some of the wider challenges they faced would put them in a better position to progress. Those with complex needs who saw little need to progress in work were more likely to be open to holistic support than support which more overtly focused on progression.
Ultimately if there were social and educational support for [their son] we’d be working.
Male, 45 to 54
Perceptions of progression opportunities with current employer
Participants who could see a clear route for progression, which appealed to them, with their current employer were particularly open to support to from them. However, participants who did not perceive that there were opportunities to progress with their employer, or who felt that the opportunities with their employer did not appeal to them were less interested in this type of support.
I wouldn’t want to be a manager. I wouldn’t want that responsibility. I don’t think being in a high-powered job would be very good for me.
Female, 55 to 60
Prior experiences, either first or second hand, of support
Prior experience strongly shaped participant perceptions of the support options. Participants who had good experiences with a service were happy to return. However, negative experiences, or hearing about the negative experiences of others, acted as a deterrent to taking support up. This was particularly the case with JCP.
Personally, it’s a bit degrading going there, in the sense that if you get seen there then you are known as not having a lot of money. Majority of people that go there don’t want to work. I don’t want to be like the people that go there.
Female, 45 to 54
Existing skills and qualifications
Those with lower skills levels or qualifications were more open to skills-based support which could enhance their qualifications. On the other hand, individuals with higher qualifications were more specific about the support they needed, for example, a certain qualification was required in order to go further in work.
4.2.2. Support preferences
Preferences for support were dependent on current life circumstances, job, skills and attitudes towards progression (see Figure 4.6). There was a clear relationship between the type of support, how participants wanted to receive this and the preferred provider and frequency. The following section covers this, starting with those with more intensive support needs.
Figure 4.6 Overview of support needs
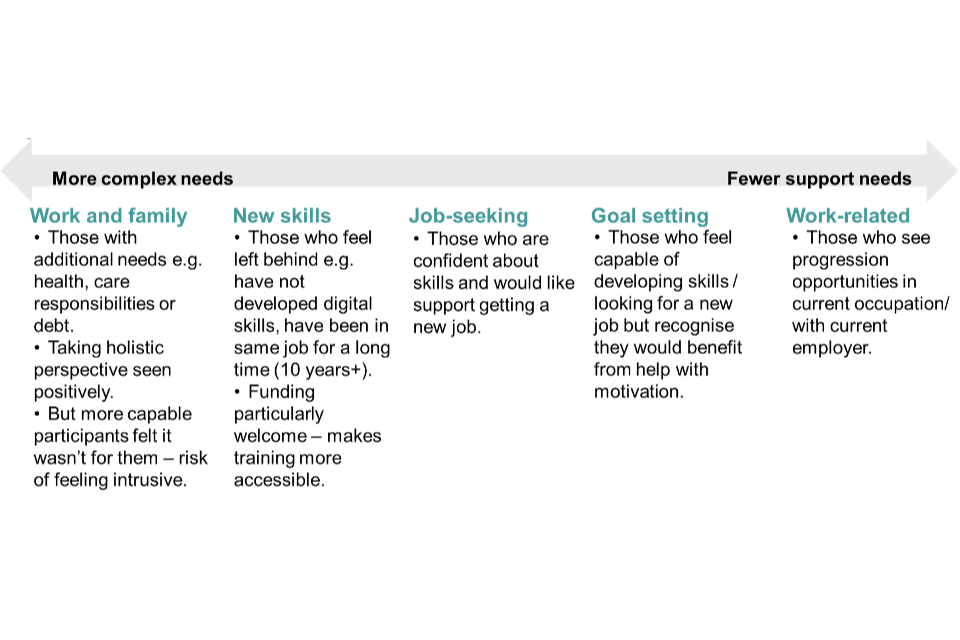
" "
Work and family support
Support which took a holistic perspective of the participants’ life circumstances and included funding for childcare, social care or debt support was preferred by participants with complex needs, for example relating to their health, debt or family circumstances. Personal debt, and help managing this, was a particularly strong theme among participants who were open to holistic support.
Taking a more rounded view of their lives was viewed positively, providing help to overcome the complex obstacles they faced to the point where they felt able to consider progression. However, participants without these challenges saw this type of support as unnecessary.
For example, a couple whose eldest son has severe autism said they were keen to progress but first wanted to ensure their son’s social and educational needs would be met. This included not only a school place, but additional support for travel, care and support for the family as well. The mother used to be an occupational therapist but now works as a teaching assistant and is currently the main earner since the father stopped his economic consultancy business to care for their son full-time. They said they had skills and experience that they were unable to use as they had to put their son’s needs first. They expected that getting the desired support for their son would reduce the stress felt by the family and they would not have to worry about money because they could return to full-time work.
Charities were seen as an appropriate provider for this type of support. They were viewed as a trustworthy source which would act in the individual’s best interest. Participants who had received this type of support in the past referred to it positively. For example, one individual who was a lone parent and had been in debt had used a debt charity, who helped her arrange a debt repayment plan. Until she received this support, concern about how changes to her work would affect her financial position had limited her willingness to explore progression or change job.
They’re not trying to get you to sign up because they’re going to get a cut in it, or anything like that.
Female, under 45
Participants felt that this support would need to be provided flexibly, possibly starting more frequently (weekly or fortnightly) then tapering off with an option for ad hoc meetings. It was important that they had time to consider and take any actions between meetings, whilst receiving support to keep them on course.
For example, one single mother with 2 young children had a health condition and also personal debt. She was working as an assistant in a nursery and also studying to become a counsellor. She found the compound challenges of managing her health condition, debt, study, work and childcare challenging and was receptive to support to help her with this.
Face-to-face contact was preferred for this type of intensive and personal support, but participants noted this could become difficult to fit in around work so telephone contact would also be appropriate for follow-up sessions. Online was not seen as an appropriate mode for this support as it was not perceived to be very personalised.
Skills development
This type of support appealed to participants who felt that they needed to improve their skills in order to progress in work. This included those who wanted to look for opportunities in a new sector. Funding for training was particularly welcome. Participants lacking experience in an area they wanted to move in to were enthusiastic about the idea of apprenticeships and work experience as they felt this would make them more attractive to employers.
Why can’t you get some experience, like visiting a hospital for a day … be realistic about what they are doing to do [on the job]?
Female, 45 to 54
Participants with lower skills felt JCP could be an appropriate place to develop basic skills. Those with higher qualifications or who were more highly skilled were more reluctant to use JCP as they weren’t confident that they would get appropriate levels of support.
It would have to be tailored to me. Not ‘oh we’re doing Microsoft Office’ and they show you how to type. I’m beyond mail merge, I’m beyond a lot of stuff and I need something that will stimulate me.
Female, 55 to 60
In addition, there was a strong association with JCP as a place for unemployed people rather than a place where people already in work could access support. This view was held particularly strongly by people who had used JCP to get into work in the past and who felt that using this service now did not fit with their identity as someone who was working. For these reasons, an accredited training organisation may be more appropriate for support with more advanced skills.
Participants felt that online support was appropriate for accessing education and learning and hard skills, rather than soft skills which were seen as being best delivered in person. One exception to this was that participants with low digital capability or confidence, or those with limited or no internet access, felt that they would need in-person support to help improve their digital skills before they were able to properly engage with and use online support. Online support was seen as highly self-directed and lacking personal encouragement and engagement. It was therefore seen as more suitable for those who were already motivated to learn and progress. Providing ongoing interaction with a trainer through online channels could help address this and reduce the risk of drop out.
Initially face-to-face because there needs to be someone who understands what you’re saying as opposed to just typing something into a computer … after that online is fine, but there is still going to need to be a human element to keep you on track and for the encouragement.
Female, under 35
Weekly or fortnightly contact was preferred for support relating to specific skills development, for example IT skills so that participants were able to keep building on this and not forget between sessions. Participants who had less confidence in their ability to progress also expressed a preference for more frequent support to help address this.
Job-seeking support
Participants who were confident in their work-related skills and were motivated to progress by moving job wanted support to with CV writing, interview skills and job-seeking.
As with the skills support, participants with lower skills were more open to visiting the JCP to receive this type of support, although the perception of JCP as a place for people out of work still holds. Those with higher skills were more reluctant to visit JCP and were less likely to see it as appropriate. For these reasons an employment agency was seen as the most appropriate provider of job-seeking support. Positive past experiences meant that participants were more open towards this form of support. These participants felt that employment agencies would be proactive in finding them a new role which was tailored to their interests and skills. Participants also believed that these agencies would know what employers were looking for, giving them more chance of securing a job.
You will go in [JCP] and you say you’ve got certain skills, they will find jobs that aren’t even relevant … they don’t understand what they are.
Female, 45 to 54
Face-to-face support was seen as the best way to help participants develop these softer skills. Online support was seen as generic and not suited to receiving personalised advice or helping participants develop soft skills, and this type of support was seen as needing to be highly personal and tailored. Participants felt that this type of support may need to be provided intensively such as weekly or fortnightly at first as they prepared their CV, for example. However, they were also aware that when looking for a job, there may not be significant developments from week to week and so less frequent contact, such as monthly, may then be more appropriate.
Work-related support
Participants who were satisfied with their current job and could see, and wanted to take up, progression opportunities with their current employer found the idea of work- related support most appealing. Particular benefits of this type of support were that it would be directly relevant to their current role and in their field of interest.
Participants who were dissatisfied with their current employer, or whose role did not have a clear progression path did not think support from their current employer would be relevant to them.
They wouldn’t help you in any shape or form to progress, really. I’m just saying that this wouldn’t apply to my workplace, because I know that they wouldn’t do any of this
Female, over 35
Participants who were already receiving training by accredited providers through their work spoke positively of the experience and felt that it reflected well on their employer, and that they felt more engaged with their work and more loyal and positively towards their employer.
You are getting time off but they would not cut your pay … you are still getting paid but you are able to go and make progress.
Female, under 35
Participants felt that this type of support would take place through a combination of face to face and online methods, depending on the exact content of support. There was also a perception that this type of support would fit with their existing schedule, for example, it would not involve them needing to attend training elsewhere, outside of their working hours. This was particularly attractive to those with parental or care responsibilities.
5. Conclusions
In this chapter we summarise the main findings and implications of the research.
The majority of the future cohort are female (77%) and are parents (70%), with single parents making up half of the overall group (51%). The remaining 3 in 10 are couples and single adults without dependent children. One in seven of the future cohort (15%) care for another adult and over a quarter (27%) report having a health condition or disability that limits their day-to-day activity.
The combination of caring responsibilities and long-term health conditions and disabilities means that many future cohort members are working in jobs that fit around their family commitments and pre-existing health conditions. They work on average 20.75 hours per week, often in stable jobs with the security of a permanent employment contract (77%). Four in ten have been in their current job for over 5 years, including 22% for over 10 years.
The majority are satisfied with their job, particularly the number of hours they work (79%), and whilst they would like to earn more (72%), this would not be at the expense of working more hours or leaving their current job. This is emphasised among parents with young children. Indeed, there is evidence that future cohort parents will naturally take steps to progress in work once their youngest child is older. The survey data shows average earnings increase in line with the age of the youngest child. Some parents of younger children are already taking steps to give themselves the best chance to progress by enrolling on training and speaking to their employer about progression opportunities. Others, with older children, are committed to progress as soon as possible.
The picture is more complex for those without dependent children. This group is older (mean age of 47.5 compared to 45 for all future cohort members), more likely to report having a long-term health condition or disability, and more likely to have been in their current job for over 5 years. They are resistant to change for a range of reasons: because they are happy with their work-life balance and have no wish to work more hours; their current job is optimal for their health condition and disability; and they are unable to progress because they lack the qualifications and skills employers want. However, similar to those with children, there is a group of younger single adults and couples who are keen to progress in work immediately.
The segmentation analysis illustrates the diversity of the future cohort in terms of their motivations and preparedness for in-work progression. At the simplest level, they are evenly split between those motivated to progress, albeit with some support, and those that have become ‘stuck’ in the status quo, requiring both practical and motivational support.
The 5 segments and their support needs are as follow:
- 17% of the future cohort are “Keen to progress”. This group is the most dissatisfied with their job and want to find a job with more hours and pay. They are more likely than other segments to be in precarious jobs including zero-hours contracts, and the large majority are struggling with their bills. They are younger and the majority have a partner. A third are from an ethnic minority or have English as a second language – the highest of the segments. Though they are the most highly educated segment, they are also more likely than others to feel they need to improve their skills and qualifications before they can get further at work
- 33% of the future cohort are “Motivated but cautious” – the largest of the segments. All members in this group are single parents, and the majority struggle with their bills and want to progress to increase their hours and earnings. However, they are concerned that changes to their work may disrupt their caring responsibilities without making them financially better-off. Like the “Keen to progress” segment, members of this segment tend to be younger and better educated than the future cohort overall. However, they are currently doing mainly low-skilled jobs with limited opportunities for progression. They feel they need to develop their skills and qualifications further to increase their chance of getting a new and well-paid job. They too would benefit from information provision around the financial benefits of progressing
- 22% of the future cohort are in the “Care-focused” segment. Members of this segment are focused on their caring responsibilities and do not want to do anything that would disrupt this commitment. This group comprises mainly younger parents and a quarter also have caring responsibilities for an adult. This group will need support to motivate them to progress. As part of this, they will need support and reassurance that their caring responsibilities will not be negatively affected
- 12% of the future cohort are in the “Stable but stuck” segment. Members of this group are the least satisfied with their job but are reluctant to make a change. They are negative about working more hours and have taken the least action to progress in the past 12 months. Many have been in their current, mainly low-skilled, job for a long period of time and are uninterested in acquiring new skills. This group will require support to improve both to their skills and motivations to progress. Because they have been in the same low-skilled jobs for a long time, job preparation skills will be key to helping them find the right job
- 16% of the future cohort are “Stable and content”. Members of this segment have been in their job for a relatively long time because they enjoy it. There is limited appetite to change job or increase their hours in order to earn more (they are least likely of all the segments to say they struggle with their bills). This group will require support to address their lack of motivation to progress, training to update their skills and support to find and apply for jobs
6. Appendix
Appendix 1: Technical details
This section sets out the design of the quantitative survey and qualitative research.
Quantitative surveys
Questionnaire development
The questionnaire was piloted with 11 participants to test comprehension, following this, questions were tweaked accordingly. The questionnaire was then piloted to test the questionnaire on a wider scale; this illustrated that the questions worked well and that respondents were generally happy to take part.
Sample design
Quantitative research comprised a survey of claimants who were in work and in receipt of one or more of: Housing Benefit, Child Tax Credits or Working Tax Credits and whose earnings were between the AET and CET. Tax credit claimants were selected from HMRC’s claimant database and Housing Benefit claimants from DWP’s claimant database[footnote 18]. The sample was selected to be representative of DWP’s forecast for the future cohort in December 2023 (in terms of household composition, earnings and benefit type, detailed in the table below).
Table A1.1: Projected future cohort caseload
Household type – single:
| Benefit group | No Children | Children |
|---|---|---|
| WTC & CTC | 5% | 24% |
| CTC only | 1% | 1% |
| WTC only | 7% | 0% |
| HB only | 8% | 0% |
Household type – couple:
| Benefit group | No Children | Children |
|---|---|---|
| WTC & CTC | 2% | 18% |
| CTC only | 2% | 16% |
| WTC only | 6% | 0% |
| HB only | 8% | 2% |
Once the sample was cleaned for ‘bad’ numbers and data errors, individuals were sent an advance letter. The advance letter detailed the research and gave the recipient the option to opt-out of the research.
The survey took place between the 24 April to 30 September 2019.
Interviewing was conducting using Computer Assisted Telephone Interviewing (CATI). The survey took 30 minutes, on average, to complete.
Sample outcomes
Table A1.2: Sample outcomes for the quantitative survey
| Completes | 4,808 |
|---|---|
| Appointments | 222 |
| Screened out | 3,010 |
| Refusals | 10,188 |
| Quit interview | 619 |
| Still dialling - outcome unknown | 1,581 |
| Max tries | 541 |
| Total valid sample | 20,969 |
| Eligibility rate | 61% |
| Total eligible sample | 14,747 |
| Adjusted response rate (as % of eligible sample) | 33% |
The low adjusted response rate is due to the sensitivity of respondents to the survey topic. The survey length also acted as a barrier to participation. Considering this for future surveys and reflecting it in the design may help to improve the response rate. Full details in Table A1.2.
Weighting
The survey data was first weighted by gender, combined with age, then by whether or not they had children. The weighted and unweighted profiles are shown in Table A1.3.
Table A1.3: Weighted and unweighted profiles for the quantitative survey
a. Weighted profile
| 16 to 24 | 25 to 49 | 50+ | Total | |
|---|---|---|---|---|
| Female | 3% | 54% | 13% | 69% |
| Male | 1% | 22% | 8% | 31% |
| Total | 4% | 75% | 21% | 100% |
| No children | 19% |
|---|---|
| Children | 81% |
| Total | 100% |
b. Unweighted
| 16 to 24 | 25 to 49 | 50+ | Total | |
|---|---|---|---|---|
| Female | 1% | 43% | 34% | 79% |
| Male | 0% | 11% | 11% | 22% |
| Total | 1% | 53% | 45% | 100% |
| No children | 49% |
|---|---|
| Children | 51% |
| Total | 100% |
Segmentation: Latent Class Analysis
Latent class analysis (LCA) is a statistical segmentation technique which classifies individuals into unobserved classes. The segmentation analysis produced 5 discrete groups of the future cohort claimants, based on their attitudes, behaviour and capability with respect to in-work progression. In essence, LCA is a way of looking at commonly reported combinations of responses to questions. These combinations are called ‘latent classes’. Where respondents choose common combinations of options these reveal a ‘latent class’ which distinguishes the respondents defined by this class from respondents defined by another class representing a different pattern of chosen options.
The approach calculates the probability that each response option then belongs to each underlying latent class category and predicts membership of the latent class categories using these predicted probabilities. The latent class model is used to predict the frequency of the responses to each permutation of the observed variables from the question.
A goodness of fit (GoF) statistic is then calculated through comparing the observed and predicted frequency distributions across the response options. There is no absolute measure of the ‘correct’ number of categories in the best fitting latent class model. Because of this, it is necessary to compare the GoF for each model that is run. The number of categories may vary substantially, and it is then a case of repeating the analysis to indicate the appropriate number of categories to provide the best fitting models. Each question for which LCA was conducted is listed below.
i. Q5 – Household composition
ii. Q5b – Age of youngest child
iii. Q15 – Length of time in current job
iv. Q20 – Thinking about your job, why do you do this job? (Grouped into personal reasons and employer/company related reasons)
v. Q21 – Thinking about your job, how satisfied or dissatisfied are you with…?
vi. Q22 – Which, if any, of the following have you done in the past 12 months? (Grouped into, ‘has taken action’ and ‘has not taken action’)
vii. Q23 – Overall, over the next 12 months, how important is it for you to…?
viii. Q24 – To what extent do you agree or disagree with the following statements?
ix. Q25 – And, to what extent do you agree or disagree with these statements?
x. Q26 (MAX DIFF) – Which of the follow are most and least important in encouraging you to progress in work?
xi. Q27/Q28 – Is there anything that makes it difficult for you to progress in your current job / get a new job with better progression opportunities? (Grouped into employment, external, financial and personal barriers)
xii. Q29 – Would any of these help make it easier for you to progress in work? (None of these)
xiii. Q31 – Which of the following describes your partner’s main employment status at the moment?
Qualitative methodology
This section provides more detail on the qualitative methodology.
Tool Development
Both the depth and paired interviews and focus groups were guided by a topic guide. The topic guides were developed in discussion with the DWP and were designed to reflect the aims and objectives of the study. The topic guide used for the depth interviews consisted of 3 versions; individuals, couples and influencers.
Depth interviews
The study comprised a total of 60 depth interviews (37 individual depths and 23 paired depths) (full breakdown in Table A1.4). Participants were purposively recruited from those who had completed the quantitative survey.
Paired interviews were held between the main participants and their partner or another close family member. All lead participants were in work at the time of the interview. Participants were purposively selected from the survey sample to ensure a broad spread of age, gender, ethnicity and educational qualifications as well as diversity of employment history such as length of time in role and contract type.
Fieldwork took place in a number of locations across England, Wales and Scotland between the 10 September and 15 October 2019.
Table A1.4: Sample breakdown of the depth interviews
| Age | Participants |
|---|---|
| 18 to 34 | 7 |
| 35 to 44 | 18 |
| 45 to 54 | 23 |
| 55+ | 12 |
| Gender | Participants |
|---|---|
| Male | 17 |
| Female | 43 |
| Length of time in role | Participants |
|---|---|
| Less than one year | 9 |
| 1 to 3 years | 13 |
| 3 to 5 years | 15 |
| 5 to 10 years | 13 |
| 10 years or more | 10 |
| Employment | Participants |
|---|---|
| More than one job | 7 |
Focus groups
Eleven focus groups were held; 3 in London, 2 in Manchester, 2 in Leeds, 2 in Glasgow and 2 in Birmingham. Each focus group consisted of between 2 and 6 people (39 participants in total) (see Table A1.5). As with the in-depth interviews, participants were screened to ensure they were in work and in receipt of tax credits and/or Housing Benefit. Quotas were also set to ensure a good representation by age and gender.
Fieldwork took place between the 15 October and 24 October 2019.
Table A1.5: Sample breakdown of the focus groups
| Age | Participants |
|---|---|
| 25 to 34 | 10 |
| 35 to 44 | 14 |
| 45 to 54 | 11 |
| 55 to 60 | 2 |
| 61 to 64 | 2 |
| Gender | Participants |
|---|---|
| Male | 8 |
| Female | 31 |
Data management and analysis approach
Interviews and focus groups were all recorded (with informed consent being gained from respondents) using encrypted digital recorders in line with data protection. Recordings were either transcribed verbatim or researchers wrote detailed notes, listening back to recordings to ensure no data was lost.
The data collected from the qualitative research was entered into an analysis grid in Microsoft Excel, used as the basis for thematic analysis. The analysis grid grouped the findings from the interviews into themes, based around the study objectives and those which emerged through analysis. In addition, analysis considered similarities and differences among different subgroups such as age, gender, rural and urban locations, and segment.
Please note: qualitative research is used to map the range and diversity of different type of experiences rather than indicate the prevalence of any one particular experience; as such numerical language is not used and findings are not aimed to be statistically representative.
Appendix 2: Research materials
Quantitative survey
S SCREENER
ASK PERSON WHO ANSWERS PHONE
S1 Good morning / afternoon / evening. My name is [NAME] and I’m calling from Ipsos MORI on behalf of the Department for Work and Pensions (DWP) [IF TC SAMPLE = and Her Majesty’s Revenue and Customs (HMRC)]. Please can I speak to [NAME FROM SAMPLE]?
ADD IF NECESSARY: We are conducting some research on behalf of the DWP that we hoped [NAME FROM SAMPLE] could spare some time to help us with.
| Respondent answers phone | 1 | Continue |
| Transferred to respondent | 2 | Continue |
| Hard appointment | 3 | Make appointment |
| Soft Appointment | 4 | Make appointment |
| Refusal | 5 | Make appointment |
| Not available in deadline | 6 | Close |
| Engaged | 7 | Close |
| Fax Line | 8 | Close |
| No reply / Answer phone | 9 | Close |
| Business Number | 10 | Close |
| Dead line | 11 | Close |
S2 Your contact details were provided by If DWP SAMPLE: [The Department for Work and Pensions], ELSE [Her Majesty’s Customs and Revenue – HMRC – and the Department for Work and Pensions]. This research aims to understand your experiences of work to inform the design of services to help people to earn more and increase their skills.
You should have received a letter from DWP and HMRC about this research. This research will be conducted in accordance to the MRS code of conduct. It should take between 20 to 25 minutes and your responses will be kept completely confidential. It will not be possible for anyone to identify you when we report the research findings.
If you would like to read Ipsos MORI’s privacy policy beforehand you can access it online at Ipsos MORI’s privacy policy.
ADD IF NECESSARY:
- we are interested in your views because you are working and claiming tax credits and/or other types of benefits, and DWP wants to know how it can support people like you in the future when working age benefits are replaced by Universal Credit
- your name has been chosen at random from a list of HMRC and DWP customers
- your participation in this research is entirely voluntary and your information or anything you tell us won’t affect any claims or future dealings with DWP or HMRC
- the privacy policy explains the purposes for processing your personal data as well as your rights under data protection regulations to access your personal data, withdraw consent, object to processing of your personal data and other required information
- if respondent wishes to confirm validity of survey or get more information about aims and objectives, they can call:
- MRS: Market Research Society on 0500396999
- Ipsos MORI: [Yasmin White]: 020 3059 5152
Is now a good time to speak to you about this research?
| Continue | CONTINUE | |
| Referred to someone else in household (must be named respondent on sample) NAME: |
1 | TRANSFER AND RE-INTRODUCE |
| Hard appointment | 2 | MAKE APPOINTMENT |
| Soft appointment | 3 | MAKE APPOINTMENT |
| Refusal | 4 | THANK AND CLOSE |
| Refusal – taken part in recent survey | 5 | THANK AND CLOSE |
S2aa Before we start, I just want to clarify that participation in the survey is voluntary and you can change your mind at any time. We will retain your contact details for quality control purposes and this data will be destroyed by the end of March 2020. Are you happy to proceed with the interview?
IF NECESSARY: If you would like to read the Privacy Notice beforehand you can access it online at Privacy Notice.
| Yes | 1 | CONTINUE TO S3 |
| No | 2 | SCREEN OUT |
S3 This call may be recorded for quality and training purposes only.
A CONTEXTUAL INFORMATION
Firstly, I’d like to ask you a few questions about you and your household.
ASK ALL
Q1. Are you claiming any of the following?
READ OUT
MULTICODE OK
| Working Tax Credits | 1 | |
| Child Tax Credits | 2 | |
| Housing Benefit | 3 | |
| None of these | 4 | SCREEN OUT |
| Don’t know | SCREEN OUT | |
| Refused | SCREEN OUT |
SOFT CHECK AGAINST SAMPLE IF PARTICIPANT SAYS THEY ARE / NOT CLAIMING A BENEFIT WE HAVE THEM RECORDED AS CLAIMING.
ASK ALL
Q2. Are you claiming any other benefits?
DO NOT READ OUT. MULTICODE OK
| Carer’s Allowance | 1 | |
| Child Benefit | 2 | |
| Council Tax Benefit | 3 | |
| Disability Living Allowance | 4 | |
| Employment Support Allowance | 5 | |
| Income Support | 6 | |
| Maternity Allowance | 7 | |
| Personal Independence Payments (PIP) | 8 | |
| Support for Mortgage Interest | 9 | |
| Job Seekers Allowance | 10 | |
| Something else (specify) | 11 | |
| None of these (Exclusive) | 12 |
ASK ALL
Q3 Which of the following describes your current employment status? You can give more than one answer.
READ OUT. MULTI CODE.
| Self-employed [IF NECESSARY: Working for yourself as a freelancer, contractor, or the owner of your own business] | 1 | |
| Working for an employer in paid employment | 2 | |
| Not working in paid employment [EXCLUSIVE] | 3 | THANK AND CLOSE |
IF CODE 1 ONLY AT Q3 – THANK AND CLOSE
ASK ALL WHO CODE 1 +2 AT Q3
Q4 And which of these is your main job, that is the one where you earn the most money?
DO NOT read out. SINGLE CODE.
| Self-employment | 1 | THANK AND CLOSE |
| Working for an employer | 2 |
ASK ALL
Q5. Which of these describes your living situation?
READ OUT. MULTI CODE.
| Living alone | 1 |
| Living with partner | 2 |
| Living with spouse / civil partner | 3 |
| Living with parents | 4 |
| Living with friends / other adults / siblings (i.e. not parents) | 5 |
| Living with dependent children (under the age of 16, or under the age of 20 and still in full-time education or training, below University or equivalent level) | 6 |
ASK ALL WHO HAVE CHILDREN (Q3 = CODE 6)
Q5a. How many children do you have?
WRITE IN:
ASK ALL WHO HAVE CHILDREN (Q3 = CODE 6)
Q5b. How old are they?
DO NOT READ OUT. MULTI CODE.
| Child 1 | ENTER AGE |
| Child 2 | ENTER AGE |
| Child 3 | ENTER AGE |
| Child 4 | ENTER AGE |
ASK ALL WHO HAVE CHILDREN UNDER THE AGE OF 16 (Q5b)
Q6. Do you use any of the following types of childcare for [your child/any of your children]?
READ OUT. MULTI CODE
| Nursery, playgroup or pre-school including reception class or nursery for children with special educational needs | 1 |
| Breakfast club or after school clubs / activities | 2 |
| Holiday club or scheme | 3 |
| My ex-husband/wife/partner (the child’s other parent who does not live in this household) | 4 |
| Family member e.g. the child’s grandparents, older sibling or other relative | 5 |
| Friend or neighbour | 6 |
| Childminder / nanny / au pair in our home or somewhere else | 7 |
| Other (specify) | 8 |
| No, cared for by me [or me and my partner] | 9 |
ASK ALL
Q8. [IF Q5=CODE 6: Aside from your children, do you have any other caring responsibilities] Do you have any caring responsibilities?
[IF NECESSARY: By caring responsibilities we mean caring for anyone who needs help with everyday life due to illness, disability or old age. This could include; help with grocery shopping, bathing, dressing, laundry]
READ OUT. MULTI CODE
| No [SINGLE CODE] | 1 |
| Yes – for my Spouse / Civil Partner/ Partner | 2 |
| Yes – for my Parent(s) | 3 |
| Yes – for another family member | 4 |
| Yes – for a friend | 5 |
B EMPLOYMENT
Now I’d like to move on and talk a little bit more about your experiences of work.
ASK ALL
Q9. How many separate jobs do you currently have (ADD IF SELF EMPLOYED: including your self-employment)?
NOTE IF NECESSARY: If you work at a lot of different places but are paid by one organisation/ agency please count this as one job.
| ENTER NUMBER OF PAID JOBS | |
| Don’t know | 2 |
| Refused | 3 |
ASK ALL WITH MORE THAN ONE JOB (Q9 >1)
Q10. Why do you have more than one job?
MULTICODE. READ OUT.
| You can’t get enough hours in one job | 1 | |
| Jobs don’t pay enough to have one | 2 | |
| Like the variety | 3 | |
| Need / want the flexibility | 4 | |
| Other (specify) | 5 | |
| Don’t know | 6 | |
| Refused | 7 |
ASK ALL
Q11 How many hours a week do you normally spend in work in total? Please include any regular overtime you work.
If you travel for your job please only include the hours you are paid for.
IF NECESSARY: If you work irregular hours, please try and think back to the average number of hours you worked a week in the past month.
PROBE FOR BEST ESTIMATE
| a) [Only read out if they have more than one job] In your main job – that is the one where you earn the most money | ENTER NUMBER OF HOURS | ||
| b) [Only read out AND CODE if they have more than one job] In any other jobs (in total) | ENTER NUMBER OF HOURS | ||
| Don’t know | 2 | ||
| Refused | 3 |
IF DON’T KNOW OR REFUSED (CODES 2-3) AT Q11
Q11c/d Would it be…?
READ OUT. SINGLE CODE.
DP – AUTOMATICALLY CODE ALL RESPONSES TO RANGE
| Less than 5 hours | 1 | |
| 6 to 10 hours | 2 | |
| 11 to 15 hours | 3 | |
| 16 to 20 hours | 4 | |
| 21 to 25 hours | 5 | |
| 26 to 30 hours | 6 | |
| 31 to 35 hours | 7 | |
| 36 to 40 hours | 8 | |
| Over 40 hours | 9 | |
| Do not Know | 10 |
ASK ALL WITH MORE THAN ONE JOB (Q9 = >1)
Read out:
Please answer the following questions for your main job, that is the one where you earn the most money. INTERVIEWER NOTE: We are interested in the job that brings home the most money rather than the one with the highest hourly pay.
ASK ALL
Q13. What is your job title? IF UNSURE: what are your main duties?
DO NOT READ OUT. CODE TO LIST. IF UNABLE TO CODE, WRITE IN JOB TITLE AND BRIEF DESCRIPTION OF DUTIES UNDER “OTHER SPECIFY”.
| Call handler / call centre operator/ customer services advisor | 1 | |
| Care assistant | 2 | |
| Cashier / check out operator/ sales assistant | 3 | |
| Catering assistant | 4 | |
| Cleaner | 5 | |
| Data Entry clerk / filing clerk | 6 | |
| Groundskeeper / grounds maintenance / gardener | 7 | |
| Hairdresser/ beautician | 8 | |
| Labourer | 9 | |
| Security guard / Doorman / Bouncer | 10 | |
| Support worker | 11 | |
| Warehouse operative / picker / packer | 12 | |
| Other (specify) | 13 | |
| Don’t know/ can’t remember | 14 |
ASK ALL
Q14. And what does your employer mainly make or do?
DO NOT READ OUT. CODE TO LIST OR WRITE IN UNDER OTHER SPECIFY.
| Bank / building society/ financial services | 1 | |
| Car maintenance / garage | 2 | |
| Cleaning company | 3 | |
| Construction | 4 | |
| Food production / manufacture | 5 | |
| Hairdressing/ beautician services | 6 | |
| Hospital/ other health services (eg GP surgery) | 7 | |
| Nursery/ other childcare (not school) | 8 | |
| Restaurant/ hotel/ other food and accommodation services | 9 | |
| Retail (clothes, supermarket, department store etc) | 10 | |
| School / College | 11 | |
| Security | 12 | |
| Social care | 13 | |
| Warehousing / distribution / delivery | 14 | |
| Other (specify) | 15 | |
| Don’t know/ can’t remember | 16 |
Q15. How long have you been doing this job?
DO NOT READ OUT. PROMPT IF NEEDED. SINGLE CODE.
| Less than 1 month | 1 |
| 1 to 6 months | 2 |
| 6 months to 1 year | 3 |
| 1 to 3 years | 4 |
| 3 to 5 years | 5 |
| 5 to 10 years | 6 |
| Over 10 years | 7 |
| Prefer not to say | 8 |
ASK ALL
Q16. Which of the following best describes your contract or status?
READ OUT. SINGLE CODE.
| A permanent or temporary zero hours’ contract/job with no specified minimum number of hours each week | |
| A permanent or open ended job/contract with a fixed or minimum number of hours per week | |
| A temporary/fixed term or seasonal contract with a specified end date and regular or minimum number of hours | |
| Something else (specify) |
ASK ALL
Q17. Which of the following best describes the time you have spent doing paid work since leaving education?
Please think about the paid work you have done as either an employed or self-employed person.
READ OUT SINGLE CODE.
| Spent most of my time not working | 1 |
| Spent about as much time working as not working | 2 |
| Worked solidly with one or two breaks | 3 |
| Worked solidly without a break | 4 |
ASK ALL WITH BREAKS IN EMPLOYMENT [CODE Q17 = 1-3]
Q18. Why did you, most recently, take a break from employment?
DO NOT READ OUT. MULTI CODE.
| Taken maternity / paternity leave | 1 |
| Been made redundant | 2 |
| Been dismissed or fired | 3 |
| Taken time off to care for a family member, including children, or friend | 4 |
| Taken time off to re-train or get new qualifications | 5 |
| Taken time off for health reasons | 6 |
| Contract came to an end | 7 |
| Left previous employer voluntarily, without another job to go to | 8 |
| Time in prison / criminal conviction | 9 |
| Other reasons (please specify) | 10 |
| Don’t know | 11 |
| Prefer not to say | 12 |
C ATTITUDES TO WORK AND PROGRESSION
ASK ALL
Q20 Thinking about your job [IF MORE THAN ONE JOB: main job – the one you earn the most money], why do you do this job?
If needed: why do you do this job rather than a different one?
Probe fully: Any other reasons?
DO NOT READ OUT. MULTICODE
| Good work/life balance | 1 |
| Fits around unpaid work/studying | 2 |
| [If children, Q5=6] Fits with my childcare responsibilities | 3 |
| [If caring for someone, Q8=1-4] Fits around my caring responsibilities (other than childcare) | 4 |
| Health-related reasons | 5 |
| Right skills / experience | 6 |
| Accessible/ close to home | 7 |
| Been there a long time | 8 |
| Enjoy the work / working with that team | 9 |
| Company values me | 10 |
| Flexible working | 11 |
| Provides opportunities for me to build my skills | 12 |
| Only job I could find | 13 |
| Security / stability | 14 |
| Pay is good / the hours offer the money I need to support myself financially | 15 |
| The hours allow me to qualify for tax credits or benefits | 16 |
| Other (please specify) | 17 |
| Don’t know | 18 |
ASK ALL
Q21. Thinking about your job [If more than one job: Thinking now about your main job, that is the one in which you earn the most money] how satisfied or dissatisfied are you with:
READ OUT. REVERSE SCALE. SINGLE CODE EACH.
Very satisfied
Somewhat satisfied
Neither satisfied nor dissatisfied
Somewhat dissatisfied
Very dissatisfied
ROTATE CODES BELOW
| Your job overall [ALWAYS FIRST] | |
| The number of hours you work each week | |
| Your commute to and from work | |
| Training opportunities available to you | |
| Opportunities for career development | |
| Work-life balance | |
| Your pay, including your benefits / tax credits | |
| [Parents only] Your childcare arrangements whilst you are at work |
ASK ALL
Q22. Which, if any, of the following have you done in the past 12 months?
READ OUT. MULTI CODE
| Tried to get a pay rise in your current job | 1 |
| Talked about progression opportunities with your manager | 2 |
| Applied for a new job to replace your current job | 3 |
| Requested additional hours in your current job | 4 |
| Applied for a promotion in your current job | 5 |
| Started or completed a training course(s) to improve your qualifications/ skills | 6 |
| Something else (specify) | 7 |
| Don’t know | 8 |
| None of these | 9 |
ASK ALL
Q23. Overall, over the next 12 months how important is it for you to [insert statement]?
READ OUT. SINGLE CODE
Very important
Fairly important
Not very important
Not at all important
| Increase your hours in your current job | 1 |
| Increase your pay in your current job | 2 |
| Get a new [main] job | 3 |
ASK ALL
Q24. To what extent do you agree or disagree with the following statements?
SINGLE CODE. READ OUT SCALE:
Strongly agree
Somewhat agree
Neither agree nor disagree
Somewhat disagree
Strongly disagree
| I need to improve my skills and qualifications before I can get further at work | 1 |
| I feel confident about applying for a new job | 2 |
| I know where to look for opportunities to progress in my work/career | 3 |
| At the moment my biggest priority is keeping my current job rather than looking to get further at work | 4 |
| I feel confident talking to my employer about progression and/or promotion opportunities | 5 |
ASK ALL
Q25. And, to what extent do you agree or disagree with these statements?
SINGLE CODE. ROTATE STATEMENTS. READ OUT SCALE:
Strongly agree
Somewhat agree
Neither agree nor disagree
Somewhat disagree
Strongly disagree
| People who work full-time gain more respect | 1 |
| Earning more would impact my benefits/tax credits | 2 |
| Becoming self-sufficient and not receiving benefits/tax credits to top up my earnings is important to me | 3 |
| Jobs on offer do not pay enough to make working more hours financially worthwhile | 4 |
| The thought of more responsibility at work makes me nervous | 5 |
| I would be happier and more fulfilled if I was working more hours | 6 |
| It would be difficult for me to increase my hours of work now, even if I was offered more hours | 7 |
| I don’t need to work more hours or earn more money because I get by okay on what I currently earn | 8 |
| I don’t have the right skills to move to a job with better progression opportunities | 9 |
| There just aren’t enough full-time vacancies for everyone at the moment | 10 |
| If I worked more hours, my home life would suffer | 11 |
| There isn’t enough advice and support available to help me increase my hours | 12 |
| I have made a commitment to myself to attend training to help me develop my skills by a certain date | 13 |
D SUPPORT: NEEDS & PREFERENCES
Now I am going to ask about what support you need to help you to progress in work.
ASK ALL
Q26. Interviewer explain: For the next few questions I am going to read out a list of 4 statements. From each list I’d like you to tell me which would be most and least important to encouraging you to progress in work. By progress I mean to get a job with more responsibilities, more hours or better pay – either with your current employer or a new employer.
From the following list, which of the following are most and least important in encouraging you to progress in work?
If I could get . . .
Interviewer will read out list of 4 items, repeated across 5 screens – participants will be shown all options.
READ OUT. SINGLE CODE.
| A role which fits with my caring or family responsibilities and/or health condition | 1 |
| A role that pays more than I am currently earning | 2 |
| A role that pays enough for me to come off benefits or tax credits completely and be better off | 3 |
| A role which allows flexible working e.g. flexible hours or home-working | 4 |
| A role with additional benefits, for example, a pension, bonus, cycle to work scheme or life insurance | 5 |
| A role that is permanent | 6 |
| A role with good prospects for career development and promotion | 7 |
| A role that is interesting and fulfilling | 8 |
| A role with training and support to get qualifications | 9 |
| A role that is easy and affordable for me to get to | 10 |
ASK ALL
Q27. Is there anything that makes it difficult for you to progress in your current job?
IF NECESSARY: By progress I mean increase your pay, hours and / or take on more responsibilities.
DO NOT READ OUT. MULTI CODE. PROBE FULLY.
| Employer does not allow second jobs | 1 | Employment |
| Need to wait until probationary period ends | 2 | Employment |
| Not enough full time jobs available/ too many part-time or zero hours contracts | 3 | External |
| Not enough well paid jobs/ too many minimum wage jobs | 4 | External |
| Travel costs / transport difficulties including lack of car / ability to drive / lack of local transport links | 5 | External |
| Lack of opportunities for training/ development in current job | 6 | External |
| Lack of opportunities to increase pay / hours in current job | 7 | External |
| Lack of opportunities to increase gain promotion in current job | 8 | External |
| Lack of funds to pay for training to improve my skills | 9 | Financial |
| Cannot afford to move to an area with more jobs | 10 | Financial |
| Having to pay more for childcare if I do more hours | 11 | Financial |
| Debt | 12 | Financial |
| My benefits/tax credits would go down / it would not be worth it financially | 13 | Financial |
| Poor employment record/ lack of work experience | 14 | Personal |
| My health | 15 | Personal |
| My age | 16 | Personal |
| Don’t feel confident talking to my employer about progression | 17 | Personal |
| Lack of jobs which I have experience in | 18 | Personal |
| Lack of jobs which I am interested in / which I feel are suitable for me | 19 | Personal |
| Caring responsibilities which limit the amount of hours I can work | 20 | Personal |
| Criminal record | 21 | Personal |
| Lack of skills/qualifications | 22 | Personal |
| English is my second language | 23 | |
| I don’t want to progress / am happy with my work as it is | 24 | |
| Other (specify) | 25 | |
| None of these | 26 | |
| Don’t know | 27 |
ASK ALL
Q28. Can you think of anything that makes it difficult for you to get a new job with better progression opportunities?
IF NECESSARY: By better progression opportunities, I mean chances to increase your pay, hours and / or develop your skills.
DO NOT READ OUT. MULTI CODE. PROBE FULLY.
| Employer does not allow second jobs | 1 | Employment |
| Need to wait until probationary period ends | 2 | Employment |
| Not enough full time jobs available/ too many part-time or zero hours contracts | 3 | External |
| Not enough well paid jobs/ too many minimum wage jobs | 4 | External |
| Travel costs / transport difficulties including lack of car / ability to drive / lack of local transport links | 5 | External |
| Lack of opportunities for training/ development in current job | 6 | External |
| Lack of opportunities to increase pay / hours in current job | 7 | External |
| Lack of opportunities to increase gain promotion in current job | 8 | External |
| Lack of funds to pay for training to improve my skills | 9 | Financial |
| Cannot afford to move to an area with more jobs | 10 | Financial |
| Having to pay more for childcare if I do more hours | 11 | Financial |
| Debt | 12 | Financial |
| My benefits/tax credits would go down / it would not be worth it financially | 13 | Financial |
| Poor employment record/ lack of work experience | 14 | Personal |
| My health | 15 | Personal |
| My age | 16 | Personal |
| Don’t feel confident talking to my employer about progression | 17 | Personal |
| Lack of jobs which I have experience in | 18 | Personal |
| Lack of jobs which I am interested in / which I feel are suitable for me | 19 | Personal |
| Caring responsibilities which limit the amount of hours I can work | 20 | Personal |
| Criminal record | 21 | Personal |
| Lack of skills/qualifications | 22 | Personal |
| English is my second language | 23 | |
| I don’t want to progress / am happy with my work as it is | 24 | |
| Other (specify) | 25 | |
| None of these | 26 | |
| Don’t know | 27 |
ASK ALL
Q29. Would any of these help make it easier for you to progress in work?
IF NECESSARY: By progress I mean get a job with more responsibilities, more hours or better pay – either with your current employer or a new employer
READ OUT. MULTI CODE. PROBE FULLY.
| Support and training around finding/ getting a new job (for example, interview skills, CV skills, communication skills) | 1 |
| Help with the cost of travel to and from work | 2 |
| Support to pursue further or higher education | 3 |
| Support and training with work-related skills (e.g. spoken or written English; IT skills; job-specific skills) | 4 |
| Support to manage physical or mental health condition | 5 |
| Access to affordable/ good quality childcare | 6 |
| [If they have caring responsibilities] Support to manage caring responsibilities | 7 |
| Something else (specify) | 8 |
| None of these (DO NOT READ OUT) | 9 |
| Don’t know (DO NOT READ OUT) | 10 |
ASK ALL
Q30. Who/ where would you like to get support from to help you progress in work?
[IF ANSWERED CODE 9 (NONE OF THESE) AT Q29] Who / where would you go to if you were looking for information or support about work?
READ OUT. MULTI CODE.
| Employer / company / line manager | 1 |
| Jobcentre Plus | 2 |
| National Careers Service | 3 |
| Library or other community hub | 4 |
| [Parents only] Children’s centre | 5 |
| Online sources (specify) | 6 |
| [Couples only] My partner | 7 |
| Other friends / family | 8 |
| Someone else (specify) | 9 |
| Don’t know | 10 |
E PARTNER
ASK ALL WHO HAVE A PARTNER
Q31 The following questions are about your partner:
Which of the following describes your partner’s main employment status at the moment? You can give more than one answer.
READ OUT. MULTI CODE.
| Self employed | 1 | |
| Working for an employer in paid employment | 2 | |
| Not working in paid employment [EXCLUSIVE] | 3 |
ASK IF PARTNER IS IN WORK (Q31=1 OR 2)
PROBE Q32 How many hours a week does your partner normally spend in paid work?
FOR BEST ESTIMATE
| ENTER NUMBER OF HOURS | |
| Don’t know | 2 |
| Refused | 3 |
IF DON’T KNOW OR REFUSED (CODES 2-3) AT Q34
Q33 Would it be…?
READ OUT. SINGLE CODE.
DP – AUTOMATICALLY CODE ALL RESPONSES TO RANGE
| Less than 5 hours | 1 | |
| 6 to 10 hours | 2 | |
| 11 to 15 hours | 3 | |
| 16 to 20 hours | 4 | |
| 21 to 25 hours | 5 | |
| 26 to 30 hours | 6 | |
| 31 to 35 hours | 7 | |
| 36 to 40 hours | 8 | |
| Over 40 hours | 9 | |
| Don’t Know | 10 |
IF CODE 2 at Q31
Q35. Which of the following best describes their contract? If they have more than one job please think about the one in which they earn the most money.
READ OUT. SINGLE CODE.
| A permanent or temporary zero hours’ contract/job with no specified minimum number of hours each week | |
| A permanent or open ended job/contract with a fixed or minimum number of hours per week | |
| A temporary/fixed term or seasonal contract with a specified end date and regular or minimum number of hours | |
| Something else (specify) |
F UNIVERSAL CREDIT
One of the ways that the Government is looking to support people in work to progress in their job and career is through Universal Credit. I would now like to ask you some questions about Universal Credit.
ASK ALL
Q36. How much do you know about Universal Credit?
READ OUT. SINGLE CODE.
| A lot | 1 |
| A little | 2 |
| I have heard of Universal Credit but that is all | 3 |
| I have never heard of it before today | 4 |
Q37. I’m going to read some statements about Universal Credit.
For each can you tell me if you:
Know it is true
Think it is probably true
Think it is probably false
Know it is false
Have no idea
SINGLE CODE PER STATEMENT. ROTATE STATEMENTS.
| Know is true | Think probably true | Think probably false | Know is false | Have no idea | |
|---|---|---|---|---|---|
| People claiming Universal Credit can get help with childcare costs | 1 | 2 | 3 | 4 | 5 |
| People currently claiming Working Tax Credits, Child Tax Credits and / or Housing Benefit will be moved on to Universal Credit | 1 | 2 | 3 | 4 | 5 |
G DEMOGRAPHICS
ASK ALL
Thank you, the survey is nearly finished. I would now like to ask a few final questions about you, this is just so we can group your answers together with other people like you for our analysis. Within the questions which follow there is a question which asks you to describe your ethnic origin, as well as questions regarding your health and finances. These questions are voluntary and you do not have to answer them if you do not wish to.
ASK IF NOT ON SAMPLE
G1. What was your age at your last birthday?
| WRITE IN AGE. | 1 |
| Don’t know | 2 |
| Refused | 3 |
IF DON’T KNOW OR REFUSED (CODES 2 OR 3) AT D1
G1b. Are you…?
READ OUT. SINGLE CODE.
| 16 to 17 | 1 | |
| 18 to 24 | 2 | |
| 25 to 34 | 3 | |
| 35 to 44 | 4 | |
| 45 to 54 | 5 | |
| 55 to 60 | 6 | |
| 61 to 64 | 7 | |
| 65 or older | 8 | |
| Don’t Know | 9 | |
| Refused | 10 |
RECORD IF NOT ON SAMPLE
G2. (DO NOT ASK) RECORD GENDER
SINGLE CODE.
| Male | 1 | |
| Female | 2 | |
| Don’t know | 3 |
ASK ALL
G3 How would you describe your ethnic background?
| WHITE British | 1 | |
|---|---|---|
| WHITE Irish | 2 | |
| WHITE Other background (SPECIFY) | 3 | |
| MIXED White and Black Caribbean | 4 | |
| MIXED White and Black African | 5 | |
| MIXED White and Asian | 6 | |
| MIXED Other mixed background | 7 | |
| BLACK OR BLACK BRITISH Caribbean | 8 | |
| BLACK OR BLACK BRITISH African | 9 | |
| BLACK OR BLACK BRITISH Other background | 10 | |
| ASIAN OR ASIAN BRITISH Indian | 11 | |
| ASIAN OR ASIAN BRITISH Pakistani | 12 | |
| ASIAN OR ASIAN BRITISH Bangladeshi | 13 | |
| ASIAN OR ASIAN BRITISH Other background | 14 | |
| CHINESE | 15 | |
| OTHER ETHNIC BACKGROUND (SPECIFY) | 16 | |
| DO NOT READ OUT: Don’t know / Refused | 17 |
ASK ALL
G4 Which of these is the highest level of qualification you have?
READ OUT. SINGLE CODE.
| Degree level or above (including postgraduate qualifications) | 1 | |
| 2 or more A-Levels, NVQ Level 3, BTEC Level 3 Diploma or equivalent | 2 | |
| 1 A-Level or equivalent, 5 or more GCSEs of grade A*-C or equivalent, NVQ Level 2, BTEC level 2 diploma or equivalent | 3 | |
| GCSEs of less than A*-C or equivalent, NVQ Level 1 | 4 | |
| Something else (Specify) | 5 | |
| No qualifications | 6 | |
| Don’t know | 7 |
ASK ALL
G5. Thinking about the last 2 months, which one of the following statements best describes how well you have been keeping up with your bills and credit commitments?
SINGLE CODE. READ OUT.
| Keeping up with all bills and commitments without any difficulty | 1 |
| Keeping up with all bills and commitments, but it is a struggle from time to time | 2 |
| Keeping up with all bills and commitments, but it is a constant struggle | 3 |
| Falling behind with some bills or credit commitments | 4 |
| Having real financial problems and have fallen behind with many bills or credit commitments | 5 |
| Have no bills or commitments | 6 |
| Don’t know | 7 |
ASK ALL
G7. Which of these best describes the accommodation you are living in at the moment?
READ OUT. SINGLE CODE.
| Rented privately | 1 | |
| Rented from a council or local authority | 2 | |
| Rented from a Housing Association | 3 | |
| Being bought on a mortgage/bank loan | 4 | |
| Shared ownership where you pay part rent and part mortgage | 5 | |
| Owned outright | 6 | |
| Living with friends/relatives and paying some rent | 7 | |
| Living with friends/ relatives and not paying any rent | 8 | |
| You are living in temporary or sheltered accommodation or are rough sleeping | 9 | |
| Something else (SPECIFY) | 10 | |
| Don’t know | 11 | |
| None of these | 12 | |
| Refused | 13 |
ASK ALL
G8. Which, if any, of the following do you use to connect to the internet:
READ OUT. MULTI CODE.
| Laptop / desktop computer at home | 1 |
| Laptop / desktop computer at work | 2 |
| Smart TV | 3 |
| Smartphone | 4 |
| Tablet computer | 5 |
| Video game console | 6 |
| I do not use or have access to the internet | 7 |
ASK ALL WHO USE THE INTERNET [CODE 1 – 6 AT G8]
G9. Which of the following social media platforms do you use regularly? By regularly we mean at least once a week.
READ OUT. SINGLE CODE.
| 1 | |
| 2 | |
| Snapchat | 3 |
| 4 | |
| 5 | |
| Something else | 7 |
| None of these | 8 |
ASK ALL
G10. Do you have a health condition or disability that substantially limits your ability to carry out normal day to day activities?
DO NOT READ OUT. SINGLE CODE.
| Yes | 1 |
| No | 2 |
| Prefer not to say | 3 |
ASK ALL WHO HAVE A DISABILITY / HEALTH PROBLEM (F11 = CODE 1)
G11. Do you consider yourself to be disabled?
DO NOT READ OUT. SINGLE CODE.
| Yes | 1 |
| No | 2 |
| Sometimes | 3 |
| Prefer not to say | 4 |
ASK ALL WHO CONSIDER THEMSELVES TO BE DISABLED (G11 = CODE 1 OR CODE 3)
G12. Do you receive Access to Work?
DO NOT READ OUT. SINGLE CODE.
| Yes | 1 |
| No | 2 |
| Don’t know | 3 |
| Prefer not to say | 4 |
ASK ALL WHO RECEIVE ACCESS TO WORK (F12=1)
G13. And how helpful has your award been in supporting you to do your job?
READ OUT. SINGLE CODE.
| Very helpful | 1 |
| Somewhat helpful | 2 |
| Not helpful | 3 |
| Not at all helpful | 4 |
H Follow up and data linking
ASK ALL
H1 That just about brings me to the end of this interview. Thank you for participating in this survey. As part of this research we would really like to speak to you again in a few months’ time about your further experiences of getting on at work and building a career.
This would mean someone contacting you again to ask if you might participate in further research. If you are re-contacted, you will still be able to decline to participate if you wish.
Are you happy for Ipsos MORI to keep your contact details and to be re-contacted about the next part of this research?
READ OUT. SINGLE CODE.
| Yes | 1 | |
| No | 2 | |
| Don’t know | 3 |
IF CONSENT TO recontact (E1=1)
H2 And could I just check, is [NUMBER] the best number to call you on?
SINGLE CODE.
| Yes | 1 | |
| No - write in number | 2 |
IF CONSENT TO recontact (E1=1)
H3 And could I take another number such as a mobile number; just to make sure I’m able to reach you?
SINGLE CODE.
| RECORD NUMBER | 1 |
| No other number | 2 |
IF CONSENT TO recontact (E1=1)
H4 In case we can’t reach you by phone, could I also take your email address if you have one?
SINGLE CODE.
| RECORD EMAIL ADDRESS | 1 | |
| Does not have an email address | 2 | |
| Doesn’t know email address | 3 | |
| Refused | 4 |
ASK ALL
H5 Thank you for participating in this survey.
The Department for Work and Pensions (DWP) would like to add information held on your benefits, employment and earnings to your answers to this interview. This will give them a better picture of the circumstances of working people and families receiving tax credits and/or Housing Benefit.
If you agree, your answers will be linked using a unique identifier to your government records. All information will be used for research and statistical purposes only. Your responses would only be seen by a small number of specialist analysts within DWP, and no-one else. Your personal details will be kept completely confidential, and your dealings with DWP, HMRC or any other government agencies will not be affected in any way.
Would it be ok for us to let DWP match your answers to your records?
The findings from this research will be published on the DWP website in February 2020.
If respondent asks: the DWP website is DWP
SINGLE CODE.
| Yes | 1 |
| No | 2 |
| Don’t know – need further information | 3 |
READ OUT TO those who need further information (H5=3)
H6 The Department for Work and Pensions holds information about benefits, employment, tax, national insurance, saving and private pensions. We would like to add this information to your answers from the questions we have just asked you, to…
Create a more accurate picture of people’s work history, benefits and needs
Help researchers and policymakers to be better informed in their work to improve the services Jobcentre Plus provides.
We will only do this if you give your permission to link the information we already hold about you to the answers you have given in the survey today
The information will only be used for research and statistics.
The information will be kept confidential.
Names and addresses are never included in the results and no individual can be identified from the research Your personal details will not be passed to anyone else outside the research team and the Department for Work and Pensions
The information will not be used to work out whether anyone is claiming benefits they should not be.
Any current or future claims for benefits will not be affected.
ASK IF H5=2 OR H5=3 or
H6a Would it be okay for us to let DWP match your answers to your records?
SINGLE CODE. DO NOT READ OUT.
| Yes | 1 | CLOSE |
| No | 2 | CLOSE |
| Don’t know | 3 | CLOSE |
READ TO ALL
Finally I would just like to confirm that this survey has been carried out under Ipsos MORI instructions and within the rules of the MRS Code of Conduct. Thank you very much for your help today.
Qualitative research materials
Topic guide: individual depth interviews
Aims and objectives
The Department for Work and Pensions (DWP) has commissioned Ipsos MORI to conduct a piece of qualitative research to investigate people’s experience of work, tax credits and other types of benefits. The purpose of this research is to better understand how DWP can support people who are working and claiming benefits when working age benefits are replaced by Universal Credit. This research consists of 2 stages, the first being a quantitative survey. At the end of this survey, respondents were asked if they would like to take part in a follow-up piece of qualitative research, this being the second stage of the research.
These follow-up interviews will explore people’s experiences and awareness of in-work progression and look at their motivations for taking or not taking steps for progression.
Specifically, the aims of this research are:
To understand the distribution of barriers to progression and support needs across our target group.
To assess awareness of/reaction to in-work support and conditionality, and understand how this might influence behaviour around progression.
To inform the development of effective and targeted interventions that can maximise progression outcomes for this group.
NOTE TO MODERATOR: Before conducting interviews, please read through respondent’s survey responses in detail.
| 1. Introduction | 2 to 3 mins |
|---|---|
| Thank participant for taking part. Introduce self, and explain nature of interview: informal conversation; gather all opinions; all opinions valid. Interviews should take around 45-60 minutes. Introduce research and topic – The Department for Work and Pensions (DWP) has commissioned Ipsos MORI to conduct research with people who are working and claiming tax credits and/or other types of benefits so that DWP can understand how it can support people like you in the future when working age benefits are replaced by Universal Credit. This research aims to understand your experiences of work to inform the design of services to help people earn more and increase their skills. Role of Ipsos MORI – Independent research organisation (i.e. independent of government), we adhere to the MRS Code of Conduct. Confidentiality – reassure all responses anonymous and that identifiable information about them will not be passed on to anyone, including back to DWP or any other government department. Consent – check that they are happy to take part in the interview and understand their participation is voluntary (they can withdraw at any time). Ask for permission to digitally record – transcribe for quotes, not detailed attribution. Any questions before we begin? |
Orientates interviewee, prepares them to take part in the interview. Outlines the ‘rules’ of the interview (including those we are required to tell them about under MRS and GDPR guidelines). |
| 2. Background and context | 5 mins |
|---|---|
| To start off with, I’m going to ask a few questions about yourself. Note to moderator: Most of this is covered in the survey, therefore the purpose of this is to warm the participant up. Refer to survey data throughout. Cover briefly: Can you tell me a bit about yourself? Probe: Family and home life – who they live with (partner, children), any other caring responsibilities, how long they have lived there. Work – brief overview of current job, how long they have been there, if they have more than one job, hours worked each week. Work history – number and type of jobs since leaving education, and any spells not working Benefits they are currently claiming for example, WTC, CTC, HB, IS, JSA, ESA and how long they have been claiming? Any changes in your life recently? Do you expect there to be any changes in the near future? For example, moving house, having a baby, changing jobs, receiving a promotion. |
Provides contextual background information about the participant and their lifestyle. |
| 3. Employment | 10 mins |
|---|---|
| Next, we are going to talk about your work. You mentioned that you are working as [INSERT JOB], what does this role involve? You mentioned that you work [INSERT NUMBER OF HOURS] per week, why is it that you work these hours? Why does this work for you? Note to moderator: If they have more than one job, ask about both individually. In the survey, you mentioned that you do your job because [INSERT SURVEY RESPONSE], could you please tell me a bit more about this? Probe: skills, convenience, location, opportunities, childcare, pay What do you like / dislike? What were the factors you considered in taking this job? Did you discuss applying for or taking this job with anyone else? If so what did you talk about with them? You mentioned in the survey that you have been in this role for [INSERT SURVEY RESPONSE]: Why do you think you have been there for that amount of time? Probe: fits in with childcare, good location, good pay, good opportunities, wanting stability, influence of family / partner If they have tried to progress in the past 12 months You mentioned in the survey that you had [INSERT FORMS OF EMPLOYMENT PROGRESSION THEY HAVE DONE IN THE PAST 12 MONTHS], could you tell me a bit more about this? Probe: what did they do? Why did they do this – what prompted them? What was the outcome? Did they talk to anyone else about this (family / friends) – what did they say? |
| 4. Home life | 10 mins |
|---|---|
| I’d like to talk a bit about your home life and how this interacts with your work. Role and responsibilities at home: Who does what / how does this work /how was this decided on? Do you get any help or support from anyone? What with? Probe on: financial management; childcare; household management (cleaning, cooking); paying bills. What effect does this have on your work? And how you feel about work? What other responsibilities or interests do you have outside of work? Those with partner: You mentioned that you have a partner – are they working? Working partners: Can you tell me about their job? Probe: hours worked, contract type, length of time in role. How does their work pattern fit in with yours? Probe: do their hours overlap? Shift work? And how do your and yours partners work pattern(s) influence who does what at home / how responsibilities are shared? Non-working partners: How long has that been the case [that partner doesn’t work], and is that likely to change in the near future? What influence does this have on your work patterns? And how does this influence who does what at home / how responsibilities are shared? Those with children: How are your children cared for whilst you’re at work? Why do you use this childcare? What role does the cost of formal childcare play in this decision? Who else was involved in the decision to use this form of childcare? Probe: How does this fit around their / their partner’s work? To what extent did work play a role? What influence does this have on your work? Probe around: hours, how many hours they work, where they work etc. [CHECK SURVEY RESPONSE] How do you manage your household finances? Probe on budgeting sheets, lists, techniques for keeping track of income and outgoings, monitoring energy use, switching supplier etc and why they use these approaches. [If partner] what role do you and your partner each play in managing your household finances? Who does what? Why? How do you balance the different demands on your household finances? What role do [INSERT relevant tax credit or housing benefit] or any other benefits play in helping you manage your household finances/ bills. |
Collect information on their current employment and employment history. |
| 4. Attitudes towards progression | 15 mins |
|---|---|
| Next, we are going to talk about the near future and what you see for yourself more broadly and in terms of your employment. Firstly, could you tell me about any goals or hopes you have for the near future? IF NECESSARY: This could include getting married, having children, moving house, moving abroad, maintaining stability, changing jobs, getting a promotion, earning more money, building savings, hopes /aspirations for children – educational / work achievement. Why are these goals important for you? What impact would achieving these have? Do you know when you would like to achieve these things? Is there anyone in your life that you share / talk about these goals with? What does work mean to you? How does it fit with the rest of your family / household requirements? Note to moderator: here we want to understand their work ethic / does work play a big or small role in their life? Imagine nothing is in your way, if you could change anything about your work, what would it be? Probe: Change working hours Increase pay More training Promotion opportunities Adapt role / responsibilities – how Working in a different sector or doing a totally different job Probe to explore why they are open to the types of changes they include and not others (as relevant) If they wanted to make a change What would be the benefits of making these changes? Would there be any drawbacks? Why do you want to make these changes? Probe: Do they want to make these changes to benefit someone else? Who else would be affected by these changes? Who else would be involved in you making these changes? How supportive do you think they would be? Why do you feel you haven’t you been able to make these changes yet? Probe: Availability of opportunities Constraints of current job (for example, not enough time, precarious contract etc.) Health / health condition / disability Availability of opportunities locally / that they can travel to Childcare Other caring responsibilities Skills / qualifications Confidence / lack of Comfortable where they are Partner/ other family commitments / responsibilities [If applicable] How would you feel about talking to your current employer about wanting to make these changes? What concerns would you have? If they don’t want to make any changes What aspects of your current work suit you best? Is there anything that doesn’t suit you? Is there anything that would make you want to change your role / job in some way? If not, explore whether this might change in the future. What do you know about other jobs available to you? How do you know this? How would you feel about applying for a different role? Probe around confidence (preparing CV, making application, interview) and capability / know-how [IDENTIFY IT LITERACY IN SURVEY DATA] How would you feel about applying for a job online? |
| 5. Support needs and preferences | 15 mins |
|---|---|
| Next, we are going to talk about what support could help you to progress in work. This could be anything from increasing your pay, increasing the hours you work, getting a promotion / changing role or enrolling in training. How could you go about achieving this [if participant has discussed interest in specific vision of progression, refer to this, if not – to increasing pay, increasing number of hours, getting a promotion, changing role or enrolling in training]? What would have to happen to make this achievable for you? Probe on: support from employer, support from family / partner / friends, childcare, transport What would be the steps you’d need to take to doing so? Would there be any drawbacks? What would be the benefits of making this change? Would there be any drawbacks? What support do you feel would be most helpful for you in taking the initial steps towards achieving this? Probe: skills / qualifications, opportunities, encouragement (who from?) Who or where would you expect to get support / help from? What help you would need from your family to achieve this? And what about your employer what support would you need here? How helpful would training at work be in helping you develop new skills? Is this something you have access to in your current job? Is this something you have taken part in? Probe: was this helpful? / do they think it would have been helpful? Explain: DWP are looking into using Jobcentre Plus to support people to progress in work and build confidence and skills. How do you feel about this? Have you had experiences with Jobcentre Plus in the past? What were your experiences? How likely would you be to take up this support? Probe around perceptions of JCP – reasons to / not to visit? How about online support provided by JCP? |
| 6. Universal Credit | 5 mins |
|---|---|
| Lastly, I have a few questions regarding Universal Credit. What do you know about Universal Credit? Where have you got this from? How do you think Universal Credit will affect you? How do you feel about this? Explain: All Tax Credit and Working Tax Credit claimants will be moved on to Universal Credit. A key part of Universal Credit is encouraging people to be self-sufficient and not rely on benefits. As part of UC you will be required to sign a Claimant Commitment, and this could have some requirements, such as going to the Jobcentre for meetings with a work coach to talk about progression, attending a training course or taking other steps to progress. What do you think about this? Probe: positives and negatives, how does this make them feel / feel about UC? What effect do you think this would have on you? How likely would you be to meet these requirements? What effect would these requirements have on how you felt about progressing in work? IF NECESSARY: that is, increase your hours or pay or get a new job. |
This section aims to explore their understanding of Universal Credit. |
| 7. Summing up | 2 to 3 mins |
|---|---|
| We are coming to the end of the interview, but I have a few final questions before we finish. How do you feel about progressing in work now? If there was one thing that could encourage you to progress in work, what would it be? If there was one thing that DWP or wider government could do to support you to progress in work what would it be? Is there anything else you would like to mention that we haven’t had the opportunity to discuss? Thank and reiterate confidentiality. Incentives = a £30 ‘thank you’ from Ipsos MORI for their time and contribution. Explain next steps for the research and close – report will be published at the beginning of 2020. Signpost for further information / if any concerns about discussion: Turn2Us, entitledto, Universal Credit, Citizens Advice |
Brings the conversation to a close, and allows participants time to mention anything that has not already been covered. |
Topic guide: couple paired depth interviews
Aims and objectives
The Department for Work and Pensions (DWP) has commissioned Ipsos MORI to conduct a piece of qualitative research to investigate people’s experience of work, tax credits and other types of benefits. The purpose of this research is to better understand how DWP can support people who are working and claiming benefits when working age benefits are replaced by Universal Credit. This research consists of 2 stages, the first being a quantitative survey. At the end of this survey, respondents were asked if they would like to take part in a follow-up piece of qualitative research, this being the second stage of the research.
These follow-up interviews will explore people’s experiences and awareness of in-work progression and look at their motivations for taking or not taking steps for progression.
Specifically, the aims of this research are:
- to understand the distribution of barriers to progression and support needs across our target group
- to assess awareness of/reaction to in-work support and conditionality, and understand how this might influence behaviour around progression
- to inform the development of effective and targeted interventions that can maximise progression outcomes for this group
NOTE TO MODERATOR: Before conducting interviews, please read through respondent’s survey responses in detail. Tailor language and questioning according to relationship with research partner and their working status.
We are carrying out interviews with couples to better understand the household dynamics and decision making around work. Throughout please probe on the relationship between the participants and explore how this influences the attitudes of the lead participant towards work.
| 1. Introduction | 2 to 3 mins |
|---|---|
| Thank participants for taking part. Introduce self, and explain nature of interview: informal conversation; gather all opinions; all opinions valid. Interviews should take around 90 minutes. Explain that we are carrying out interviews with couples to better understand the household dynamics and decision making around work. Introduce research and topic – The Department for Work and Pensions (DWP) has commissioned Ipsos MORI to conduct research with people who are working and claiming tax credits and/or other types of benefits so that DWP can understand how it can support people like you in the future when working age benefits are replaced by Universal Credit. This research aims to understand your experiences of work to inform the design of services to help people earn more and increase their skills. Role of Ipsos MORI – Independent research organisation (i.e. independent of government), we adhere to the MRS Code of Conduct. Confidentiality – reassure all responses anonymous and that identifiable information about them will not be passed on to anyone, including back to DWP or any other government department. Consent – check that they are happy to take part in the interview and understand their participation is voluntary (they can withdraw at any time). Ask for permission to digitally record – transcribe for quotes, not detailed attribution. Any questions before we begin? |
Orientates interviewee, prepares them to take part in the interview. Outlines the ‘rules’ of the interview (including those we are required to tell them about under MRS and GDPR guidelines). |
| 2. Background and context | 10 mins |
|---|---|
| To start off with, I’m going to ask a few questions about yourselves. - names and relationship between interviewees, how long they have known each other Note to moderator: Cover briefly, primary purpose of this is to warm participants up. Cover briefly: Can you tell me a bit about yourselves? Probe: - family and home life – how long they’ve been in a relationship, who else lives with them, any other caring responsibilities, how long they have lived there - work – work status for both - work history –number and type of jobs since leaving education, and any spells not working - benefits they are currently claiming for example, WTC, CTC, HB, IS, JSA, ESA and how long they have been claiming? - how would you describe your relationship and your roles within your relationship? Probe: are you similar or different? How? - any changes in their lives recently? Do you expect there to be any changes in the near future? For example, moving house, having a baby, changing jobs, receiving a promotion |
Provides contextual background information about the participant and their lifestyle. |
| 3. Employment | 15 mins |
|---|---|
| Next, we are going to talk about your current job(s). Both: Occupation and work history Discuss main occupation – working (how many jobs; how many hours; which job); looking after children; caring for another adult; not working; looking for work etc. - why do you do this /these roles? Probe: skills, convenience, location, opportunities, fits with childcare, pay, opportunities, wanting stability. - what works for you about this? Are there any challenges? Probe on – hours, income, meeting other commitments and responsibilities for example, family; travel - how does this work within your relationship? Probe – whether one supports the other? What effect does this have on their relationship? Does anyone else help for example with childcare? - how long has this been the case for? Has anything changed recently? Probe to understand what changed / when and why – and what effect this has had? How did they agree / come to agreement about this change? - what types of conversations do you have about work and your other responsibilities (for example, care, children)? What types of things do you discuss? Do you usually find you agree or disagree? Did you discuss applying for /taking your current job(s) with each other? What types of things did you talk about? |
Collect information on their current employment and employment history. |
| 4. Home life | 10 mins |
|---|---|
| I’d like to talk a bit about your home life and how this interacts with your work. Role and responsibilities at home: Who does what / how does this work /how was this decided on? Do you get any help or support from anyone? What with? Probe on: financial management; childcare; household management (cleaning, cooking); paying bills. What effect does this have on your work? And how you feel about work? What other responsibilities do you have outside of family and work? What influence does this have on your work? And home life? Those with children: How are your children cared for whilst you’re at work? - why do you use this childcare? What role does the cost of formal childcare play in this? Probe: How does this fit around their / their partner’s work? To what extent did work play a role? - who was involved in the decision to use this form of childcare? - what influence does childcare / the need for childcare have on work for both of you? Probe around: hours, how many hours they work, where they work etc. Both: How do you manage your household finances? Probe on budgeting sheets, lists, techniques for keeping track of income and outgoings, monitoring energy use, switching suppliers etc. and why they use these approaches. - what role do each of you play in managing your household finances? Who does what? Why? - how do you balance the different demands on your household finances? - what role do [INSERT relevant tax credit or housing benefit] or any other benefits play in helping you manage your household finances/ bills. |
Collect information on their home life and how this interacts with / influences work |
| 4. Attitudes towards progression | 20 mins |
|---|---|
| Next, we are going to talk about the near future and what you see for yourself more broadly and in terms of your employment. Both: What shared goals or plans do you have for your future? IF NECESSARY: This could include getting married, having children, moving house, moving abroad, maintaining stability, changing jobs, getting a promotion, earning more money, building savings, hopes /aspirations for children – educational / work achievement. And any individual goals or ambitions? Probe as relevant (for example, was partner aware of these) - why are these goals important for you? What impact would achieving these have? - do you know when you would like to achieve these things? Both: What does work mean to you? And how does it fit with these wider goals? Note to moderator: here we want to understand their work ethic / what role work plays in their life? Both: Have [either of] you taken any steps to change anything about your in work in the past 12 months? Could you tell me a bit about this? - why did you do this? Probe around whether anyone encouraged them, what they thought benefits could be? - what was the outcome? - have you done anything else since taking part in the survey? - both: did you discuss this together? Why/not? What types of things did you talk about? Both: If you could change anything about your work what would it be? |
|
| Probe – what would be the positives of this – probe income, hours, skills, work satisfaction? And what would be the drawbacks? Probe on effect on family / home life? Probe: - change working hours - increase pay - more training - promotion opportunities - adapt role / responsibilities – how - working in a different sector or doing a totally different job What effect would that have on your family and home life? Would there be an impact on how you balance responsibilities at work and home. Ask research partner: what would this mean for you [if lead participant did this]? How would you feel about this? Would you support it? What would you say to [lead participant] if they said they wanted to change their job? Both: Why do you feel you haven’t you been able to make these changes yet? Probe: - availability of opportunities - constraints of current job (for example, not enough time, precarious contract etc) - health / health condition / disability - availability of opportunities locally / that they can travel to - childcare - other caring responsibilities - skills / qualifications - confidence / lack of - comfortable where they are - partner/ other family commitments / responsibilities - what could help you make these changes? Probe fully. - where would you want to get this help from? - what role could your family and friends play in helping you with this? - ask research partner: what role could you play in this? - how would you feel about talking to your current employer about wanting to make these changes? What concerns would you have? - how would you feel about moving to work for a different organisation? If they don’t want to make any changes - what aspects of your current work suit you best? - is there anything that doesn’t suit you? - is there anything that would make you want to change your role / job in some way? Both: What do you know about other jobs available to you? How do you know this? How would you feel about applying for a different role? Probe around confidence (preparing CV, making application, interview) and capability / know-how [IDENTIFY IT LITERACY IN SURVEY DATA] How would you feel about applying for a job online? |
| 5. Support needs and preferences | 20 mins |
|---|---|
| Next, we are going to talk about what support could help you to progress in work. This could be anything from increasing your pay, increasing the hours you work, getting a promotion / changing role or enrolling in training Both: [If participant has discussed interest in specific vision of progression, refer back to this if not – to increasing pay, increasing number of hours, getting a promotion, changing role or enrolling in training] How could you go about achieving this? - what would have to happen to make this achievable for you? Probe on: support from employer, support from family / partner / friends, childcare, transport, changes to home-life / tasks - what would be the steps you’d need to take? Would there be any drawbacks? - what support do you feel would be most helpful for you in taking the initial steps towards achieving this? Probe: skills / qualifications, opportunities, encouragement (who from?) - what help would you need? Probe – employer? Family? Partner? - would you need to make changes to your home life/ how things are organised at home? - how helpful would training at work be in helping you develop new skills? Is this something you have access to in your current job? Is this something you have taken part in? Probe: was this helpful? / do they think it would have been helpful? Explain: DWP are looking into using Jobcentre Plus to support people to progress in work and build confidence and skills. - how do you feel about this? - have either of you had experiences with Jobcentre Plus in the past? What were your experiences? - how likely would you be to take up this support? Probe around perceptions of JCP – reasons to / not to visit? How about online support provided by JCP? |
| 6. Universal Credit | 10 mins |
|---|---|
| Lastly, I have a few questions regarding Universal Credit. What do you know about Universal Credit? (Ask both) - where have you got this from? - how do you think Universal Credit will affect you? Explain: All Tax Credit and Working Tax Credit claimants will be moved on to Universal Credit. A key part of Universal Credit is encouraging people to be self-sufficient and not rely on benefits. As part of UC you will be required to sign a Claimant Commitment, and this could have some requirements, such as going to the Jobcentre for meetings with a work coach to talk about progression, attending a training course or taking other steps to progress. - what do you think about this? Probe: positives and negatives, how does this make them feel / feel about UC? - what effect do you think this would have on you / your family? - how likely would you be to meet these requirements? - what effect would these requirements have on how you felt about progressing in work? IF NECESSARY: that is, increase your hours or pay or get a new job |
This section aims to explore their understanding of Universal Credit. |
| 7. Summing up | 2 to 3 mins |
|---|---|
| We are coming to the end of the interview, but I have a few final questions before we finish. How do you feel about progressing in work now? If there was one thing that could encourage you to progress in work, what would it be? If there was one thing that DWP or wider government could do to support you to progress in work what would it be? Is there anything else you would like to mention that we haven’t had the opportunity to discuss? Thank and reiterate confidentiality. Incentives = a £30 ‘thank you’ from Ipsos MORI for their time and contribution. Explain next steps for the research and close – report will be published at the beginning of 2020. Signpost for further information / if any concerns about discussion: Turn2Us, entitledto, Universal Credit, Citizens Advice |
Brings the conversation to a close, and allows participants time to mention anything that has not already been covered. |
Topic guide: influencer pair depth interviews
Aims and objectives
The Department for Work and Pensions (DWP) has commissioned Ipsos MORI to conduct qualitative research to investigate people’s experience of work, tax credits and other types of benefits. The purpose of this research is to better understand how DWP can support people who are working and claiming benefits when working age benefits are replaced by Universal Credit. This research consists of 2 stages, the first being a quantitative survey. At the end of this survey, respondents were asked if they would like to take part in a follow-up piece of qualitative research, this being the second stage of the research.
These follow-up interviews will explore people’s experiences and awareness of in-work progression and look at their motivations for taking or not taking steps for progression.
Specifically, the aims of this research are:
- to understand the distribution of barriers to progression and support needs across our target group
- to assess awareness of/reaction to in-work support and conditionality, and understand how this might influence behaviour around progression
- to inform the development of effective and targeted interventions that can maximise progression outcomes for this group
NOTE TO MODERATOR: Before conducting interviews, please read through respondent’s survey responses in detail.
We are carrying out interviews with influencers to better understand the household dynamics and decision making around work. Throughout please probe on the relationship between the participants and explore how this influences the attitudes of the lead participant towards work. Throughout we have indicated where questions should be addressed to the lead participant / both.
| 1. Introduction | 2 to 3 mins |
|---|---|
| Thank participant for taking part. Introduce self, and explain nature of interview: informal conversation; gather all opinions; all opinions valid. Interviews should take around 90 minutes. Explain that we are carrying out interviews with [INSERT RELATIONSHIP] to better understand the household dynamics and decision making around work. Introduce research and topic – The Department for Work and Pensions (DWP) has commissioned Ipsos MORI to conduct research with people who are working and claiming tax credits and/or other types of benefits so that DWP can understand how it can support people like you in the future when working age benefits are replaced by Universal Credit. This research aims to understand your experiences of work to inform the design of services to help people earn more and increase their skills. Role of Ipsos MORI – Independent research organisation (i.e. independent of government), we adhere to the MRS Code of Conduct. Confidentiality – reassure all responses anonymous and that identifiable information about them will not be passed on to anyone, including back to DWP or any other government department. Consent – check that they are happy to take part in the interview and understand their participation is voluntary (they can withdraw at any time). Ask for permission to digitally record – transcribe for quotes, not detailed attribution. Any questions before we begin? |
Orientates interviewee, prepares them to take part in the interview. Outlines the ‘rules’ of the interview (including those we are required to tell them about under MRS and GDPR guidelines). |
| 2. Background and context | 7 mins |
|---|---|
| To start off with, I’m going to ask a few questions about yourself. - names and relationship between interviewees, how long they have known each other Note to moderator: Most of this is covered in the survey for lead participant, therefore the purpose of this is to warm the participant up. Cover briefly for other participant (referred to here as ‘research partner’) to get a sense of their personal context but keep main focus on lead participant. Cover briefly: Can you tell me a bit about yourselves? Probe: - family and home life – who they live with (partner, children), any other caring responsibilities, how long they have lived there - work – brief overview of current job, how long they have been there, if they have more than one job, hours worked each week - work history – number and type of jobs since leaving education, any changes in type of job / sector, any spells not working - benefits they are currently claiming for example, WTC, CTC, HB, IS, JSA, ESA and how long they have been claiming? Any changes in your life recently? Do you expect there to be any changes in the near future? For example, moving house, having a baby, changing jobs, receiving a promotion |
Provides contextual background information about the participant and their lifestyle. |
| 3. Employment | 20 mins |
|---|---|
| Next, we are going to talk about your work. Capture brief description of type of job, role and responsibilities, how long they have been in post and number of hours worked for both - you mentioned that you work [INSERT NUMBER OF HOURS] per week, why is it that you work these hours? Why does this work for you? - if not working – why not? Note to moderator: If they have more than one job, ask about both individually. Why do you do the job(s) you do? Probe: skills, convenience, location, opportunities, childcare, pay - what do you like / dislike? - what were the factors you considered in taking this job? Did you discuss applying for or taking this job with anyone else? If so what did you talk about with them? - research partner: what do you think about [lead participant’s] current job Both: do you ever talk about work together? What types of things do you say? Why do you think you have been in your job for as long as you have? Probe: fits in with childcare, good location, good pay, good opportunities, wanting stability, influence of family / partner. Probe research partner on how important these elements are to the participant / them? Have you taken any action to change anything about your job in the past 12 months? What? Why/ not? [refer back to lead participant survey responses to probe on any types of progression] Probe: what did they do? Why did they do this – what prompted them? What was the outcome? Did they talk to anyone else about this (family / friends) – what did they say? |
| 4. Home life | 15 mins |
|---|---|
| I’d like to talk a bit about your home life and how this interacts with your work. Lead participant: Role and responsibilities at home: Who does what / how does this work /how was this decided on? Do you get any help or support from anyone? What with? Probe on: financial management; childcare; household management (cleaning, cooking); paying bills. What effect does this have on your work? And how you feel about work? How do you support each other? Are there other people you rely on / who help you? What other responsibilities do either you have outside of work? How do these interact with your work? And family life? Those with children: How are your children cared for whilst you’re at work? - why do you use this childcare? What role does the cost of formal childcare play in this decision? Probe to understand role of research partner - who else was involved in the decision to use this form of childcare? Probe: How does this fit around their work? To what extent did work play a role? - what influence does this have on your work? Probe around: hours, how many hours they work, where they work etc. How do you manage your household finances? Probe on budgeting sheets, lists, techniques for keeping track of income and outgoings, monitoring energy use, switching supplier etc and why they use these approaches. - how do you balance the different demands on your household finances? - what role do [INSERT relevant tax credit or housing benefit] or any other benefits play in helping you manage your household finances/ bills - do you ever talk to anyone about this? Collect information on their home life and household dynamics |
| 4. Attitudes towards progression | 15 mins |
|—|—|
| Next, we are going to talk about the near future and what you see for yourself more broadly and in terms of your employment.
Both: Could you tell me about any goals or hopes you have for the near future? IF NECESSARY: This could include getting married, having children, moving house, moving abroad, maintaining stability, changing jobs, getting a promotion, earning more money, building savings, hopes /aspirations for children – educational / work achievement.
- why are these goals important for you? What impact would achieving these have?
- do you know when you would like to achieve these things?
- do you share / talk about these goals with each other?
- ask research partner – if they knew about these before, what they think of these
Both: What does work mean to you? How does it fit with the rest of your family / household requirements? Note to moderator: here we want to understand their work ethic / does work play a big or small role in their life?
Lead participant: If you could change anything about your work what would it be?
Probe – what would be the positives of this – probe income, hours, skills, work satisfaction? And what would be the drawbacks? Probe on effect on family / home life?
Probe:
- change working hours
- increase pay
- more training
- promotion opportunities
- adapt role / responsibilities – how
- working in a different sector or doing a totally different job
What effect would that have on your family and home life? Would there be an impact on how you balance responsibilities at work and home.
Ask research partner: what would this mean for you [if lead participant did this]? How would you feel about this? Would you support it? What would you say to [lead participant] if they said they wanted to change their job?
Lead participant: Why do you feel you haven’t you been able to make these changes yet? Probe:
- availability of opportunities
- constraints of current job (for example, not enough time, precarious contract etc.)
- health / health condition / disability
- availability of opportunities locally / that they can travel to
- childcare
- other caring responsibilities
- skills / qualifications
- confidence / lack of
- comfortable where they are
- partner/ other family commitments / responsibilities
- what could help you make these changes? Probe fully.
- where would you want to get this help from?
- what role could your family and friends play in helping you with this?
- ask research partner: what role could you play in this?
- how would you feel about talking to your current employer about wanting to make these changes? What concerns would you have?
- how would you feel about moving to work for a different organisation?
If they don’t want to make any changes
- what aspects of your current work suit you best?
- is there anything that doesn’t suit you?
- is there anything that would make you want to change your role / job in some way?
What do you know about other jobs available to you? How do you know this?
How would you feel about applying for a different role? Probe around confidence (preparing CV, making application, interview) and capability / know-how
- [IDENTIFY IT LITERACY IN SURVEY DATA] How would you feel about applying for a job online? | |
| 5. Support needs and preferences | 20 mins |
|---|---|
| Next, we are going to talk about what support could help you to progress in work. This could be anything from increasing your pay, increasing the hours you work, getting a promotion / changing role or enrolling in training. Lead participant: How could you go about achieving this [if participant has discussed interest in specific vision of progression, refer to this, if not – to increasing pay, increasing number of hours, getting a promotion, changing role or enrolling in training]? - what would have to happen to make this achievable for you? Probe on: support from employer, support from family / partner / friends, childcare, transport - what would be the steps you’d need to take to doing so? Would there be any drawbacks? - what would be the benefits of making this change? Would there be any drawbacks? - what support do you feel would be most helpful for you in taking the initial steps towards achieving this? Probe: skills / qualifications, opportunities, encouragement (who from?) - who or where would you expect to get support / help from? - what help you would need to achieve this? Probe – family, friends, employer - would anything need to change at home? - research partner: how do you think you could help with this? How would you be able to support [participant]? How might this affect you? Lead participant: How helpful would training at work be in helping you develop new skills? - is this something you have access to in your current job? Is this something you have taken part in? Probe: was this helpful? / do they think it would have been helpful? Explain: DWP are looking into using Jobcentre Plus to support people to progress in work and build confidence and skills. Both: - how do you feel about this? - have you had experiences with Jobcentre Plus in the past? What were your experiences? - how likely would you be to / what would you think / say about [participant] taking up this support? Probe around perceptions of JCP – reasons to / not to visit? How about online support provided by JCP? |
| 6. Universal Credit | 10 mins |
|---|---|
| Lastly, I have a few questions regarding Universal Credit. Both: What do you know about Universal Credit? - where have you got this from? - how do you think Universal Credit will affect you? - how do you feel about this? Explain: All Tax Credit and Working Tax Credit claimants will be moved on to Universal Credit. A key part of Universal Credit is encouraging people to be self-sufficient and not rely on benefits. |
|
| As part of UC you will be required to sign a Claimant Commitment, and this could have some requirements, such as going to t10e Jobcentre for meetings with a work coach to talk about progression, attending a training course or taking other steps to progress. - what do you think about this? Probe: positives and negatives, how does this make them feel / feel about UC? - what effect do you think this would have on you? - how likely would you be to meet these requirements? - what effect would these requirements have on how you felt about progressing in work? IF NECESSARY: that is, increase your hours or pay or get a new job |
This section aims to explore their understanding of Universal Credit. |
| 7. Summing up | 2 to 3 mins |
|---|---|
| We are coming to the end of the interview, but I have a few final questions before we finish. How do you feel about progressing in work now? If there was one thing that could encourage you to progress in work, what would it be? If there was one thing that DWP or wider government could do to support you to progress in work what would it be? Is there anything else you would like to mention that we haven’t had the opportunity to discuss? Thank and reiterate confidentiality. Incentives = a £30 ‘thank you’ from Ipsos MORI for their time and contribution. Explain next steps for the research and close – report will be published at the beginning of 2020. Signpost for further information / if any concerns about discussion: Turn2Us, entitledto, Universal Credit, Citizens Advice |
Brings the conversation to a close, and allows participants time to mention anything that has not already been covered. |
Topic guide: Mini group interviews
Aims and objectives
The Department for Work and Pensions (DWP) has commissioned Ipsos MORI to conduct a piece of qualitative research to investigate people’s experience of work, tax credits and other types of benefits. The purpose of this research is to better understand how DWP can support people who are working and claiming benefits when working age benefits are replaced by Universal Credit. This research consists of 2 stages, the first being a quantitative survey. At the end of this survey, respondents were asked if they would like to take part in a follow-up piece of qualitative research, this being the second stage of the research.
These follow-up groups will explore people’s experiences of in-work progression and what support they need in order to progress. As part of this, participants will be given example interventions to discuss.
Specifically, the aims of this research are:
- to assess awareness of/reaction to in-work support and conditionality and understand how this might influence behaviour around progression
- to inform the development of effective and targeted interventions that can maximise progression outcomes for this group
We will be undertaking 10 mini groups as part of the qualitative stage of this research. This is in addition to 30 individual depths and 30 paired depths.
| 1. Introduction | 5 mins |
|---|---|
| Thank participants for taking part. Introduce self and explain nature of group: informal conversation; gather all opinions; all opinions valid. Interviews should take around 90 minutes. Introduce research and topic – The Department for Work and Pensions (DWP) has commissioned Ipsos MORI to conduct research with people who are working and claiming tax credits and/or other types of benefits so that DWP can understand how it can support people like you in the future when working age benefits are replaced by Universal Credit. We have asked you to join us as you are all claiming (insert benefits). This research aims to understand your experiences of work to inform the design of services to help people earn more and increase their skills. Explain why they have been selected to take part in this research (they have already completed the quantitative interview). Role of Ipsos MORI – Independent research organisation (i.e. independent of government), we adhere to the MRS Code of Conduct. Confidentiality – reassure all responses anonymous and that identifiable information about them will not be passed on to anyone, including back to DWP or any other government department. Consent – check that they are happy to take part in the group and understand their participation is voluntary (they can withdraw at any time). Ask for permission to digitally record – transcribe for quotes, not detailed attribution. Any questions before we begin? |
Orientates interviewee, prepares them to take part in the interview. Outlines the ‘rules’ of the interview (including those we are required to tell them about under MRS and GDPR guidelines). |
| 2. Background and context | 10 mins |
|---|---|
| To start with, please can we go around the group and tell us a little bit about yourself - name, family - who’s at home? What you currently do for employment? And how long have you have been in this role? ICE BREAKER Now, we are going to do a little exercise to get to know one another better. Please could you turn to the person next to you and tell them a little bit about what you have been up to recently. This can include anything relating to your family and home life, your work or any hobbies / interests. Note to moderator: Ask participants to give a brief introduction of the partner they were assigned to in the group. Now, I’d like you to take a post-it and write down any changes or expectations for the near future? ADD IF NECESSARY: This could include getting married, having children, moving to a new house, moving abroad, maintaining stability, changing jobs, getting a promotion, earning more money, building savings, hopes /aspirations for children – educational / work achievement. Note to moderator: Get group to share their goals. - why are these goals important for you? What impact would achieving these have? - do you know when you would like to achieve these things? - is there anyone in your life that you share / talk about these goals with? |
Provides contextual background information about the participant and their lifestyle. |
| 3. Progression and employment | 10 mins |
|---|---|
| Next, we are going to talk about your job and how you have progressed in your employment. Firstly, could you start off by telling me why you do your current job? - how does it fit around your other life responsibilities? - what is it that you enjoy about your job? - is there anything you don’t enjoy? Have you had any skills development / training in the past 12 months or so? - what was it? - where did this support come from? Probe: Employer? Another organisation? - did you seek it out / did someone else suggest it? - how helpful was this support? What opportunities are there for progression / to develop new skills / take on a different (better paid) role in your current job? Probe why there are / aren’t opportunities, how attractive they are, whether they could consider going for them? Has anyone made any steps to change anything about their work in the past 12 months? Probe if necessary: change job, move sector increase hours worked, increase in pay, any promotion or increased responsibility or training. - why did you take these steps? - what was the outcome? - [if anyone hasn’t taken these steps] Why? What would need to change? Probe: Childcare, skills, opportunities, time, health, confidence, IT difficulties, family commitments / responsibilities, location, availability of travel Is there anything that appeals to you about progressing in work in this way? And anything that is holding you back? - what feels like the best way to achieve this type of change? How would you feel about asking your employer for support to develop new skills? And how about increasing your hours? - if not, why? |
| 4. Universal Credit | 5 mins |
|---|---|
| Before we go on to talk about support in more detail we are going to talk a little bit about changes to the benefit and tax credit system. Please feel free to share as little or as much as you like and please remember that everything discussed today will remain entirely confidential. - to start with, what does everyone know about Universal Credit already? Explain: Child Tax Credit, Working Tax Credit and Housing Benefit are gradually being replaced by Universal Credit. One of the aims of Universal Credit is to support people to progress in work and be financially self-sufficient. - did anyone know about this already? Probe: Has this made a difference to anyone’s perception of Universal Credit? - how does this make you feel? - where have you got your information on Universal Credit from? - how do you think Universal Credit will impact you? Probe around work / progressing in work. |
| 5. Support needs and preferences | 60 mins |
|---|---|
| Now, we are going to turn back to employment support. DWP is looking to develop services to support people to progress in their jobs, for example, by helping them earn more money, build their skills or move to a role with better opportunities. - so, to start with how interested would you be in support to help you progress in work? - does anyone have any ideas of what would be most helpful? Next, we are going to go through some hypothetical examples of the types of support that could be provided – we want to know how well you think they would help you to develop new skills and ultimately progress in work. There are 4 examples in total. Note to moderator: hand out print-outs of ideas. 1. Progression Coach What would this involve? Regular face-to-face meetings with a dedicated “progression coach”. Firstly, your coach would establish what your needs are, followed by support to address needs and achieve your goals. This includes providing guidance and encouragement around speaking to your line manager/employer about progression; identifying jobs with better progression opportunities; and referral to registered training to improve your skills. What would be the aim of this? To support people to get further in current job or get new job with better opportunities Where would this take place? At your local Jobcentre Plus - how do you feel about this idea? - how could this benefit you? - what are the drawbacks? - how likely would you be to take this up? What would hold you back from doing so? Probe: capability, opportunity, motivation - have you used Jobcentre Plus previously? What was your experience of this? - how could this be changed to be better suited to you? What would make you more likely to take this up? Explore fully. 2. Skills Action Plan What would this involve? One initial face-to-face meeting with progression advisor, followed by online support. This would include developing your personal learning/skills plan, with guidance on relevant training courses. You would be given a personal budget to spend on training and any associated costs. You would be responsible for enrolling on courses and attending training. What would be the aim of this? To provide guidance and financial assistance for people to address skills needs, to support them to progress in work. |
|
|
Who would supply this service? An employment agency - how do you feel about this idea? - how could this benefit you? - what are the drawbacks? - how likely would you be to take this up? What would hold you back from doing so? Probe: capability, opportunity, motivation - what types of training and development would you be most likely to take up? What skills training would be most useful to you? - how could this be changed to be better suited to you? What would make you more likely to take this up? Explore fully. 3. Work and Family Support What would this involve? Online communication with an advisor from a charity, supporting participants to conduct a personal and family needs assessment. Establishes what support is needed in work and household, and provides referrals to appropriate support (e.g. training, financial/debt advice, housing advice, childcare/caring support). You would then be given a personal budget to spend on training, transport, and childcare. What would be the aim of this? To address personal and household factors which may influence people’s ability to progress in work Who would provide this service? A charity - how do you feel about this idea? - how could this benefit you? - what are the drawbacks? - how likely would you be to take this up? What would hold you back from doing so? Probe: capability, opportunity, motivation - what types of training and development would you be most likely to take up? - what affect do you think it would have for activities like this to consider your household, not just work? How relevant does this feel to you? - how could this be changed to be better suited to you? What would make you more likely to take this up? Explore fully. 4. In-Work Training What would this involve? Training and skills development provided by external suppliers and organised through your current employer. You would be able to access courses relevant to your personal/career development and given time-off to attend. You would work with your current line manager to identify relevant courses and develop personal development plan. Small cash bonuses are paid to employees that complete each course. What would be the aim of this? To support people to get further in their current job Who would provide this service? Current employer / registered training provider - how do you feel about this idea? - how could this benefit you? - what are the drawbacks? - how likely would you be to take this up? What would hold you back from taking this up? Probe: capability, opportunity, motivation - what types of training and development would you be most likely to take up? - how could this be changed to be better suited to you? What would make you more likely to take this up? Explore fully. - now that we have been through all 4 interventions, could you tell me which ones would you be most likely to use? Which intervention would be most helpful to you? Note to moderator: Ask participants to rank from 1 to 4 - for your first choice, how likely, in practice/reality, do you think you’d be to use this service? Ideal intervention The aim of this last task is to explore what the best type of support would be for you. Note to moderator: Give participants cards with ideas for who will provide the support, how often the support will be given, what the content will be and where the support will be given. Ask them to combine these into their ‘ideal support’ probing to understand why this is the case. - who / what will provide the support? Jobcentre Work Coach, employment agency, charity, current employer, registered training provider - probe: do they think the government should be supporting people to progress in their careers? - how often the support will be given? Every 1-2 weeks, every month, every 6 weeks, every 8 weeks, 8 weeks plus, ad-hoc/ when you ask for it - what will the content of the support be? Careers advice, coaching, personal / financial support, training - where would the support be given? Over the phone, online, face to face: library, JobCentre Plus, community centre |
| 7. Summing up | 5 mins |
|---|---|
| We are coming to the end of our discussion today, but I have a few final questions before we finish. If there was one thing that could support you to progress in work, what would it be? Is there anything else you would like to mention that we haven’t had the opportunity to discuss? Thank and reiterate confidentiality. Incentives = a £40 ‘thank you’ from Ipsos MORI for their time and contribution. Explain next steps for the research and close – report will be published at the beginning of 2020. Signpost for further information / if any concerns about discussion: Turn2Us, entitledto, Universal Credit, Citizens Advice |
Brings the conversation to a close, and allows participants time to mention anything that has not already been covered. |
-
Working for an employer (i.e. excluding self-employed claimants). ↩
-
Michie, S., Van Stralen, M. M., & West, R. (2011). The behaviour change wheel: a new method for characterising and designing behaviour change interventions. Implementation science, 6(1), 42. ↩
-
DWP, 2017: GOALS UK’s Step Up and Timewise Foundation’s Earnings Progression and Flexible Career Pathways in Retail: an evaluation. ↩
-
Universal Credit: in-work progression randomised controlled trial. ↩
-
Employment Retention and Advancement demonstration (RR727). ↩
-
Michie, S., Van Stralen, M. M., & West, R. (2011). The behaviour change wheel: a new method for characterising and designing behaviour change interventions. Implementation science, 6(1), 42. ↩
-
Although DWP does not directly administer Housing Benefit, Local Authorities send DWP customer-level data electronically each month via the Single Housing Benefit Extract (SHBE). ↩
-
All research materials are included in Appendix A. ↩
-
All research materials are included in Appendix A. ↩
-
At the 95% confidence interval. ↩
-
A detailed explanation of the weighting approach can be found in Appendix A. ↩
-
In UC lead carers of children under 3 do not fall into ‘Light Touch’, so these households were removed from this analysis. ↩
-
This figure is substantially below the national statistics on childcare, which show that 62% of families with children in England used formal childcare in 2018. See: Childcare and early years survey of parents: 2018. ↩
-
Where respondents have more than one job, these figures relate to their main job. ↩
-
Level 1 (GCSEs of less than A* to C or equivalent, NVQ Level 1), Level 2 (1 A-Level or equivalent, 5 or more GCSEs of grade A* to C or equivalent, NVQ Level 2, BTEC Level 2 diploma or equivalent), Level 3 (2 or more A-Levels, NVQ Level 3, BTEC Level 3 diploma or equivalent). ↩
-
A full description of the variables used in the segmentation is included in Appendix A. ↩
-
Participants were given a list of features of job roles and asked which were most and least likely to encourage them to progress. This process was repeated several times showing different combinations of the features each time. Analysis then allows us to ascertain which features are relatively most and least important in encouraging progression. The statements have been given an importance score out of 100. The higher the score, the more important that feature is. Further detail is given in Appendix A. ↩
-
Although DWP does not directly administer Housing Benefit, Local Authorities send DWP customer-level data electronically each month via the Housing Benefit Extract (SHBE). ↩