Tech Nation Impact Evaluation - HTML version
Published 9 October 2020

© Crown copyright 2020
This publication is licensed under the terms of the Open Government Licence v3.0 except where otherwise stated. To view this licence, visit nationalarchives.gov.uk/doc/open-government-licence/version/3 or write to the Information Policy Team, The National Archives, Kew, London TW9 4DU, or email: psi@nationalarchives.gov.uk.
Where we have identified any third party copyright information you will need to obtain permission from the copyright holders concerned.
This publication is available at https://www.gov.uk/government/publications/tech-nation-impact-evaluation/tech-nation-impact-evaluation-html-version
Executive summary
The UK digital technology (“digital tech”) sector is a substantial and growing part of the UK economy. Its success and that of the wider economy are also closely intertwined as digital technologies are increasingly embedded across all sectors. The UK Government has implemented a broad suite of interventions to support the sector, the Tech Nation (TN) programme among them.
To better understand the impact of this intervention, DCMS commissioned this impact evaluation to obtain:
- a comprehensive review of the outcomes and impacts resulting from the TN programme.
- additional robust quantitative evidence of the impact of these types of interventions to help support future business cases.
TN is composed of multiple initiatives. Some initiatives provide more hands-on support than others, and some initiatives have changed substantially over time. Therefore, we adopted a different evaluation approach for each of four comparable groups of initiatives.[footnote 1]
Instead, we divided the TN initiatives into 4 groups, based on their characteristics and the type of evaluation approach used.
- Group 1 – growth initiatives aiming to help businesses successfully navigate the transition from start-up to scale-up and beyond. These can be evaluated quantitatively and include: Future Fifty, Upscale, and Northern/Rising Stars.
- Group 2 – lighter-touch initiatives including Founder’s Network (a free online network for start-ups and scale-up to collaborate and share knowledge) and Digital Business Academy (a free online teaching platform that offers short-courses teaching digital and business skills). These were evaluated qualitatively.
- Group 3 – this group included the TN Visa scheme, which offers a route into the UK for exceptionally talented individuals from overseas. This initiative required a tailored scenario-based approach.
- Group 4 – this final group includes the TN website, Reports, and Tech Immersion (a course to help participants better understand the UK digital tech sector). These initiatives have evolved substantially in recent years and are best suited to an interim evaluation (of outputs and early outcomes).
Overall, our evaluation suggests that these initiatives are delivering substantial benefits:
- Group 1 – we find that participating in Future 50, Upscale, and Northern/Rising Stars leads to a 14 to 25% increase in the employment of supported businesses 1 to 2 years after they have completed the initiative.[footnote 2] This implies that Group 1 initiatives generate significant additional Gross Value Added (GVA). Future Fifty and Upscale, the two largest initiatives, generate around £11m to £20m, and £4m to £7m respectively, for each cohort of supported firms. However, the data available was not sufficient to assess whether this effect dissipates after 1 to 2 years (because other firms catch-up) or is sustained over the longer-term (because supported firms maintain their advantage and/or continue to grow faster). More recent initiatives (Cyber, Applied AI, and Fintech) are likely to have a similar impact but could not be evaluated directly because they were only introduced in 2018 and 2019 and data on the outcomes of supported firms after their participation in the initiatives is not available yet. This is described in further detail in Section 2.[footnote 3]
- Group 2 – we found qualitative evidence that DBA and Founders Network help their users achieve their goals, often better than available alternatives. We also found that these initiatives could be expanded at relatively low cost and provide benefits to a substantially wider pool of users than their current base. This analysis is summarised in Section 3
- Group 3 – we found evidence that TN runs the scheme cost-effectively, reducing the administrative burden on the Home Office. The scheme provides the only entry route into the UK for a number of highly-skilled migrants. This is summarised in Section 4
- Group 4 – for the Website, the TN reports, and Tech-Immersion, we found clear evidence that each of these initiatives have improved over time. However, we were not able to identify clear evidence of the longer-term outcomes of these initiatives. This is summarised in Section 5.
As part of our evaluation, DCMS also asked for a review of TN’s implementation of past recommendations. Overall, we found that the bulk of previous recommendations have been, or are in the process of being, addressed. A review of the take-up of past recommendations is included in Annex B.
Looking forward, our evaluation suggests additional recommendations for the operation of TN initiatives and for future impact evaluations of TN.
Operational recommendations
- Group 1 – we do not provide any additional recommendations at this time. This is because the evaluation methods employed (econometrics) focus on obtaining robust impact estimates rather than exploring how any impact has been achieved. These methods are therefore less suitable to provide recommendations on how to improve the initiatives going forward.
- Group 2 – a) to formally define intended beneficiaries recognising the varying needs of different user groups and tailoring the offering accordingly and b) to promote these initiatives more proactively with employers and users of other TN initiatives.
- Group 3 – a) to increase awareness of the Visa Scheme through increased overseas marketing and b) to share experience and expertise from developing a visa application platform with other designated competent bodies (DCBs).
- Group 4 – for the Tech Immersion initiative, to ensure that the online component is exploited fully when delivering the course.
- Programme wide – to proactively promote and track linkages between initiatives by, for example, using the EEM network to cross-promote (other) initiatives to current users and their employees.
Evaluation recommendations
- Group 1 – a) to replicate quantitative impact evaluation with updated data, when available so as to expand sample sizes and explore longer term impacts and b) to explore the feasibility of employing Regression Discontinuity Design (RDD) in future evaluations to improve the rigour of the quantitative analysis.
- Group 2 – to revise the logic framework to update the theory of change and help inform future strategy and start to routinely capture data on the characteristics of users.
- Group 3 – to collect more granular data on the cost of running the TN Visa Scheme (including a breakdown of overheads and website costs).
- Group 4 – to ensure that data on use is captured over time as well as increasing the evidence on user characteristics and outcomes (splitting the marketing logic model at initiative level will aid this).
- Programme wide – a) to determine a more accurate allocation of overheads to each of the initiatives to assist future evaluations and b) to update the evaluation framework to produce revised detailed logic models.
1. Introduction and approach
The digital tech sector is a substantial and growing part of the UK economy. It is world-leading. The UK outperforms similarly sized economies to be the fourth largest global contributor to global digital tech scale-up investment, behind the US, China and India.[footnote 4] The success of the digital tech sector and that of the wider economy are also closely-intertwined as digital technologies are increasingly embedded across all sectors.[footnote 5] The UK Government has implemented a broad suite of interventions to support the sector, the TN programme among them. TN received approximately £6.96m in core funding in 2019-20, and it is expected to receive a similar sum in each of next two years.[footnote 6] This grant is intended to help TN:
- grow and support the UK digital tech sector;
- support nascent industries within the digital tech sector; and
- improve connections and linkages between digital tech sector (both across regions and industries)[footnote 7]
DCMS commissioned Frontier Economics to evaluate the TN programme to gain a robust understanding of its impacts and ensure the effectiveness of Government support.
TN was previously evaluated in 2017 but the nature and shape of its support to the UK digital tech sector has undergone several changes since then (and even more so since its creation in 2010). In 2018, TN replaced Tech City UK and Tech North to give the organisation a more UK-wide focus and expand its activities and reach. During this time, several new initiatives were also launched (e.g. the Fintech initiative was introduced in 2018) and existing ones considerably revised, e.g. through format changes and relaunches (e.g. the Website was relaunched, and the DBA restructured in 2018).
DCMS have asked us to provide an updated impact evaluation to reflect the changes to the delivery of the TN programme and fill gaps in the existing evidence base. This included investigating the impact of new or significantly revised initiatives and improving the robustness of existing estimates where possible.
In addition, the evaluation meets the following methodological requirements.
- Where possible, to quantify the impact and economic benefits of TN initiatives.
- The method used to quantify these benefits must provide DCMS with credible and robust estimates to support appraisals and business case development for future (similar) programmes in the digital tech sector.
- Where a quantitative evaluation is not possible, to conduct a qualitative assessment of TN initiatives’ impacts.[footnote 8]
- Where a detailed evaluation is not possible (because, for instance, the initiative is too recent), to conduct an interim evaluation.
- To review how well recommendations from previous evaluations have been implemented.
We identified four initiative groupings reflecting: initiatives’ intended outcomes and impacts; the evidence available; and the type of question that DCMS and TN need answering to understand TN’s current impact and how it could be increased in future.
Quantitative impact evaluation - Appropriate for interventions which are expected to have a significant and measurable impact on firm performance.
- Future Fifty, Upscale and Northern/Rising Stars - evaluated directly using econometric analysis.
- Fintech, Applied AI, and Cyber are not evaluated directly as they have been implemented too recently (since 2018, 2019, and 2019 respectively). However, we report their anticipated benefits.
Qualitative impact evaluation and reach analysis - Appropriate for interventions which are expected to have a diffused impact on a large number of users.
- Digital Business Academy and Founders Network were evaluated by a) drawing on interviews with delivery leads and potential users and b) a survey of existing users.
Scenario-based impact evaluation - Appropriate for interventions where it is difficult to objectively identify the counterfactual. To better understand the net impact of TN, it is useful to compare the status-quo, including the TN intervention, to different theoretical scenarios of what might have occurred, absent the intervention.
- The TN Visa Scheme was evaluated using a bespoke analysis which identified two hypothetical counterfactuals. The analysis drew on desk-based research, an interview with the initiative lead, analysis of monitoring data, and a survey of Visa holders.
Interim evaluation (output and early outcomes) - Appropriate for interventions where there is little quantitative evidence, often because they were introduced relatively recently.
- TN Website, Report, and Tech Immersion were evaluated through interviews with initiative leads and analysis of monitoring data, building on existing evidence for the Website and Report and an initial assessment of Tech-Immersion.
2. Quantitative impact evaluation
Group 1 evaluation summary
-
We use a Propensity Score Matching (PSM) approach to robustly estimate the employment impact of participating in group 1 initiatives.
-
Our analysis uses a unique combination of ONS and Beauhurst data to allow us to identify the most suitable comparator group (with the most similar characteristics) to participating firms.
-
Our analysis finds that participating in Future 50, Upscale, and Northern/Rising Stars leads to a 14 to 25% increase in the employment growth of supported businesses 1 to 2 years after they have completed the initiative.
-
We convert this estimated employment impact into a GVA impact by assuming that the additional workers employed as a result of this growth have shifted from average productivity jobs to higher productivity jobs.
-
Future Fifty and Upscale, the two largest programmes, generate around £11m to £20m and £4m to £7m respectively, for each cohort of supported firms. However, data limitations meant it was not possible to determine:
- the exact timing of the impact (i.e. whether it typically happens after exactly 1 year or exactly 2 years)
- how quickly this effect dissipates after 1 to 2 years from the intervention
- how the effect might differ across initiatives (in particular recent initiatives including Cyber, Applied AI, and Fintech could not yet be evaluated)
- robust cost/benefit ratios. -
Operational recommendation: as our focus was on obtaining robust impact estimates rather than exploring how any impact has been achieved, we do not provide any operational recommendations for these initiatives.
The objective of Group 1 initiatives (Future Fifty, Upscale, Northern/Rising Stars, Fintech, Cyber and Applied AI) is to enable supported businesses to grow faster. Typically, this involves providing firms with hands-on support to successfully navigate the transition from start-up to scale-up (and beyond).
Therefore, to evaluate the impact of Group 1 initiatives, we need to test the hypothesis that supported firms grow more than they would otherwise would have. To do so, we measured growth in number of employees, and estimated this impact using a propensity score matching (PSM) approach. The PSM approach allows us to measure how supported firms performed relative to firms with similar characteristics.
The PSM approach allows us to estimate employment impacts. We then covert these into Gross Value Added (GVA) impacts. To be consistent with HMT guidance on impact evaluation (Green Book - full employment assumption), we assumed that the additional workers employed by TN-supported firms would have been employed elsewhere. However, the new jobs, created as a result of TN support, are likely to generate an increase in the GVA produced by the UK economy. This is because digital tech scale-ups typically generate a higher GVA per worker than the average business in the UK.[footnote 9] We estimate the impact of Group 1 initiatives on UK GVA by multiplying the number of additional jobs by an appropriate GVA per worker differential.
2.1 Data and scope
2.1.1 Data used
To implement the approach described above, we need firm-level data for both supported and non-supported firms including information on: a) employment growth, b) whether or not they were supported, and c) the characteristics of these firms. Information on firm characteristics helps us assess the comparability of supported and non-supported firms.
The analysis brings in variables from a number of different datasets. These are linked together using the firms’ Companies House Reference Number (CRN). The datasets used were as follows.
- TN data. This identifies participant firms, with flags for the different initiatives and years.
- ONS Business Structure Database (BSD) 2012-2018. This dataset covers the vast majority of UK economic activity – all firms that are registered on VAT or PAYE. It gives information on employment and turnover outcomes, as well as sector and geography. The BSD is extracted annually. At the time of our analysis, the most recent BSD available was 2018.
- Beauhurst. This is a database covering high-growth firms that includes rich information on firms’ economic activity, beyond their standard industrial classification codes.[footnote 10] Inclusion in Beauhurst is itself a strong identifier of firms being similar to TN firms. We identified the firms that were most like those participating in TN by applying filters based on age of business (we included firms created between 2003-16), sectors (Tech, professional/business services, media, and retail) and Geography (North, London). Based on these filters, we then extracted a random sample of firms, of which around 1500 could be matched to the BSD data.[footnote 11]
2.1.2 Treatment of initiatives and yearly cohorts in scope
The first significant Group 1 initiatives began in 2014 and run up to the present. Since the latest available BSD data only includes information on firm employment up to (and including) 2018, we can only observe the impact of TN initiatives on post-participation employment for firms that were supported in 2017 or earlier. In practice, this means that this analysis focused on cohorts of firms that participated in the Future Fifty, Upscale, Northern/Rising Stars (and FintechForAll) initiatives before 2018. As Fintech, Applied AI, and Cyber only began in or after 2018, we could not assess their impact directly.
Regardless of the initiative, each yearly cohort of supported firms is relatively small (20-30 firms) so it was not possible to estimate the impact of each intervention separately for each cohort.[footnote 12] Instead, we focused on estimated an average impact on supported firms 1 and 2 years post-participation (t+1 and t+2), based on the performance of all cohorts between 2014 and 2017.[footnote 13]
2.2 Methodology
The objective of the analysis is to estimate the treatment effect of participating in TN initiatives by comparing the performance of participants (i.e. firms) to a credible control group (i.e. non-TN supported firms). Identifying a credible control group is the central challenge (and purpose) of the econometric analysis we propose.
If a suitable control group is identified, then it is possible to disentangle the impact of the treatment (i.e. participating in TN) from the counterfactual – i.e. what would have happened for participants without TN support. Using an appropriate control group is important because it is likely that TN firms would have grown more than the “average” firm regardless of their participation in TN initiatives. Furthermore, simply comparing firm performance before and after TN support is unlikely to be appropriate, as firms’ growth rates typically change over time regardless of participation in growth initiatives (growth typically slows down as firms increase in size).
The control group contains firms of a similar age, sector mix, and size as the TN participating firms. We then compare the outcomes for the two groups. The difference between the two is interpreted as the impact of the initiative: the treatment effect.
2.2.1 Modelling the propensity of receiving support
To identify the right control group of unsupported firms, we use PSM. PSM is a robust statistical method that:
- first, estimates what firm characteristics are important in determining the likelihood of participating in the initiative being evaluated; and
- then, compares supported firms to the non-supported firms that are most similar in terms of the important characteristics identified previously.[footnote 14]
Our analysis includes information on the following firm characteristics:
-
treatment variable: indicator variable indicating whether firms participated in Group 1 initiatives (source: programme data).
- firm characteristics from BSD data:
- size in the baseline year: employment and turnover[footnote 15][footnote 16]
- prior employment growth – difference in employment growth in baseline year compared to 3 years prior to the baseline year
- an indicator identifying if the firm was created in the last 3 years
- sector indicator identifying if the firm is in the (broadly defined) digital tech sector: SIC codes 58-63;[footnote 17]
- regional indicator identifying if the firm is located in the North of England
- age of firm in baseline year
- Firm characteristics from Beauhurst data:
- academic indicator identifying if the firm is an academic spinout[footnote 18]
- accelerator indicator identifying if the firm participated in accelerator[footnote 19]
- sector / buzzword indicator identifying if the firm is classified in Fintech, Media, Retail, Tech / IP[footnote 20]
While there are many more variables on firm characteristics that could have been incorporated, these did not help us identify a robust control group as they were: a) characteristics supported firms did not have (e.g. additional Beauhurst buzzwords), or b) characteristics that were already well-captured by some of the variables included (e.g. an additional buzzword that was heavily correlated with one already included). The choice of variables was informed by a model selection procedure where we first specify the theoretical drivers of relevance (e.g. size, sector, location, history) and then test different variables within that group to identify those with the best explanatory power.
The first stage of the PSM procedure shows that supported firms:
- are more likely than non-supported firms to be located in London
- have participated in accelerators or spinouts
- are primarily in sectors such as Fintech, media, retail, or IP
- tend to be larger than the other Beauhurst firms in the sample
- have grown rapidly prior to joining the initiative[footnote 21]
2.3 Evaluation of benefits to supported firms
2.3.1 Main results
In the second stage of the PSM procedure, each initiative firm is matched with the firms with the closest treatment propensities (‘nearest neighbour’), and the outcomes for the two groups are compared.[footnote 22] We measure firm outcomes as their proportional change in employment (PAYE jobs) 1/2/3 years after the initiative start (this outcome variable is sourced from BSD).[footnote 23]
Figure 1 below shows outcomes for the treatment group (row A) and control group outcomes on rows B and C, with D showing the treatment effect (the difference between treatment and control). Finally, row E describes the statistical significance of the treatment effect - this measures the level of confidence that the observed treatment effect has not come about by chance.[footnote 24] The columns show the results for different time horizons (i.e. years after the baseline).
Figure 1 - Impact on PAYE jobs
| PAYE jobs relative to baseline year (baseline = 100) | Year t+1 | Year t+2 | Year t+3 | |
| A | Treatment - supported firms | 141 | 166 | 174 |
| B | “Raw” control - all unsupported firms without PSM re-weighting | 120 | 135 | 147 |
| C | Control – unsupported firms with PSM re-weighting | 124 | 133 | 151 |
| D | Treatment effect (A/C-1) | +14% | +25% | +15% |
| E | Statistical significance of D | ***(1%) | ***(1%) | (Insig) |
Source: Frontier analysis of ONS (BSD), Beauhurst, and TN data
As expected, we find that supported firms grow over time (row A) and that they grow faster than the “raw” control group of all unsupported firms (row B).
When we compare supported firms to the robust control group identified through PSM, we still find that supported firms grow at a faster rate. For example, after 2 years, the treatment group firms were 66% larger in terms of employment than at baseline, whereas the comparator group were only 33% larger. In short, we find robust evidence of an employment uplift between 14%-25% for supported firms 1 to 2 years after they have participated in a TN Group 1 initiative (Future Fifty, Upscale, or Northern/Rising Stars).[footnote 25]
The estimated effect of TN initiatives three years after participation is not statistically different from zero. However, this may be due to the relatively small sample size used for the t+3 estimation. It is important to bear in mind that the sample composition varies depending on the time horizons. While the t+1 result will include initiatives from 2014 to 2017 and has 131 participating firms in the sample, the t+3 result comes from just the 2014 and 2015 cohorts, and only includes 43 participating firms in the sample.
2.3.2 Robustness and sensitivity analysis
To test the robustness of our results, we checked how well the approach achieves its objective to remove all observed differences between participating firms and the control group.
The most important of these checks involves testing whether treatment and control groups follow “common trends”. If the two groups constructed by PSM are genuinely similar, they should show a similar growth trajectory in the pre-treatment period. In Figure 2 below, we show the growth trajectory of participating firms compared with both the broader control group of all firms in the combined Beauhurst/BSD dataset and the narrower control group estimated using PSM.[footnote 26] As can be seen, over the 3 years prior to joining the initiative, the participating firms increase their employment by a factor of five, whereas the broader control group only double. However, the PSM comparator group shows a very similar growth trajectory to participating firms in the run-up to the baseline year. The control firms then continue to grow after the baseline year, but not as quickly as firms supported by a TN initiative.
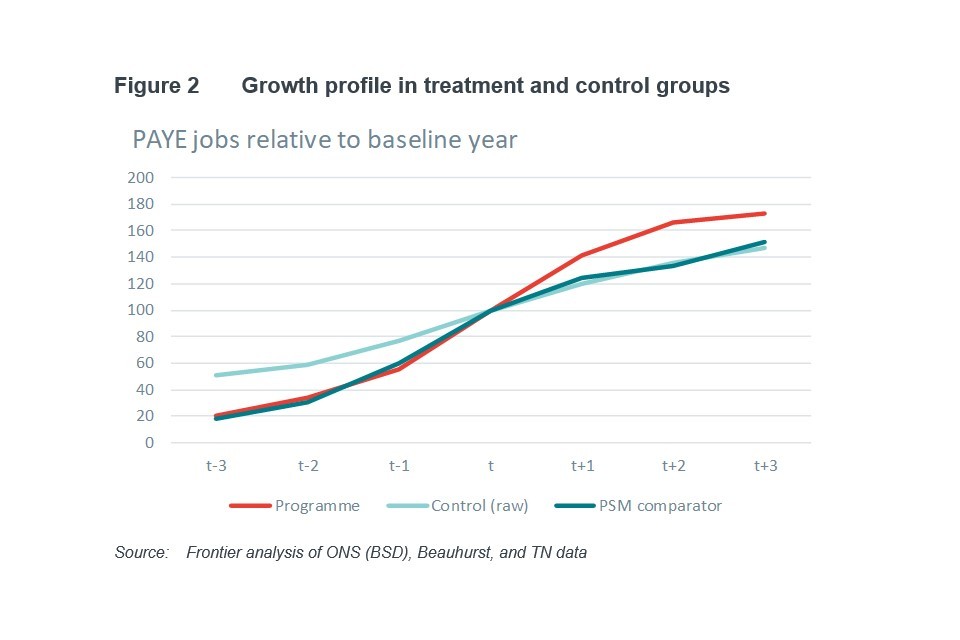
Line graph showing growth profile in treatment and control groups
We also tested whether there are statistically significant differences between the treatment group and the PSM comparator group, along all characteristics observed in our data (this is known technically as the “balancing test”). We find no differences between the two groups for the vast majority of variables, with the only exception the proportion of very young firms (<1 year). This is higher in the PSM comparator (6% vs 1.5%) than in the treatment group.
We also perform a number of additional tests, which are described in more detail in Annex section A.2. These different tests all confirm that our estimates of the impact of TN group 1 initiatives are not driven by observable differences between the treated and control firms (e.g. it is not the case that supported firms were already growing at a faster rate before joining TN initiatives), or by specific modelling assumptions. It is still possible that treated and control firms differ in characteristics that could not be observed or proxied for in our data, and that this explains in part the higher growth rates of firms supported by TN compared to the control group. For example, it could be the case that firms supported by TN are led by more experienced or more ambitious staff.
However, this is a limitation of all quantitative evaluation approaches outside of experimental methods (i.e. methods where control and treatment groups are explicitly randomly assigned or quasi-experimental methods where selection in the treatment group is as good as random) which were not feasible for this evaluation. Despite this caveat, our approach significantly improves on the evidence base existing prior to this project, which relied on participants’ own subjective assessment of the impact of the TN initiatives.
2.3.3 Limitations to the evaluation approach
- Timing of impact - the different TN initiatives can occur at different points in the year and can vary in length (initiatives such as Rising Stars are over a few days, the Upscale initiative over 6 months, and Future Fifty between 6 months and 2 years). By contrast, the BSD PAYE variable is only reported once a year in April (but with information for the latest quarter). We can therefore only approximate the timing between the intervention and the impact measured. For this reason, our key result should be interpreted as a 1 to 2 year effect.
- Benefit longevity - The sample sizes are too small to conclusively identify impacts across multiple years post-participation. Therefore the 14-25% uplift calculated is only the initial uplift in employment following participation in the initiative. This does not mean that there are no benefits accrued in subsequent periods but rather that we do not have enough data to estimate this with precision.
- Differences across initiatives. By disaggregating the data by year/initiative, it becomes more challenging to identify employment effects precisely. A key issue with smaller samples is that it becomes harder to identify a sufficiently similar set of comparator firms. We describe these different cuts in Annex section A.2.3 and, while they all suggest a positive effect, these are less robust, so our preferred main estimate is across all the initiatives. Still, the disaggregated analysis suggests, but do not conclusively show, that the initiatives supporting larger firms (Future Fifty, Upscale) are likely to have, proportionally, lower impacts than those supporting smaller ones. The 25% uplift estimate should therefore be heavily caveated for Upscale and Future Fifty.[footnote 27]
2.4 Estimation of implied GVA impact
The econometric analysis estimates the additional growth in employment that can be attributed to participation in TN. To translate this growth estimate into a GVA impact, we proceed in three steps.
-
We apply the estimated 14-25% range to the average company size at baseline to work out the employment uplift per firm.
-
We then scaled this uplift by the number of firms in each initiative.
-
Finally, we multiply this by the differential between digital sector GVA per worker (£99k) and all sectors GVA per worker (£56k) per worker.[footnote 28] Under the Green Book ‘full employment’ model, there are no jobs to be added; rather the GVA impacts come from assuming that workers shift from lower productivity jobs to higher productivity jobs.
To illustrate the GVA calculation, let us consider the case of Upscale.
In an average year, there are 30 firms with a baseline average size of 23 employees. Using the more conservative 14% uplift estimates (given the caveats noted in sections 2.3.2 and 2.3.3), each cohort (i.e. 30 firms) has around 98 additional workers 1 to 2 years after the initiative was delivered relative to the counterfactual.[footnote 29] This is associated with an aggregate GVA impact of £4.2m in the period 1 to 2 years after the initiative was delivered.
These benefits should ideally be compared with costs. TN have not been able to allocate overheads to different programs precisely, so we have approximated these. For each initiative (e.g. Future Fifty, Upscale, etc.), we have estimated the total average cost per year by summing direct costs plus a pro-rated share of overhead costs. While this is a reasonable approximation, it will partly under-estimate the total cost of initiatives that have low direct costs but high overheads (a further description of the cost methodology is provided in Annex section A.3).
The benefits and costs of the initiatives are shown in Figure 3 below. This compares the GVA impact (i.e. benefits) with the cost per year.[footnote 30] Note that the GVA impact is an annual figure (i.e. each year firms are larger than comparators) but we do not know exactly in which each this effect occurs or how long for (as explained in section 2.3.3). By contrast, the initiative costs are one-off, i.e. they are only incurred in the year the initiative is run for that particular cohort.
Figure 3 Benefits and costs by TN initiative - Group 1
| Average company size at baseline (nb of employees) | Average nb of companies per year | 1 to 2 years post-participation GVA impact (14% / 25% uplift) | Average cost per year | |
| Future Fifty | 84 | 23 | +£11.5m / +£20.5m | £0.5m |
|---|---|---|---|---|
| Upscale | 23 | 30 | +£4.2m / +£7.5m | £0.4m |
| Northern/Rising Stars | 3 | 21 | +£0.3m / +£0.6m | £0.5m |
| Fintech For All | 5 | 61 | +£1.8m / +£3.1m | £0.2m |
| Fintech* | 22 | 22 | +£3.0m / +£5.3m | £0.6m |
| Cyber / Applied AI* | 15 | 46 | +£4.1m / + £7.3m | £0.4m |
Source: Frontier analysis of ONS (BSD), Beauhurst, and TN data
Note: * For Fintech, Cyber, and Applied AI, these are anticipated impacts only and not estimated directly. As BSD 2019 is not available, we’ve use TN’s 2019 participant and company size estimates (company size estimates are reported by firms to TN). (Steps may not sum exactly due to rounding).
Interpretation limits – costs/benefits across TN initiatives
Some caution is needed when comparing relative benefits and costs between initiatives. Because the assumed benefit is calculated as a proportional uplift, and the same value is used across initiatives, this mechanically gives a much larger benefit to initiatives with bigger cohorts and more employees. In light of the caveats described in sections 2.3.2 and 2.3.3, the higher estimate for Future Fifty and Upscale should be treated with even more caution. These caveats, along with the uncertainties around the cost estimates, means that while it would be possible to go further and translate the above figures into cost-benefit ratios, we would not recommend doing so.
While aggregating the cost information across all Group 1 initiatives could help mitigate some of the measurement issues around the allocation of costs, aggregating the benefits across initiatives would present the same issues to an initiative-level analysis, and in particular the issues with using the higher estimates for the Future Fifty and Upscale initiatives.
3. Qualitative impact evaluation
Group 2 evaluation summary
- Group 2 initiatives, the Digital Business Academy (DBA) and the Founders Network, were expected have a diffused, harder to measure impact on their users.
- Therefore, a qualitative impact evaluation using data collected from a survey of users, combined with Tech Nation data, and interviews would be most appropriate. We found that:
- 93% of survey respondents felt that DBA has helped them to achieve their objectives. We also found that respondents felt that the DBA has a number of benefits over alternative resources.
- 50% of survey respondents felt that using the Founders Network helped them achieve their objectives. However, we also find that their use of Founders Network was relatively limited.
- Using results from the survey and interviews with non-users, we identified four set of user characteristics on which benefits were likely to vary:
- the users’ career stage;
- the users’ location;
- the users’ gender; and
- the companies’ stage of growth.
- However, data limitations mean it was not possible to determine:
- the specific outcome that has occurred due to participating in either of these initiatives;
- the extent to which users’ views towards the initiatives changed over time as this could not be reliably captured in a one-off survey;
- the extent to which the survey results are representative of the wider pool of users particularly given the small sample size.
- Operational recommendation: a) to formally define intended beneficiaries recognising the varying needs of different user groups and tailoring the offering accordingly and b) to promote these initiatives more proactively with employers and users of other TN initiatives.
Group 2 initiatives include the Digital Business Academy (DBA) and Founders Network:
- DBA is an online platform offering bite-sized courses to help current and potential founders launching and growing their business.
- Founders Network is a free-to-join tech entrepreneurs’ network that is hosted by TN.
While Group 1 initiatives provide intensive support to roughly 150 companies per year, DBA and Founders Network provide light-touch support to a larger number of users (more than 3,000 per year). The initiatives are light-touch, their aims are far-reaching, e.g. to improve users’ digital skills or to expand collaboration in the sector. This suggests that an econometric evaluation as employed for Group 1 is not appropriate as estimating the individual impact would be hard to do precisely since there are many other factors that are likely to impact on these aims. The impact is also likely to vary significantly from one user to the next depending on their needs, making it harder to estimate reliable average impacts.
These initiatives have non-rival qualities in that the overall cost of providing these services is largely unaffected by the number of users. If DBA and Founders Network are beneficial to users, TN could readily increase its return on investment by expanding them to a wider set of users.
Therefore, our evaluation seeks to understand:
- whether users of DBA and FN benefit from these services; and
- how benefits might vary based on user characteristics.
As a result of this analysis, we also ascertain what additional users could be reached, in principle, by DBA and FN, and how they may benefit from the services.
3.1 Methodology
The qualitative evaluation of the Digital Business Academy (DBA) and Founders Network was conducted drawing on data from three sources:
- TN user data to understand how these initiatives had changed since the previous evaluation;
- a survey of existing users (online survey) to understand the nature and intensity of the user benefit and users’ views on the availability/substitutability of alternatives to these TN programmes; and
- interviews with 7 founders who currently do not use the initiatives. These interviews enabled us to explore the characteristics and needs of potential users.
Figure 4 and Figure 5 outline the key pieces of information we were able to collect from each of these data sources for DBA and Founders Network respectively.
Figure 4: Data collected to evaluate the Digital Business Academy
| Online survey of initiative participants | TN user data | 7 interviews with founders (non-users) |
|---|---|---|
| Key survey question areas: – User characteristics (e.g., employment status, age, qualifications, location, tech sub-sector) – Motivation for signing up (main skills or knowledge needs such as to help launch business) – Use of DBA (number of courses completed, which courses) – Anticipated and realised benefits – Comparison with realised or perceived benefits of similar resources |
– Data on the number of active learners (users who have completed at least 30% of a DBA course) and course completers from Q4 2017 onwards – Analysis (by TN) of Google Analytics data on the number of people visiting the DBA website page (by age and location) – Course rating statistics |
We interviewed founders to explore: – Characteristics of business or individual – Aspirations (grow company, start working in the digital tech sector, start-up a tech business…) – Digital tech sector skills need – Use of other similar resources – Familiarity with TN and DBA – Likelihood to sign up (or ask employees to sign up) to DBA in future and perceived potential benefits of doing so |
Figure 5: Data collected to evaluate the Founders Network
| Online survey of initiative participants | TN user data | 7 non-user interviews with founders |
|---|---|---|
| Key survey question areas: – Member business characteristics and when joined Founders Network – Motivation for joining the network and whether expected benefits have been realised – Usage levels/ most useful aspects – Interaction with other entrepreneur networks and comparison of realised or perceived potential benefits with Founders Network |
– Case study: examples of how Founders Network has generated benefit – Weekly usage data - number of members logging in and posting messages – Member location (from member database) |
We interviewed Founders to explore: – Characteristics of their business – Specific digital tech sector current networking activities and any significant networking needs restraining business growth – Familiarity with TN and Founders Network and likelihood to engage – Perceived benefits of signing up to Founders Network |
3.2 Evaluation of benefit to users
3.2.1 Digital Business Academy
Findings from TN user data
To assess the impact of the Digital Business Academy (DBA), we began by analysing data provided by TN on usage, completion, and ratings.
In 2019, there has been an increase in the number of learners signing up to and completing courses on the DBA. TN measures the number of active learners on the site. An active learner is defined as a user who gets at least 30% of the way through a course in a given quarter. Over 12 months, between September 2018 and 2019, there were on average 2,500 active learners per quarter. This is a 16% increase on the per quarter average in the previous 12 months (2,145 active learners per quarter). An increasing number of users does not necessarily imply that the initiatives have a positive economic impact, but it suggests that the initiatives are achieving their short-term outcomes of reaching a wider audience.
It is encouraging that the user base of DBA is growing while a relatively high proportion of users complete the courses. Since Q3 2018, the share of active learners completing courses (completed at least one course in the quarter) has risen from 15% to at least 20% (see Figure 6).[footnote 31] This uplift coincides with an expansion of the courses available on the DBA. Between September and December 2018, 28 new courses were added to the platform. These courses were shortlisted for the Learning Technologies Awards in the “Excellence in the design of learning content, public and non-profit sector”.[footnote 32]
Looking at completion rates for individual courses, rather than the share of users completing them, the average completion rate for a course on DBA is 30%. In comparison, a recent study by academics at the Massachusetts Institute of Technology (MIT) found that completion rates for online courses run by MIT are as low as 4%. Even courses which have been adapted to enhance completion rates through interactivity only have a 12-15% completion rate.[footnote 33]
DBA courses are highly rated by their users.[footnote 34] The average rating of courses is highly concentrated between 4.5 and 4.8 out of 5. Out of the 85 courses, 73 have an average rating in this range. The lowest average rating for a course is 4.3.
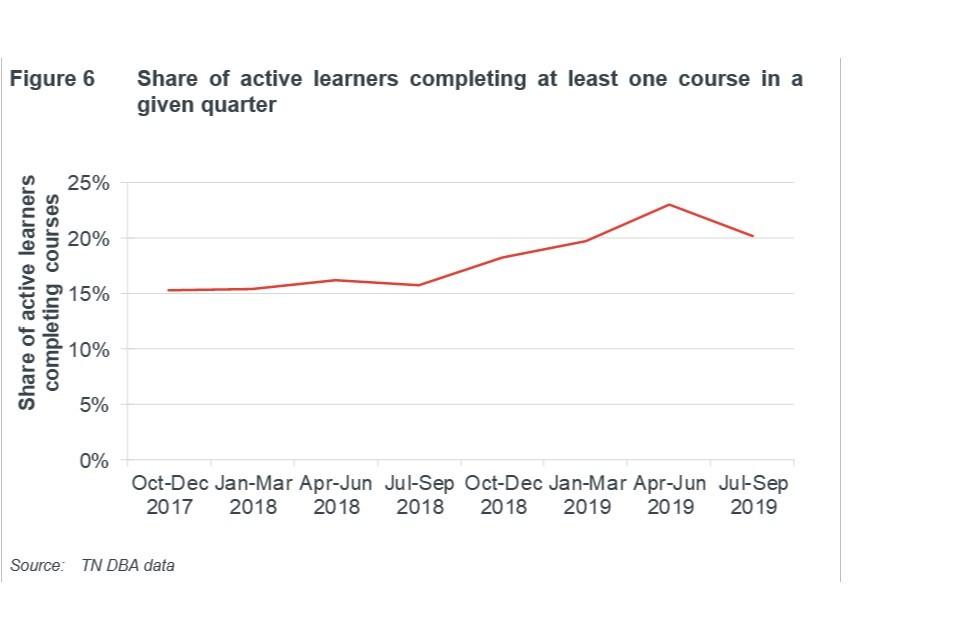
Line graph showing share of active learners completing at least one course in a given quarter
Findings from survey data
The previous evaluation of TN initiatives, performed in 2017, asked respondents the extent to which using DBA changed their views or understanding of digital tech. Respondents were asked six different phrases to assess how DBA had changed their views or understanding. Two examples of these are: “Improved my understanding of one or more aspects of digital business” and “Improved my understanding of what is required to set up/run a digital business”.[footnote 35] Across each of the six phrases used to assess how DBA had changed their views or understanding, between 81% and 94% of respondents said that the DBA had made at least some impact. Our survey finds similar positive results from a sample of 28 DBA users.[footnote 36]
First, 93% of survey respondents indicated that using the DBA helped them to achieve their objective.[footnote 37]
Second, we found that the DBA helped respondents in a number of different ways:
- 39% of respondents said that it helped “Improving their understanding of a specific area of digital tech business”
- 29% of respondents said that it “increased confidence in my ability to launch/grow my digital tech business”
- 29% of respondents said that, as a result of using DBA, they had “implemented new strategies/ways of thinking”
- Moreover, 39% of respondents selected multiple ways in which using the DBA impacted their behaviour or knowledge
Respondents also reported that the DBA had a number of benefits over alternative free of charge resources:
- 82% of respondents selected at least one way in which DBA was better than other free of charge resources
- 54% of respondents selected at least two ways in which DBA was better than other free of charge resources
The most common reasons the DBA was considered better than other free of charge resources was the “overall quality” and the “relevance of the content” both of which were selected by over half of respondents.
Similarly, respondents felt that the DBA had a number of benefits over paid for resources:
- 61% of respondents selected at least one way in which DBA was better than other paid for resources
- 36% of respondents selected at least two ways
- Almost half of respondents (46%) felt that the “relevance of content” on the DBA was better than on other paid for resources
The survey also indicated that some course topics appear to be more impactful than others (see Figure 7). 46% of respondents said that courses on “Marketing and Sales” had a significant impact. In comparison only 14% of respondents said courses on “People” had a significant impact.
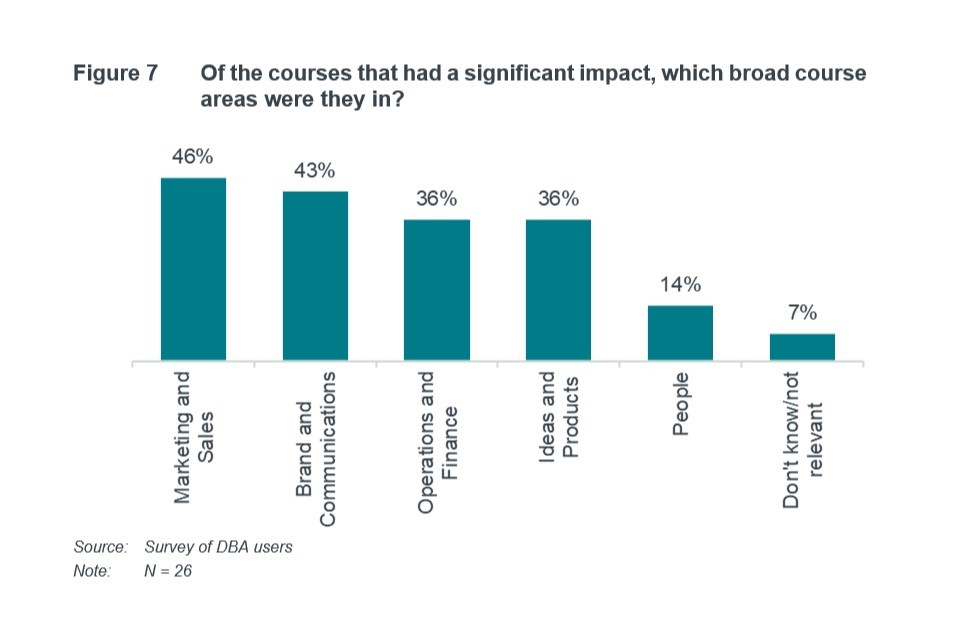
Bar chart showing findings from TN user survey data
3.2.2 Founders Network
Founders Network is TN’s free-to-join tech entrepreneurs’ network. Founders Network’s total membership has steadily increased over the past year. As of 13th November 2019, there were 811 members on Founders Network an increase of 189% since January 2019 when there were only 280 members. The share of members active in the Founders Network fluctuates between ~18% and ~38% and it has not decreased with the expansion of the initiative.
When the previous evaluation of TN initiatives was conducted in 2017, Founders Network was just a Tech North initiative. At the time, there were 232 participants.
After the creation of TN in September 2018, the Founders Network was relaunched. Within 4 months, the number of members surpassed the members of the previous iteration of the initiative. Since then Founders Network has continued to grow.
- 50% of survey respondents said that using the Founders Network helped them in some way to achieve their objectives for joining.
- However, founders also indicated that they don’t tend to use Founders Network regularly with almost half of founders logging into Founders Network less than once a month (49%) and posting even less regularly (63% said they posted or answered a question rarely/never).
- Furthermore, the majority of respondents (67%) said that they use it less than other online entrepreneur networks.
3.2.3 Limitations to the evaluation approach
While the TN data and the survey responses suggest these two initiatives have benefits, it is important to note that the survey results also have a number of limitations.
- A survey provides a snapshot of evidence from a subset of users. It therefore does not capture how user’s views evolve over time.
- Participants in the survey may not be fully representative of all users and therefore the survey will not provide the full picture of the benefits and the areas for improvement. In particular, due to the limited time in the field, the survey results are based on a small sample size (28 for DBA users and 41 for Founders Network users).
- Surveys can be less reliable, more subjective, than tracking actual usage. Respondents may not necessarily have a clear or complete memory of their past behaviour and actions.
Therefore, regular data collection on usage and perceived benefits of a significant sample of users (if not all users) is likely to provide more robust results.
3.3 Characteristics on which user benefit varies
Although precise benefits cannot be calculated, there appears to be benefits derived by users of the DBA and Founders Network. Therefore, given delivery costs are largely fixed, TN could be seeking to increase the number of beneficiaries to maximise its return on investment (i.e. by delivering more aggregate benefit for a similar cost).
For this reason, we supplement our assessment of the initiatives with an analysis of current and potential users. Using results from the survey and seven interviews with non-users, we focused on four key sets of characteristics on which benefits are likely to vary.
The users’ career stage
Our analysis identified 3 types of potential DBA users: founders, employees, and individuals seeking to enter the digital tech sector.[footnote 38]
Each of these users is likely to have different needs. Many individuals working in the digital tech sector are not currently interested in founding a company but may have ambitions to progress their skillset. These individuals would be looking for a different set of courses to founders, for example.
Additionally, there may be individuals that are not currently working in the digital tech sector but considering joining it. The most obvious and largest group being students. Once again, the types of courses which would be helpful to these individuals is likely to be different.
The users’ location
Our analysis identified 2 types of potential businesses/ individuals, which may want to join the Founders Network (FN): those in tech clusters and those outside clusters.
Companies or individuals based in a tech cluster location may be better networked and have access to more resources. However, they may also be experiencing information overload and therefore be looking for more focused initiatives.
In comparison, companies not based in a tech cluster are more likely to struggle to attract tech talent and could also face challenges with networking, particularly given the difficulties in arranging face-to-face meetings. Note that 54% of respondents said that connecting to like-minded entrepreneurs in their region was the main reason they signed up to Founders Network.
The users’ gender
Our analysis also identified that individuals may benefit from FN differently depending on their gender. TN may want to focus more on women and adapt its offer accordingly.[footnote 39]
The challenges faced by women in the workplace are well documented. And, many of these challenges seem to transcend into the tech world, particularly for female founders.
- Many networking environments are male dominated which can often hinder the experience and the value for women.[footnote 40]
- Similarly, women are under-represented in the investor community with women representing only 30% of venture capital personnel in 2019.[footnote 41]
- Research shows that a lot of female founders bootstrap their businesses (i.e. do not seek external funding) which influences the type of help they need.[footnote 42]
The companies’ stage of growth
Finally, and for both FN and DBA, our analysis suggested that start-ups and scale-ups have different needs. Therefore, the benefits they will derive will depend on whether FN and DBA courses are explicitly targeted at them.[footnote 43]
- Start-up companies tend to lack knowledge of the investment eco-system, are unaware of how to find potential collaborators or partners and are often focused on the immediate hurdles in front of them.
- More advanced companies, looking to scale may face growth barriers such as company culture and other people related issues such as HR or employee training initiatives.
4. Scenario-based impact evaluation - Visa Scheme Initiative
Group 1 evaluation summary
-
For the Visa Scheme, we adopted a scenario-based impact evaluation. By comparing the status-quo to different theoretical scenarios of what might have occurred without the scheme, we can begin to demonstrate the benefits that the initiative delivers.
-
We use two counterfactual scenarios:
– Scenario 1: another organisation would become the DCB for the digital tech sector.
– Scenario 2: there would be no “Global Talent” visa scheme for the digital tech sector. -
We developed a set of hypotheses for each counterfactual and tested these through engagements with the Home Office and a survey of the successful visa applicants.
-
We convert this estimated employment impact into a GVA impact by assuming that the additional workers employed as a result of this growth have shifted from average productivity jobs to higher productivity jobs.
-
Our analysis finds two benefits of Tech Nation running the “Global Talent” visa scheme (counterfactual 1). These are:
– enabling applicants who would otherwise be ineligible to apply for a visa, and
– offering flexibility to visa applicants. This is valued by applicants and not available through alternative UK visa routes. -
However, data limitations mean it was not possible to determine:
– the exact amount of cost savings due to Tech Nation running the scheme
– the exact number of additional applications received because TN runs the scheme
– the extent to which the results of the survey are reflective of the wider pool of successful applicants and/or of unsuccessful applicants who could not be contacted. -
Operational recommendation: a) to increase awareness of the Visa Scheme through increased overseas marketing and b) to share experience and expertise from developing a visa application platform with other designated competent bodies (DCBs) in order to generate spill over benefits.
For TN’s visa scheme, we conducted a scenario-based impact evaluation. This type of evaluation is appropriate for interventions where a robust quantitative analysis is not possible. In the case of the visa scheme, it is impossible to track individuals through their careers due to GDPR issues and even with this, identifying the right control group would be extremely challenging. By instead comparing the status-quo to different theoretical scenarios of what might have occurred without TN, we can demonstrate the benefits that the initiative delivers.
4.1 Methodology
The UK has a number of visa schemes to allow people born abroad to come and work in the UK, the “Global Talent” is one of them. To obtain the visa, an applicant must be internationally recognised in their field as a world leader or have demonstrated exceptional promise.
An application for one of these visas must come with an endorsement from one of the Designated Competent Bodies (DCBs). There are six DCBs:
- The British Academy
- The Royal Society
- The Royal Academy of Engineering
- Arts Council England
- UK Research and Innovation for research applicants
- TN
Based on discussions with both TN and DCMS, we identified two counterfactual scenarios of what could have happened had TN not run this scheme.
1. Scenario 1 - Another organisation would become the DCB for the digital tech sector.
We assume that they would have to run the scheme in a similar way to DCBs in other industries. The process of the other DCBs is as follows:
i. The applicant sends their evidence in to the Home Office
ii. The Home Office shares this with the relevant DCB
iii. The DCB assesses the evidence and then advises the Home Office on whether the applicant meets its eligibility criteria and should be endorsed.[footnote 44]
2. Scenario 2 - There would be no “Global Talent” visa scheme for the digital tech sector:
This is a more extreme counterfactual that would require any applicant who wishes to come to the UK to work in the digital tech sector to go through a different visa process. The other visa routes possible are:
i. Tier 1 entrepreneur – Obtained investment to set up or run a business in the UK
ii. Tier 1 graduate entrepreneur – Graduate with an officially endorsed and genuine business idea
iii. Tier 1 investor – £2m+ to invest in the UK
iv. Tier 2 visa – Offered a skilled job in the UK
Through further engagement with DCMS and TN, we developed a set of initial hypotheses about the impact of TN’s involvement in the Visa scheme. We describe these hypotheses and how we tested them below.
Counterfactual 1: Another organisation would become the DCB for the digital tech sector
Under the first counterfactual, we hypothesised that, as a result of TN:
- the cost to the UK taxpayer of the visa scheme is lower due to efficiencies from how they operate the scheme
- there is greater awareness of the Global Talent visa scheme due to the TN brand.
To test these hypotheses, we engaged with the Home Office to understand the difference in costs involved with running the endorsement application of TN compared to the scheme in other industries.
We also conducted a survey of successful visa applicants to gather qualitative evidence on the value of the TN brand in spreading awareness of the scheme. Our survey received 42 responses.[footnote 45]
Counterfactual 2: There would be no Global Talent scheme for the digital tech sector
Under the second counterfactual, we took the hypothesis that there would be fewer highly skilled immigrants in the UK digital tech sector, which would likely have a detrimental impact on the size and growth of the sector and ultimately of the UK economy.
This is because there would be a number of applicants of the Global Talent visa scheme for whom the alternative visa routes are not suitable. This means they would be unable or unwilling to apply for a Visa to the UK.
We also tested this with the survey of the successful visa applicants. We collected data on the number of applicants that would not have been eligible for alternative visas and the number of applicants that were attracted to apply for a UK visa because of the scheme.
4.2 Evaluation of benefit from TN running the visa scheme (counterfactual 1)
4.2.1 TN enables cost savings in running the visa scheme
The evidence we collected supports the hypothesis that there are cost savings resulting from TN running the endorsement scheme. TN processes applications through an online platform which automates multiple steps of the application process and reduces the reliance on paper copies.
Since TN’s online platform was first implemented in 2017, the volume of applications has almost doubled, yet the number of staff (Full Time Equivalents, FTEs) working on the scheme has remained constant. This suggests that TN’s unique approach enables scaling efficiencies. Without the online application platform, it is likely the number of FTEs required would also have needed to increase in order to process all the applications.
Secondly, TN’s platform reduces the involvement required by the Home Office. Unlike the other DCBs, TN has its own portal which means applicants can self-scan their supporting evidence directly to TN. This means the administrative work for the Home Office is reduced as they don’t have to manually process paper copies of supporting evidence.
4.2.2 TN increases awareness of the visa scheme
Responses to our survey also suggest that TN’s involvement encouraged applicants to come to the UK.[footnote 46] Almost half of respondents said that they were motivated to come to the UK by the information they found on the TN website. For instance, one applicant noted:
“TN provided very specific instructions. The other Tier 1 Global Talent endorsement bodies don’t have information that’s quite as clear. Even the UK Government, through its gov.uk website, and the company it contracts immigration out to, aren’t as clear.”
Source: Were there any sections of the Endorsement Application of your Tier 1 Global Talent Visa that were particularly easy? – Survey of successful visa applicants
4.2.3 Limitations to the evaluation approach
Although using counterfactual 1, we find some benefits of the TN visa scheme, it is difficult to robustly quantify the exact amount of cost savings and the number of additional applicants to the scheme enabled by TN.
First, the data available is limited. For example, the data available on costs were not at the level of granularity required to robustly calculate the number of FTEs required to run scheme.
Moreover, we have assumed that the alternative DCB would be similar to DCBs in other industries. Our analysis focuses on the fact that the application process for TN is more efficient than that of other DCBs in other industries. Although this is a reasonable starting point, it is possible that another digital tech sector DCB could also be more efficient than other sectors’ DCBs and so provide information in the way that TN currently does. In short, other sector DCBs are an imperfect proxy for an alternative DCB for the digital tech sector, albeit the best available. This means that even if we had more precise data, any quantification would still need to be heavily caveated.
4.3 Evaluation of benefit from existence of the Global Talent Visa scheme (counterfactual 2)
As previously stated, Scenario 2 is an unlikely counterfactual, but it still provides helpful insights into the value of the Global Talent visa scheme and therefore ultimately into the impact that TN has by supporting this scheme. Applicants to the Tier 1 Global Talent Visa have two alternative visa routes:
- Alternative Tier 1 visa (start-up or innovator) – This requires either £50,000 funding or an endorsed business plan
- Tier 2 visa – This requires your employer to be a licensed sponsor
Using results from our survey we estimate that 50% of applicants to the Tier 1 Global Talent Visa would be ineligible for alternative UK visas. This is the sum of:
- 29% of respondents to our survey who would be ineligible for alternative UK visas[footnote 47]
- 21% of respondents to our survey who would have joined firms that are relatively unlikely to be licensed sponsors[footnote 48]
In 2019, there were 374 endorsed applicants through the TN visa. Assuming 50% of these would have been ineligible for alternative UK visas, we estimate that 187 of these tech migrants would have been ineligible for alternative UK visas and therefore have been unable to come to the UK.[footnote 49]
A key feature of the Tier 1 Global Talent visa is its flexibility (visa holders do not stay with a specific firm throughout their stay in the UK). This flexibility is not available through the alternative UK visa routes. Therefore, without the scheme some of the successful applicants may not have been motivated to apply for an alternative visa. While we are unable to accurately calculate this figure, we can identify the extent to which the flexibility is important to the current group of successful applicants:
- 81% of people said they have used the flexibility that the Tier 1 Global Talent Visa offers.
- The majority (50%) of respondents said being able to work across the UK digital tech sector was the main motivation for applying.
- And over half (52%) of respondents who are currently employees have worked at multiple companies.
A few of the surveyed successful applicants also singled out the benefits of the scheme’s flexibility in their commentary.
“The flexibility is key. I’m currently working with two start-ups and slowly building the network and knowledge to start my own that’s specifically suited to launch in the UK. I don’t see any other pathway that would have allowed me to be in the UK and work that way.”
“To not be beholden to a company for my visa was very important.”
Source: Are there any other reasons that you applied for a Global Talent Visa? – Survey of successful visa applicants
4.3.1 Limitations to the evaluation approach
This approach has its limitations, namely that the survey was limited to successful applicants. By focusing on these individuals, we were able to determine the importance of the scheme, TN’s involvement, and the alternatives available. However, we could not collect the views of unsuccessful applicants who may have additional, and differing, thoughts on the application process.
5 Interim evaluation of the TN website, reports and tech immersion
Group 4 overview
-
For group 4 initiatives, we opted to conduct an interim evaluation by reviewing the logic models and evidence gathered from previous TN evaluations, interviews with programme leads, and an analysis of available data.
-
Our analysis finds that the website continues to increase its audience with the design likely a key contributor. The website also appears to have expanded its international reach.
-
Since the 2017 evaluation, there has been a significant increase in the number of reports being published and their reach also appears to be increasing.
-
Two fully revised Tech Immersion workshops have been delivered to date to 22 attendees overall. User ratings have increased since the programmes revision. However, engagement with the online courses prior to attending the workshop is low.
-
While the evidence available suggests clear improvements, all of these initiatives have significantly altered their offering since the previous evaluation in 2017 so little impact evidence was available.
-
Operational recommendation: the Tech Immersion initiative should try to ensure that the online component is exploited fully.
The previous 2017 evaluation provided an assessment of the short-term impacts of the TN report and website.[footnote 50] Since then, TN has relaunched its website, expanded its report offer and revised the Tech Immersion initiative (which was not included in the last evaluation). As a result, little quantitative evidence is available on medium to longer term impacts of these areas of TN’s offer, so we have conducted an interim evaluation of these three interventions and used this insight to offer recommendations for how these could be fully evaluated in the future (as described in the Executive Summary).
5.1 Methodology
Our evaluation approach was the same across the three interventions.
- Step 1: Review the logic models, metrics and evidence gathered on impacts, from previous TN evaluations.
- Step 2: Conduct in-depth semi-structured telephone interviews with TN report, website and Immersion leads to understand the current offer, changes that have been made over time, current intended benefits (and any observed unintended benefits) and finally to identify relevant internal sources for evidencing impact.
- Step 3: Analysis of data made available by TN and secondary data sources.
5.2 Evaluation of outputs and outcomes of TN’s website
TN relaunched its website in May 2018 to replace the Tech City UK and Tech North websites. The new version intends to clarify the core purpose of TN and we understand there was a conscious effort to address the gender balance on the website.
The available evidence in late 2019 suggests that an increasing number of people are using the website and they may be using this more intensively than in previous years. Since its launch in May 2018 and until late 2019, TN’s website has had over 2.3 million visitors.
- 291,000 users accessed the website in the six-month period to October 2019.
- This represents a 115% increase in the number of users compared with the same period in 2018 and is significantly higher than the 45% annual increase in unique web visits reported for 2016/17 (previous evaluation).[footnote 51]
- Similarly, the number of sessions per user and average session time have increased significantly since May 2018, suggesting that the website is being used more intensively.
Our findings on medium-term impacts, concerning reach, suggest that the website is:
- reaching overseas users (51% of users are based outside of the UK) and so may be contributing to raising UK and international awareness of TN[footnote 52]
- used in majority by people aged 25 to34, but in the 12 months to October 2019 there has been a slight shift towards users aged 35-44, perhaps reflecting TN’s strategy refocus to scale-up (from start-up) support
- the proportion of UK-based male users has remained stable (63% in April-October 2019)
- 76% of users since the website relaunch were based in London and the South East.[footnote 53]
5.3 Evaluation of outputs and outcomes – TN reports
To assess the overall impact of TN’s reports, we have focussed on five recent and significant reports published by TN.[footnote 54] TN 2018 and 2019 (i.e. annual reports on UK Digital tech sector), Bright Tech Future, Tech for Social Good, and the Unicorn Update.
The number of reports produced and the number of people accessing these have increased significantly since 2017:
- TN has added 20 ‘granular’ reports to its report offer.
- the number of unique page views has increased from 145,117 in 2018/19 for the TN 2018 report to 244,945 so far in 2019/20 for the TN 2018 and 2019 reports[footnote 55]
- the 5 reports described above have received 305,700 page views over the last 12 months (exceeding the number of publication views of 260,000 for 2016/17 reported by the previous evaluation).[footnote 56] [footnote 57]
We found evidence that the 5 reports were broadening their international reach (TN’s 2018 report has been accessed by users in over 100 different countries, and the 2019 report in over 60 countries) and 41% of report users were based in the UK regions and 43% were female.[footnote 58] The reports are also informing Government decisions, for example, the findings from the TN2018 report were taken into consideration by HM Treasury when deciding to open a Bristol hub and the Tech for Social Good report was considered by DCMS when launching a technology for social good fund.
5.4 Evaluation of outputs and outcomes – Tech Immersion Initiative
Tech Immersion is a 2.5-hour workshop supported by an online component (six training modules) with the aim to enable large organisations outside of the digital tech sector to better understand the UK start-up and tech eco-system; its core challenges and opportunities; and how engaging with tech start-ups could benefit their organisation.
Since 2018, TN has been working to revise the format of its Tech Immersion initiative to enable a more flexible and engaging delivery that encourages interaction with attendees. The first two fully revised Tech Immersion workshops were delivered this autumn – now, workshop participants are offered six online courses which take 30-40 minutes to complete, followed by a two-hour group workshop.
One of the big changes to the “Tech Immersion” Initiative is the creation of an online component for completion prior to the workshop to improve attendee’s ability to engage. While this is likely to increase the efficiency and effectiveness of the workshops, early feedback from September 2019 suggests TN will need to do more to motivate attendees to complete the modules (as not all attendees signed-up and/or completed all courses).
There is no logic model framework in place for Tech Immersion, or a set of defined short to long term impact evaluation indicators. This, as well as the recent revisions to the initiative, restricted our ability to evaluate it. TN provided us with user rating and Net Promoter Score (NPS) data.[footnote 59] User ratings have increased and NPS meet or exceed TN’s target (of 4.0 out of 5) but are based on very low response rates so we do not provide further detail.
6. Conclusion
Overall, our impact evaluation suggests that Tech Nation’s key initiatives are delivering substantial benefits. Across all groups, and irrespective of the evaluation approached used, we find positive impacts.
- Group 1: our analysis identified a substantial GVA impact 1 to 2 years after participating in Future 50, Upscale, and Northern/Rising Stars. Though not evaluated directly, this suggests the Cyber, Applied AI, and Fintech initiatives could have had a similar impact more recently.
- Group 2: for the Digital Business Academy and Founders Network, we found qualitative evidence that these initiatives help their users achieve their goals, often better than available alternatives. We also found evidence that these initiatives could benefit a substantially wider pool of users.
- Group 3: for the Visa scheme, we found evidence that TN runs the scheme cost-effectively, reducing the administrative burden on the Home Office. The scheme also provides the only entry route into the UK for a number of highly-skilled migrants.
- Group 4: for the Website, the TN report, and Tech-Immersion, we found clear evidence that each of these initiatives has improved over time. We were not able to identify clear evidence of the longer-term outcomes of these initiatives.
Of course, there is always room for improvement and we briefly identify some recommendations for how some of these initiatives might be improved going forward (these are summarised in the Summary boxes at the beginning of each section). Looking forward, there are also several steps TN could take to ensure future evaluations can be as robust, and as comprehensive, as possible.
We summarise recommendations relating to the future evaluation of each group of initiatives in the Executive Summary, but these can be broadly categorised into two main areas:
- Improved and expanded data collection across all initiatives, TN could collect more systematic evidence on the a) the nature of its users, and b) the outcomes they achieve as a result of participating. Both types of evidence will help improve the precision and robustness of future evaluations.
- Updating the theories of change for both the TN programme and its individual initiatives - one of the main challenges to evaluating a programme as multi-faceted as TN, with many diverse initiatives, is to aggregate individual initiative evaluations into an aggregate view. This was not possible for this evaluation and a necessary first step to developing a comprehensive programme evaluation will be to update and expand the programme’s theory of change to reflect the programme’s current focus and objectives.[footnote 60]
Annex A
Supplementary analysis of Group 1 initiatives
A.1 First-stage PSM outputs
In Figure 8 below we show the first stage results from PSM. In each case we are estimating the likelihood of a firm participating in one of the TN Group 1 initiatives depending on the observed characteristics (e.g. size, sector, age, prior growth). The different column groups correspond to estimating impacts 1, 2, and 3 years after the initiative. In each, we show the beta (coefficient), which measures the effect of each variable on the likelihood of being treated, and the p-value, which measures the statistical significance of the effect.[footnote 61]
Note that the more years post-treatment we look at, the more the newer cohorts drop out of the analysis. The mix of initiatives and characteristics of firms in the sample will therefore change. This is why the coefficients for each variable are not identical across the three years. For example, the SIC codes 58-63 dummy (the industrial classification covering computer, audio-visual, and information services) is a stronger driver of propensity in the t+3 run (beta = 0.488) than in the t+1 run (beta = 0.329). This reflects the fact that the participating firms from the earlier cohorts are more heavily weighted towards the SIC 58-63 codes than the more recent cohorts.
Figure 8: First-stage PSM results (dependent variable is propensity for treatment)
| t+1 | t+2 | t+3 | ||||
|---|---|---|---|---|---|---|
| beta | p-value | beta | p-value | beta | p-value | |
| Academic spinout dummy | 0.633 | 0.048 | 0.522 | 0.217 | 0.651 | 0.239 |
| Accelerator dummy (Beauhurst) | 0.523 | 0.004 | 0.757 | 0.000 | 1.282 | 0.000 |
| Fintech dummy | 0.955 | 0.000 | 1.022 | 0.000 | 1.185 | 0.000 |
| Media dummy | 0.312 | 0.053 | 0.414 | 0.024 | 0.465 | 0.070 |
| Retail dummy | 0.622 | 0.000 | 0.483 | 0.015 | 0.630 | 0.025 |
| Tech / IP dummy | 0.765 | 0.000 | 0.656 | 0.000 | 0.831 | 0.001 |
| North dummy | -0.289 | 0.073 | -0.358 | 0.066 | -0.051 | 0.839 |
| Age (years) at baseline year | -0.063 | 0.000 | -0.055 | 0.003 | -0.050 | 0.036 |
| SIC 58-63 dummy | 0.329 | 0.014 | 0.312 | 0.049 | 0.488 | 0.032 |
| Log employment at baseline year | 0.452 | 0.000 | 0.504 | 0.000 | 0.343 | 0.004 |
| Log turnover at baseline year | 0.112 | 0.011 | 0.107 | 0.040 | 0.243 | 0.004 |
| Employment growth in 3 years preceding baseline | 0.310 | 0.000 | 0.259 | 0.004 | 0.229 | 0.044 |
| Firm < 3 years old | 0.337 | 0.076 | 0.399 | 0.071 | 0.092 | 0.767 |
| Constant -4.013 | 0.000 | -4.282 | 0.000 | -5.457 | 0.000 | |
| R2 | 0.36 | 0.38 | 0.45 | |||
| N | 1231 | 1095 | 961 |
A.2 Sensitivity analysis
In this section, we present a number of adjustments to the approach to see how the results change, and whether there is any obvious difference in effect from the various initiatives or cohorts. The following sensitivities are considered:
- Regression analysis instead of PSM.
- Different outcome variables.
- Cuts by initiative type and cohort.
A.2.1 Regression analysis
Here we estimate the outcome in question (employment growth 1, 2 and 3 years after the baseline year) as a function of firm characteristics. The approach uses exactly the same data and variables as PSM.
The regression approach directly estimates how each of the various firm characteristics affect performance, e.g. smaller firms grow more quickly than larger firms, some sectors grew quicker than others, etc.
We include a dummy variable for the participating firms, which measures the treatment effect. This estimates how much more or less this group of firms grow, controlling for the other characteristics. The TN initiative dummy is associated with PAYE jobs 23% higher at t+2.[footnote 62] Overall, the range of impacts are closely in line with those estimated by PSM. Treatment effects range from 13% to 26%.
Other variables with consistent effects include academic spinout, Tech/IP dummy, size at baseline, new firms and prior growth. Interestingly, we see that the growth in turnover (log turnover) at baseline has a positive effect, but the growth in employment (log employment) at baseline has a negative effect. Taken in conjunction, this suggests that firms with higher turnover per employee are stretched and subsequently need to grow their employment. The exact same covariates have been included as in PSM for consistency, but positive significant impacts of a similar magnitude are also obtained in more parsimonious (i.e. with fewer variables) specifications.
Figure 9 Regression results (dependent variable is change in log PAYE jobs x years after baseline)
| t+1 | t+2 | t+3 | ||||
|---|---|---|---|---|---|---|
| beta | p-value | beta | p-value | beta | p-value | |
| TN initiative dummy | 0.120 | 0.001 | 0.203 | 0.001 | 0.228 | 0.049 |
| Academic spinout dummy | 0.113 | 0.177 | 0.199 | 0.063 | 0.236 | 0.050 |
| Accelerator dummy (Beauhurst) | 0.113 | 0.038 | 0.144 | 0.106 | 0.005 | 0.977 |
| Fintech dummy | 0.073 | 0.251 | 0.118 | 0.274 | 0.230 | 0.115 |
| Media dummy | -0.012 | 0.743 | -0.097 0.081 | -0.080 | 0.259 | |
| Retail dummy | -0.016 | 0.666 | 0.050 | 0.365 | 0.017 | 0.816 |
| Tech / IP dummy | 0.102 | 0.000 | 0.134 | 0.001 | 0.129 | 0.013 |
| North dummy | -0.056 | 0.057 | -0.070 | 0.061 | -0.042 | 0.387 |
| Age (years) at baseline year | 0.005 | 0.428 | -0.004 | 0.220 | -0.005 | 0.246 |
| SIC 58-63 dummy | -0.028 | 0.355 | -0.057 | 0.193 | -0.079 | 0.174 |
| Log employment at baseline year | -0.085 | 0.000 | -0.167 | 0.000 | -0.216 | 0.000 |
| Log turnover at baseline year | 0.063 | 0.000 | 0.100 | 0.000 | 0.122 | 0.000 |
| Employment growth in 3 years preceding baseline | 0.059 | 0.000 | 0.065 | 0.008 | 0.081 | 0.030 |
| Firm < 3 years old | 0.235 | 0.000 | 0.217 | 0.000 | 0.298 | 0.000 |
| Constant | -0.212 | 0.002 | -0.092 | 0.286 | -0.080 | 0.479 |
| R2 | 0.097 | 0.133 | 0.134 | |||
| N | 1231 | 1095 | 961 |
Source: Frontier analysis of ONS (BSD), Beauhurst, and TN data
A.2.2 Alternative outcome variables
The reason for using the ‘PAYE jobs’ measure of employment is that it is considered to be the most timely outcome measure available in the BSD. Other outcome variables available in the BSD are:
- Employment. This data is extracted from the IDBR, from where it is collated from a number of different sources, including the Business Register Employment Survey (BRES), PAYE, or imputed from turnover data. There can be significant time lags. The risk is that instead of measuring outcomes after the initiative, we may in fact measure them during or before.
- Turnover. This also comes from the IDBR and is prone to the same time lags as Employment. To partly account for these lags, and to reflect that this data will typically relate to the previous year, we have re-profiled the data in the required manner.
These outcome variables all show participating firms outperforming the PSM comparator by some stretch. However, given the timing issues noted above, we consider that more weight should be placed on the PAYE results.
Figure 10 Size relative to baseline by outcome measure and group
| Outcome | (A) Participating firms | (B) Control (raw) | (C) PSM comparator (D) Difference (A/B-1) | Significance | |
| Employment t+1 | 143 | 117 | 103 | 39% | *** (1%) |
| Employment t+2 | 160 | 138 | 109 | 46% | ***(1%) |
| Employment t+3 | 167 | 152 | 129 | 29% | (insignificant) |
| Turnover t+1 | 140 | 118 | 99 | 42% | ** (5%) |
| Turnover t+2 | 195 | 141 | 136 | 43% | *(10%) |
Source: Frontier analysis of ONS (BSD), Beauhurst, and TN data
A.2.3 Results by cohort and initiative
As described in Section 3, we would ideally have conducted the quantitative analysis separately for each initiative and in each year. In practice however, limited sample sizes make it challenging to estimate such disaggregated effects with precision.
Still, and as part of this evaluation, we sought to use our approach to explore whether:
- changes in initiative delivery and design have had any impact; and
- there is a more (proportional) impact on firms of different sizes (and growth stages).
In order to maximise sample sizes, we focused, for this disaggregated analysis, on growth in PAYE jobs 1 year after the baseline (initiative start date). The same PSM approach and dataset is used.
We find that:
- Effect sizes are larger if looking at the competition-based initiatives. However, it is likely that competition winners are, by definition, a stronger business proposition. This may be the primary reason for their growth, rather than the causal impact of partaking in these competition-based initiatives. Ideally, this would be addressed by conditioning on prior growth trajectory. However, most competition winners are very new, and there is insufficient history on which to distinguish competition winners from new firms with less growth potential (but with the same observed characteristics).
- The treatment effect appears slightly larger for the 2017 cohort than earlier cohorts. This could reflect changes in initiative delivery, or a different mix of business and initiatives appearing in that year (i.e. the competition-based initiative FintechforAll only happened in 2017).
Overall, the additional results suggest that our overall finding - participation in TN initiatives results in a positive employment impact – is not driven by a specific initiative or set (cohort) of participant firms.
Figure 11 Size relative to baseline by outcome measure and group
| Initiative / cohort | (A) Participating firms | (B) Control (raw) | (C) PSM comparator | (D) Difference (A/B-1) | Significance |
|---|---|---|---|---|---|
| Future Fifty / Upscale | 140 | 120 | 125 | 12% | ** (5%) |
| Pitch-based initiatives | 170 | 120 | 133 | 28% | ** (5%) |
| 2014-2016 cohorts | 137 | 120 | 126 | 9% | * (10%) |
| 2017 cohorts | 141 | 120 | 121 | 17% | *** (1%) |
Source: Frontier analysis of ONS (BSD), Beauhurst, and TN data
A.3 Cost analysis
This section provides further detail on how costs have been allocated to initiatives in the ordinary course of business, TN only records the direct cost of each of its initiatives. In practice however, these direct costs do not fully reflect the total cost of these initiatives as they do not include the central costs necessary to run them. For instance, they do not include the wages of the initiatives’ managers.
To more fully reflect the total cost of these initiatives, it is therefore necessary to re-allocate these central costs to each initiative, thus giving a full allocation of costs. To do this, we estimate the total cost of each initiative as its direct cost plus a proportion of central costs equal to its share of total direct costs.[footnote 63]
To illustrate this methodology:
- if the cost of initiative X was £100k and total direct costs across TN were £1m, initiative X’s share of direct costs would be 10%;
- if total central costs across TN were £2m, then the reallocated costs to this initiative would be 10%*£2m = £200k;
- therefore, the estimated total cost of the initiative would then be £100k + £200k = £300k.
In order to perform this calculation, we relied on the original raw cost data provided by TN, including all direct costs and central costs. From this, we estimated total costs using the steps described above.
For comparison with GVA benefits, we provide an average estimate across all years as our main results were also derived across multiple years. As the raw cost data is only available for financial years but initiatives typically happen in calendar years, averaging also makes estimates more comparable.
Following conversations with TN, it was agreed that these estimates provide a reasonable, and transparently calculated, first pass approximation of the total cost of each initiative.
However, there is a major caveat: this method will inflate costs if we know there are high direct costs, but low central resource used to deliver the initiative. Conversations with TN have revealed that both the Visa Scheme and DBA have relatively high direct costs (the former has high direct costs to fund the independent review process, the latter to develop and upload new courses). But they require relatively few central resources (on Visa Scheme, see Group 3 analysis for further detail). However, this methodology assumes these two initiatives require a large proportion of central resources. In other words, the methodology is likely to over-estimate the total cost of these initiatives and, correspondingly, is likely to underestimate the cost of delivering the remaining initiatives.
To improve on these estimates would require more intensive engagement between TN, DCMS, and an external partner (for independent validation) to develop a more bespoke methodology to re-allocate central costs. We would recommend for this work to be conducted between this and future evaluations.
Raw cost data is provided in Figure 12. The total direct costs line at the bottom is what we use to re-allocate central costs across initiatives. Note the following points:
- Website costs are within central costs and not reported separately.
- As of this year, Tech Immersion is no longer funded through the public grant.
- ‘Other’ initiatives were not considered in this evaluation so are not disaggregated. Within this category are activities such as published research (excluding the TN report), pilots, and investments initiatives.
Figure 12 TN direct cost data
| Initiative | FY14-15 | FY15-16 | FY16-17 | FY17-18 | FY18-19 |
|---|---|---|---|---|---|
| Future 50 | 343,344 | 205,576 | 154,977 | 170,239 | 111,926 |
| Upscale | 0 | 87,498 | 146,358 | 208,264 | 104,829 |
| Northern Stars | 0 | 171,130 | 238,209 | 178,974 | 0 |
| Rising Stars | 0 | 0 | 0 | 0 | 153,499 |
| Applied AI | 0 | 0 | 0 | 0 | 23,346 |
| FintechforAll | 0 | 0 | 0 | 95000 | 0 |
| Fintech | 0 | 0 | 48,965 | 137,440 | 182,576 |
| Cyber | 0 | 0 | 0 | 0 | 79,416 |
| Founders’ Network | 0 | 0 | 160,927 | 87,392 | 65,829 |
| DBA | 492,177 | 428,860 | 221,797 | 305,223 | 122,303 |
| Visa Scheme | 0 | 24,449 | 98,426 | 124,576 | 214,850 |
| TechImmersion | 0 | 0 | 57,004 | 6,324 | - |
| Website | - | - | - | - | - |
| TechNation Report | 0 | 199,984 | 174,905 | 216,163 | 122,702 |
| Other initiatives | 212,956 | 637,351 | 444,139 | 267,377 | 291,130 |
| Central costs / overheads | 1,459,531 | 2,353,849 | 2,409,526 | 2,772,181 | 4,026,517 |
| Total direct costs | 1,048,477 | 1,754,848 | 1,745,709 | 1,796,972 | 1,472,407 |
| Total cost of TN | 2,508,008 | 4,108,697 | 4,155,234 | 4,569,153 | 5,498,924 |
Source: Frontier analysis of TN data
To reallocate central costs, we first estimate the proportion of total direct costs accounted for by each initiative. The shares are shown in Figure 13 below.
Figure 13 Shares of direct cost by initiative
| Initiative | FY14-15 | FY15-16 | FY16-17 | FY17-18 | FY18-19 |
|---|---|---|---|---|---|
| Future 50 | 33% | 12% | 9% | 9% | 8% |
| Upscale | 0% | 5% | 8% | 12% | 7% |
| Northern Stars | 0% | 10% | 14% | 10% | 0% |
| Rising Stars | 0% | 0% | 0% | 0% | 10% |
| Applied AI | 0% | 0% | 0% | 0% | 2% |
| FintechforAll | 0% | 0% | 0% | 5% | 0% |
| Fintech | 0% | 0% | 3% | 8% | 12% |
| Cyber | 0% | 0% | 0% | 0% | 5% |
| Founders’ Network | 0% | 0% | 9% | 5% | 4% |
| DBA | 47% | 24% | 13% | 17% | 8% |
| Visa Scheme | 0% | 1% | 6% | 7% | 15% |
| TechImmersion | 0% | 0% | 3% | 0% | |
| Website | |||||
| TechNation report | 0% | 11% | 10% | 12% | 8% |
| Other initiatives | 20% | 36% | 25% | 15% | 20% |
| Total direct costs | 100% | 100% | 100% | 100% | 100% |
Source: Frontier analysis of TN data
Adding together the direct costs and allocation of overhead costs gives the estimates of total cost by initiative:
Figure 14 Fully allocated costs by initiative
| Initiative | FY14-15 | FY15-16 | FY16-17 | FY17-18 | FY18-19 |
|---|---|---|---|---|---|
| Future 50 | 821,296 | 481,323 | 368,885 | 432,865 | 418,005 |
| Upscale | 0 | 204,863 | 348,369 | 529,553 | 391,500 |
| Northern Stars | 0 | 400,674 | 567,000 | 455,077 | 0 |
| Rising Stars | 0 | 0 | 0 | 0 | 573,264 |
| Applied AI | 0 | 0 | 0 | 0 | 87,190 |
| FintechforAll | 0 | 0 | 0 | 241,556 | 0 |
| Fintech | 0 | 0 | 116,550 | 349,469 | 681,856 |
| Cyber | 0 | 0 | 0 | 0 | 296,593 |
| Founders’ Network | 0 | 0 | 383,048 | 222,210 | 245,848 |
| DBA | 1,177,311 | 1,004,107 | 527,933 | 776,090 | 456,760 |
| Visa Scheme | 0 | 57,243 | 234,278 | 316,759 | 802,390 |
| TechImmersion | 0 | 0 | 135,685 | 16,080 | 0 |
| Website | 0 | 0 | 0 | 0 | 0 |
| TechNation report | 0 | 468,231 | 416,319 | 549,636 | 458,249 |
| Other initiatives | 509,401 | 1,492,256 | 1,057,166 | 679,858 | 1,087,270 |
| Central costs | reallocated | reallocated | reallocated | reallocated | reallocated |
| Total cost of TN | 2,508,008 | 4,108,697 | 4,155,234 | 4,569,153 | 5,498,924 |
|---|
Source: Frontier analysis of TN data
Annex B
Take-up of past recommendations
Figure 15 presents the recommendations of the previous evaluation alongside Frontier’s assessment of the extent to which these have been addressed by TN.
Figure 15 Summary of TN’s take-up of the 2017 evaluation recommendations
| Issue | 2017 recommendations | Frontier assessment |
|---|---|---|
| Strategy and Delivery outside of London | – Develop clear objectives relating to their strategic ambitions – Develop its intent and an approach to developing the digital tech sector outside of London, bearing in mind what can be realistically delivered. |
TN are aware that the wider ecosystem already caters strongly for early stage start-ups but there is a gap in help and advice for scaling firms. – Therefore, across TN’s initiatives, there has been a concerted effort to target firms at a slightly more advanced stage of their growth. This includes adjusting the criteria and the offering on the growth initiatives and increasing the scope of DBA courses to target existing founders. – A key objective for TN is to ensure the initiatives reflect the whole nature of the UK tech market. The introduction of the Entrepreneur engagement mangers (EEMs) located in 11 regions around the UK is a core initiative which helps to achieve this. – Other initiatives also try hard to overcome a London focus, for example the Rising Starts competition sees three companies get shortlisted from each region despite the fact that there are many more companies applying from London. Assessment: Addressed |
| Branding | – TCUK should review its various brands to ensure coherence and prevent any confusion | – The creation of TN, a unification between TCUK and Tech North ensures a coherence and prevents brand confusion. Assessment: Addressed |
| Operations – cross cutting | – Ensure greater consistency in engagement with stakeholders – Includes addressing issues of staff turnover. – Take greater advantage of the existing landscape for business development, by linking businesses in the sector to other existing initiatives such as those relating to export advice or access to finance. |
– To ensure more consistency with stakeholders, TN has just written a “playbook” which details how each of the initiatives are run. This is given to new starters to help smooth the handover process. EEMs (who have significant contact with stakeholders) record every contact with or stakeholder meeting to ensure continuity. – Staff turnover is inevitable for an organisation that hires young employees. To help reduce turnover rates, TN now informs candidates that they expect them to stay in the job for at least 2 years. – A key role of the EEMs is to inform founders on the wider support eco-system. Each region also has a dedicated webpage page provides an independently compiled list of where to go to for financing, co-working spaces, meet-ups, etc.[footnote 64] Assessment: Addressed |
| Operations – business lifecycle (growth initiatives) | – International scope for Upscale – Sessions could be better targeted – NB: other recommendations are no longer relevant |
Cyber, Fintech, and Applied AI all have international trips. Recent Upscale cohorts have not but this is planned for future ones (and ‘international’ session). – The nature of the courses has changed substantially with fewer courses, more targeting of C-suite (not just CEOs), and new sector-specific initiatives. Assessment: Partially addressed with further plans already in place to address the recommendations |
| DBA | – TN should consider the scope of the course subjects | – In September- December 2018, 28 new courses were added specifically targeting early stage and scaling founders. – This was intended to complete the original 56 courses which were primarily aimed at aspiring founders. – These courses were recently shortlisted for the Learning Technologies Awards in the ‘Excellence in the design of learning content, public and non-profit sector’. Assessment: Addressed |
| DBA | – TN should consider rewards for completing the courses and engaging with employers to promote the value of DBA courses. | – TN have partnered with a variety of companies to provide rewards for completing courses. Some examples include a week’s desk space at Launch 22, 10% off an economist subscription, or fast-tracked loan applications with Transmit Start-ups. – Learners are encouraged to share their certificates on LinkedIn. However, there has not been an active attempt to raise the awareness of the certificates with employers. Our interviews with founders confirmed this as none of them had previously heard of DBA. Assessment: Mostly addressed although room for more engagement with employers |
| DBA | – TN should consider how the DBA is linked to their other initiatives | – Upscale and Founders network were collaborated with to create the 28 new courses. – The Upscale initiative and Founders Network have also shared the courses with their members leading to some overlap of people who are registered on DBA and also on another initiative. – However more can be done to spread the awareness of DBA courses with participants on the other initiatives as made clear in our interviews with founders. Assessment: Some collaboration to develop the courses, but more cross promotion could be useful |
| Monitoring and evaluation data | – Data to be consistently captured over time – A greater focus on intended outcomes – A balance between economic and non-economic indicators (profile and networks) |
– Historically TN has been predominantly output rather than outcome focused. TN has suggested this is mainly due to the difficulty in measuring outcomes but also partly due to the short term thinking that arose given their reliance on year on year funding from Government. – Now that TN has longer term funding they are able to focus more on longer term outcomes. For example, they are currently building an alumni platform to collect alumni performance data. – There is still room for improvement in this area. A clear link between the overall strategy or initiative specific objectives and KPIs is sometimes missing. So, designing a more systematic framework to collect outcomes and impact data would be useful. – TN has made significant changes to its initiatives over time. From an evaluation perspective this creates challenges as progress becomes harder to track and comparisons cannot be like for like. Greater initiative consistency over time would improve the robustness of future evaluations. Assessment: Partially addressed with room for further improvement |
Source: Frontier analysis and SQW, Tech City UK Impact Evaluation Final Report to the Department for Digital, Culture, Media and Sport, October 2017
-
For this evaluation it was agreed that not all initiatives would be evaluated to allow for a more granular approach. Whilst this is not a programme wide evaluation, this project gives a robust overview of TN impacts. ↩
-
The available evidence is not sufficient to say with high confidence whether the observed growth in employment happens primarily in the first or second year after participation. We therefore only provide a 1 to 2 year range. ↩
-
This work was produced using statistical data from ONS. The use of the ONS statistical data in this work does not imply the endorsement of the ONS in relation to the interpretation or analysis of the statistical data. This work uses research datasets which may not exactly reproduce National Statistics aggregates. ↩
-
In 2015-18 the UK raised 5.2% of total tech scale-up investment (In comparison, UK GDP is 2.2% of global GDP). ↩
-
This figure was provided by DCMS. ↩
-
Tech Nation Delivery Plan 2019-20 ↩
-
This can happen for several reasons: the outcomes of the initiative may be difficult to measure quantitively; the size of the effect on individual users could be small; the total number of users could be small; and/or It may be challenging to identify a credible control group against which the performance of participants can be quantitatively compared. ↩
-
A digital business generates £99k GVA per worker, compared to £56k for non-digital businesses, according to DCMS economic estimates (2018). ↩
-
Beauhurst is a searchable database of the UK’s high-growth companies. ↩
-
Although the Beauhurst extract covered around 4k firms, many were very new and not included in the 2017 BSD (latest possible baseline year), so our estimation sample (with sufficient BSD and Beauhurst data points) covered roughly 1,500 firms with information from both BSD and Beauhurst. ↩
-
While robust, one of the downsides to econometric analysis is that it is ‘data-hungry’ and requires many observations to estimate an average effect with precision. Exactly how many observations are necessary will vary (based on the size and consistency of effect) but, in this case, the economic analysis could not estimate effects with precision for each yearly cohort of a particular initiative. ↩
-
Since the bulk of firms that ultimately get analysed are centred around the 2015 cohort, this year is used as baseline for the control group. ↩
-
PSM is ranked as a robust method 3 (out of 5) on the Scientific Maryland Scale (SMS). ↩
-
For treated firms, the ‘baseline year’ is the year closest to which they joined the programme. For the control group, 2015 is used as the baseline year, as this corresponds most closely to the baseline year for treated firms. ↩
-
These are expressed in logarithms, in order to reduce the effect of outlying observations on the analysis. ↩
-
SIC codes 58-63 include a wide range of firms focused on information and communication technology and services as well as computer programming. SIC codes are used by the Office for National Statistics to broadly identify sectors. ↩
-
A spinout is an action whereby an institution splits off a section as a separate business, typically based on a strand of research or intellectual property. ↩
-
Beauhurst contains information on accelerator attendances. Note that only a subset of Tech Nation firms is flagged as accelerated in Beauhurst, so the variable only captures the more visible instances ↩
-
Beauhurst includes many different flags for whether a firm is in a particular sector or has a particular characteristic to its business model, e.g. business-to-business. The latter are termed ‘buzzwords. A firm can have multiple sector and buzzword flags. ↩
-
While propensity score matching approach ensures that the two groups are similar overall, the nearest neighbour criterion goes further, so that each of the firms used in the comparator group will be similar to a unique firm in the treatment group rather than the group average. This means that within the diverse range of participating firms, each individual firm is matched more closely to a relevant comparator firm. ↩
-
The reason for focusing on the PAYE jobs measure is that this variable is the most timely outcome variable available in the BSD, sourced from HRMC records. By contrast, the ‘headline’ employment measure in the BSD is updated less frequently and may be out of date. The turnover variable is more prone to time lags, such that it is necessary to use the following year’s data (e.g. 2018 BSD for the year 2017), reducing the scope. We explore using these variables in the sensitivity analysis. ↩
-
For example, statistical significance of 1% means we are 99% confident that the effect has not come about by chance. ↩
-
In 2017, we were also able to look at FintechforAll for t+1. This initiative is included in post-2017 results included in Annex A. However, we do not include firms supported through this initiative in Figure 1 to maintain consistency (in terms of the initiatives included) in the results across the three different periods. ↩
-
The groups are scaled relative to size at baseline. ↩
-
The disaggregated employment impact estimated for Upscale and Future Fifty only is not estimated with strong confidence, so we do not report it as our central estimate (see Annex A). However, the fact that it closely matches the lower-bound estimate from our main aggregate model (i.e. 10% vs 14%) suggests the true Future Fifty and Upscale effect is likely to be nearer the lower-bound than the upper-bound. ↩
-
This is based on analysis of DCMS Economic Estimates 2018, GVA and employment tables ↩
-
Steps may not sum exactly due to rounding. ↩
-
This is the cost per year that the programme is running. If a programme runs over three years at a cost of £1.5m, then the average cost per year is £0.5m. ↩
-
A course is defined as completed if users have answered all the questions at the end of the course. This is a conservative metric: many users read all of the information but then don’t answer the questions - they would not be considered course completers. ↩
-
The Learning Technologies Awards are judged independently by the eLearning Network and showcase some of the top eLearning programmes worldwide. They are internationally recognised and open to organisations of all sizes. ↩
-
The financial times, Moocs struggle to lift rock-bottom completion rates ↩
-
Based on 2801 user ratings between 01/07/2019 - 30/09/2019 ↩
-
The other four were: Enhanced my interest in launching my own digital business; Increased my confidence in my ability to work for/run a digital business; Enhanced my interest in pursuing a career in digital tech; Enhanced my interest in working in a specific field within digital tech. ↩
-
Note that due to the limited time in the field, the results are based on a small sample size and therefore may not necessarily align with the views of the wider pool of DBA users ↩
-
The survey question asked, “Have any of the DBA courses you have undertaken helped you achieve your aim?” 36% responded “yes – to a significant extent”, 57% responded “yes – to some or a small extent” and 7% responded “no noticeable benefit”. ↩
-
E.g. 25% of respondents in our survey said the main reason they signed up to use the DBA was to enhance their employment chances in the digital tech sector. ↩
-
Tech Nation’s report into diversity and inclusion in UK tech companies found that 22% of tech directors are women. ↩
-
Women’s Progression in the Workplace, The UK Government Equalities Office ↩
-
E.g. 25% of respondents said that the main reason they signed up to DBA was to launch a tech start-up while 11% said it was to grow their start-up ↩
-
Note that currently, in the digital tech sector, the first two steps are combined as applicants send their evidence directly to TN. ↩
-
With the help of DCMS and Tech Nation we created a survey which was sent to the visa scheme’s alumni through their Slack group. The survey received 42 responses out of 1192 successful applicants. Our findings are based on survey responses from a small proportion of the visa alumni. Through conversations with Tech Nation and DCMS, using the existing channel to contact alumni with the survey was considered the best approach. ↩
-
Note: Our findings are based on survey responses from a small proportion of the visa alumni. Through conversations with Tech Nation and DCMS, using the existing channel to contact alumni with the survey was considered the best approach. ↩
-
We asked, “At the time of applying to the Tier 1 Global Talent Visa, which of the following applied to you?” The options included (i) I had founded my own tech start-up, (ii) I had been offered a job in the UK digital tech sector, (iii) I had a credible business idea, (iv) none of the above. Those answering none of the above would have been ineligible for alternative UK visas (29%) ↩
-
36% of respondents to the previous questions said they were offered a job. Of these, 60% said they were offered a job by a firm with less than 200 employees. Based on our conversation with Tech Nation, we understand that many firms with fewer than 200 employees are significantly less likely than larger firms to become sponsors because of the related costs and administrative requirements. ↩
-
This is based on responses to the survey. Responders to the survey could have applied to the Visa in any year since 2016. However, there is no reason to suggest the share of Tech Nation visa applicants ineligible for alternative UK visas would have changed over time ↩
-
SQW, Tech City UK Impact Evaluation Final Report to the Department for Digital, Culture, Media and Sport, October 2017 ↩
-
SQW, Tech City UK Impact Evaluation Final Report to the Department for Digital, Culture, Media and Sport, October 2017 ↩
-
Frontier analysis of Tech Nation data (as of 06/11/2019) ↩
-
Frontier analysis of Tech Nation data (as of 06/11/2019) ↩
-
As recommended to Frontier Economics by Tech Nation ↩
-
Frontier analysis of Tech Nation data (as of 06/11/2019) ↩
-
Frontier analysis of Tech Nation data (as of 06/11/2019). ↩
-
SQW, Tech City UK Impact Evaluation Final Report to the Department for Digital, Culture, Media and Sport, October 2017 ↩
-
Source: Frontier analysis of Tech Nation data (as of 06/11/2019) ↩
-
Net Promoter Score or NPS is a measure of customer experience. Respondents are asked a question such as “how likely is it that you would recommend Tech Nation to a friend or colleague”. Respondents are then either classified as Promoters (score 4-5), Passives (score 3-4) or Detractors (score 0-2). An average score across respondents is calculated to determine the overall strength of the brand. ↩
-
As set out in the literature, theories of change are especially critical to evaluation complex and multi-faceted interventions. See for instance Mayne J (2001) Addressing analysis through contribution analysis: using performance measures sensibly. Canadian Journal of Programme Evaluation 16l 1-24 ↩
-
The coefficient can be translated into a ‘marginal effect’ using the formula: pr(treated|A) / pr(treated|B) = exp (beta x A) / exp ( beta x B). To illustrate, the Fintech dummy in t+1 has a coefficient of 0.955. This means the likelihood of being treated is 2.6 times higher if the firm is a Fintech. The calculation is as follows: pr(treated|Fintech) / pr(treated|non- Fintech) = exp(0.955 x 1) / exp(0.955 x 0) = exp (0.955)/ exp(1) = 2.6 / 1 = 2.6. The p-value of 0.00 means we are more than 99% sure that this effect has not come about by chance.↩ -
Where 23% = exp(0.2)-1 ↩
-
A similar methodology is used by SQW in the previous evaluation (see p15 of 2017 SQW report). ↩
-
Tech Nation compiles the list based on the individual merits of these different support sources and does not allow corporate sponsorship to ensure stakeholders know they are receiving independent advice ↩