Mycobacterium tuberculosis whole-genome sequencing and cluster investigation handbook
Updated 5 September 2022

© Crown copyright 2022
This publication is licensed under the terms of the Open Government Licence v3.0 except where otherwise stated. To view this licence, visit nationalarchives.gov.uk/doc/open-government-licence/version/3 or write to the Information Policy Team, The National Archives, Kew, London TW9 4DU, or email: psi@nationalarchives.gov.uk.
Where we have identified any third party copyright information you will need to obtain permission from the copyright holders concerned.
This publication is available at https://www.gov.uk/government/publications/tb-strain-typing-and-cluster-investigation-handbook/mycobacterium-tuberculosis-whole-genome-sequencing-and-cluster-investigation-handbook
Acknowledgments
We gratefully acknowledge all those in the National Mycobacterial Reference laboratories and UKHSA bioinformaticians and software engineers who undertake whole-genome sequence sample preparation and processing and maintenance of the computational systems respectively. We thank all the NHS TB teams and laboratories for isolation and submission of TB cultures. We also thank all who contribute information on TB notifications in England, including physicians, nurses, microbiologists, scientists, and administrative staff. Special thanks are extended to the health protection teams, for their essential collaboration in the ongoing investigation of TB transmission.
Authors
UKHSA National TB Unit: Dr Dona Foster (DF), Dr Suzanne Coles (SC), Dr David Wyllie, Dr Esther Robinson, Dr Lauren Ahyow, Dr Sharon Cox, Dr Martin Deadicoat, Tracey L. Langham, Surinder Tamne, Prof Grace Smith UKHSA
Field Services: Dr Charles Beck (CB), Andy Burkitt, Neil Macdonald
Version control
| Version | Date | Authors | Description |
|---|---|---|---|
| 1.0 | 30 June 2021 | DF | First Draft |
| 1.1 | 19 July 2021 | DF/ SC | Revision |
| 1.2 | 26 October 2021 | DF | Addition of cluster diagrams |
| 1.3 | 12 November 2021 | DF/SC | Revision |
| 1.4 | 23 November 2021 | All authors | Revision |
| 1.5 | 19 April 2021 | DF/SC/CB | Revision |
1 Introduction
1.1 Purpose of the handbook
This handbook supports the use of tuberculosis (TB) whole-genome sequencing (WGS) data for TB diagnosis and investigation of TB clusters. It provides guidance for UK Health Security Agency (UKHSA) staff and public health teams following the introduction of WGS into national diagnostic service as a tool for TB cluster investigation. WGS is now used routinely to identify clusters of TB and potential transmission chains to reduce the incidence of TB in the UK.
This handbook gives an overview of the end-to-end processes of WGS for the investigation and management of TB cases and shares good practice.
The handbook will remain an evolving document subject to modification to reflect current knowledge. It is primarily intended for regional health protection teams to support the management of TB cases and incidents.
Note: WGS is only available on culture positive TB cases, not latent TB infections (LTBI) diagnosed by Interferon-Gamma Release Assay (IGRA) or cases diagnosed clinically or those with negative cultures. Cases may be linked epidemiologically without WGS where clinical samples do not exist and will require follow-up as a cluster.
1.2 Background
1.2.1 Whole-genome sequencing (WGS)
A genome contains all the genetic information of an organism as a nucleotide sequence that includes code for specific genes and some noncoding regions. WGS is a process whereby all, or most of, the sequence of genomic material (Deoxyribonucleic acid (DNA)) from bacterial organisms, such as Mycobacterium species, is determined. WGS is also used for other types of cells such as human cells or viruses but these applications are not relevant to this handbook.
WGS involves 3 steps which are:
- Laboratory-based methods to extract and prepare DNA for sequencing.
- Instruments to sequence the DNA bases
- Computational analysis to understand the sequenced bases and relate them to public health and/or clinical needs.
A simple overview of the end-to-end process that occurs is shown in Figure 1.
Figure 1: Simple overview of process for samples undergoing whole genome sampling
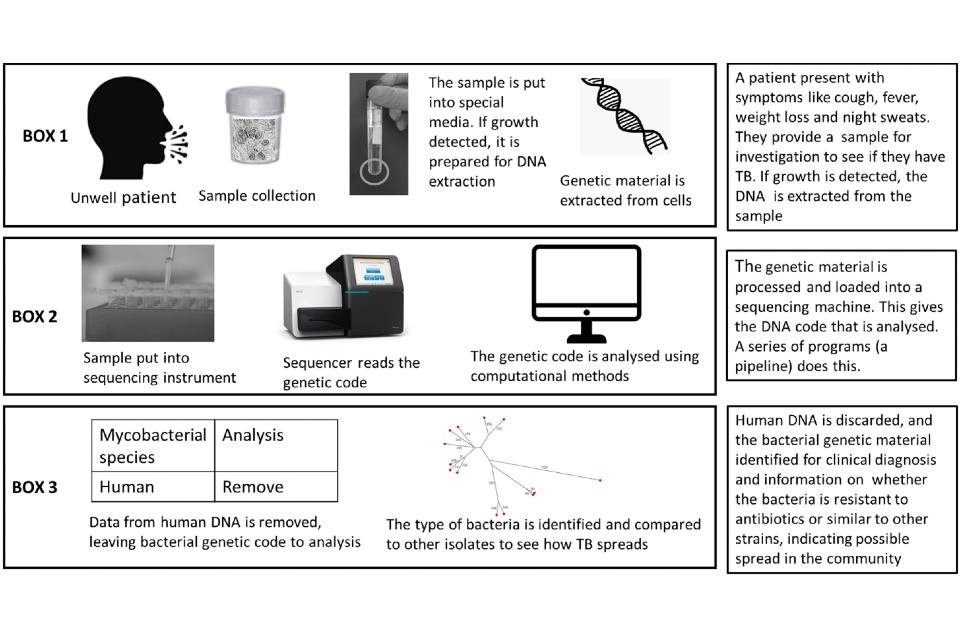
Box 1 sample collection and laboratory processing; Box 2 the sequencing process and Box 3 the analysis stage. All stages together are referred to as an end-to-end service.
1.2.2 TB microbiology
Mycobacterium tuberculosis (MTB) (along with other Non-Tuberculosis Mycobacterium -NTMs) is a slow-growing organism, taking approximately 2 to 6 weeks to grow under laboratory culture conditions after the sample has been taken. Traditional microbiological methods are dependent on bacterial culture, resulting in substantial time-lag between diagnostic confirmation of the presence of TB and further tests such as genomic sequencing and antimicrobial susceptibility. Rapid molecular tests (such as Cepheid PCR based tests), which can detect Mycobacterium tuberculosis DNA in sputum, can flag patients with TB on the same day their sample is taken.
Time to culture for clinical samples is a proxy measure for infectivity (1). Patients with large numbers of MTB organisms in their sputum, such as those with chronic untreated infection, may grow (culture) enough mycobacteria for further testing in less than a week. Samples with lower numbers of MTB organisms may require much longer incubation to grow (culture) MTB. There is usually a delay, sometimes weeks, between knowing that the patient has TB based on PCR tests on sputum and being able to establish whether a cultured isolate is related to other isolates within an existing or new cluster.
Once mycobacteria have grown and been isolated in culture, the DNA is extracted for WGS processing. In approximately 90% of cases, the WGS result provides speciation (the type of tuberculosis MTB or NTM). If the species is TB, WGS provides antimicrobial susceptibility and determines how closely related an isolated strain is to other isolated strains within the laboratory collection. The time taken to perform the WGS and provide the results is typically about 7 days after receipt of the isolate within the reference laboratory. The 7-day time period to complete WGS follows the initial period a sample has taken to grow, which can take several weeks. In the other 10%, low numbers of mycobacteria organisms prevent effective sequencing, and the reference laboratory must re-grow the mycobacteria, which may cause several more weeks’ delay or may not be possible (for example, lack of sample material). Further details of processes of whole genome sequencing for mycobacterial species can be found in a series of videos available on YouTube:
- What is whole-genome sequencing?
- How does whole- genome sequencing identify mycobacteria?
- How does whole-genome sequencing predict drug susceptibility?
1.2.3 WGS and the UKHSA TB Action Plan
The joint UKHSA- NHS England TB Action Plan for England, 2021 to 2026, was launched in July 2021 (TB Action Plan for England, 2021 to 2026 (publishing.service.gov.uk)). The aim of the TB Action plan is to improve the prevention, detection and control of TB in England and support a year-on-year reduction in TB incidence and in-UK TB transmission to enable the UK to meet its commitment to the World Health Organization (WHO) elimination targets by 2035.
There are a set of objectives within the TB Action Plan around WGS - specifically, that 100% culture positive TB cases have WGS relatedness data reviewed as part of decisions around contact tracing or public health intervention. There is also an ambition to support the development of direct WGS (that is, WGS performed directly from a sample without the need for culture) from TB specimens in the NHS.
The TB Action Plan includes actions linked to the outcomes of the Collaborative TB Strategy for England, 2015 to 2020, including increasing the use and availability of WGS (Collaborative Tuberculosis Strategy for England 2015 to 2020 ).
The use of WGS is in line with the ambition of the development of UKHSA as outlined in the 2021 remit letter Letter from Lord Bethell to Dr Jenny Harries, UKHSA chief executive
“expand genome sequencing and analysis capacity and capability to establish a world-leading pathogen genomics system to detect and provide local, regional and national surveillance of infectious threats with strategies to provide this capability within the regional and national health and public health framework – working with devolved administrations towards a UK all pathogens genomics strategy and contributing to development of a stronger global disease surveillance system.”
1.2.4 Implementation of WGS into UKHSA
Public Health England (PHE) and its successor organisation UKHSA, remains a world leader in providing a national and supra-national TB service. Within this service, WGS is used as the primary diagnostic tool to simultaneously:
- detect and confirm M. tuberculosis within a culture from a clinical sample
- identify potential laboratory processing contamination events ensuring treatment is not given to patients that do not require it
- predict drug resistance patterns ensuring appropriate treatment
- provide a high resolution of TB strain relatedness to trace infection sources and potential transmission networks
The current programme for use of WGS for TB diagnostics in England was initially led by PHE and the Modernising Medical Microbiology group at the University of Oxford. The aim was to create a pathway from the laboratory through computational analysis to clinical reports. The work included cost-analysis to determine the financial benefit of WGS (2 to 7).
In December 2016 the full service was implemented in the National Mycobacterial Reference Service- North and Central (NMRS-N&C) in Birmingham with the service extended to the NMRS-South in London in January 2018. From 2019, Public Health Wales (PHW) provided WGS for some areas of the Southwest England as well as Wales. Currently, around 1400 mycobacterial samples per month are processed in these laboratories. The sample and results pathway are shown in Figure 2. This service provides a comprehensive national TB surveillance picture using WGS data on culture positive samples to inform clusters.
Figure 2: Overview of sample journey through local and national laboratories and reporting of results
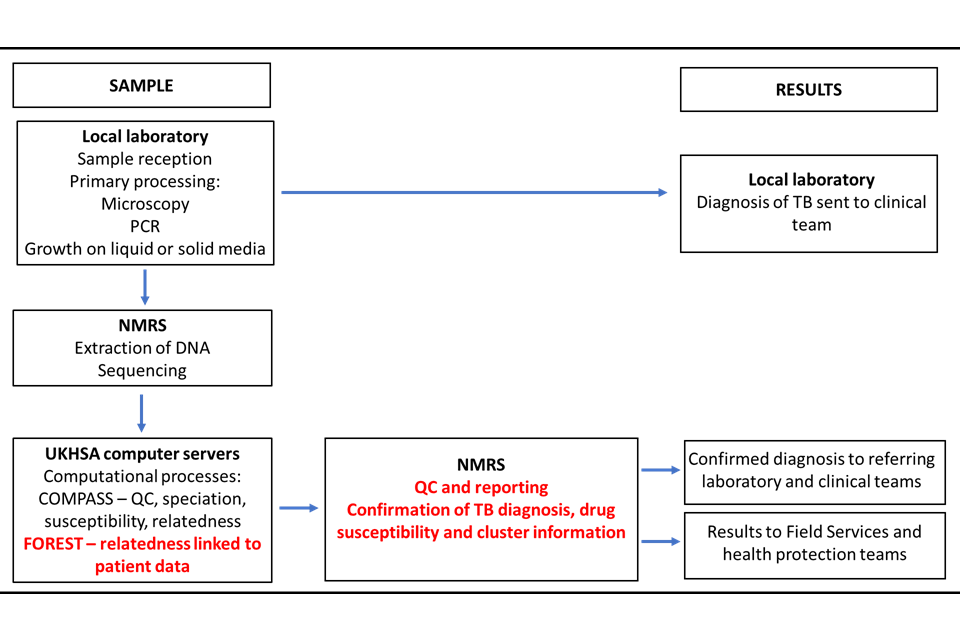
COMPASS (COMplete Pathogen Analytical Software Solution) is the bioinformatic pipeline where sequences are processed. FOREST is an UKHSA program that links patient information with the sequence data.
1.2.5 Speciation and resistance
WGS identifies all and reports all species in the Mycobacterium tuberculosis Complex (MTC or MTBC). The major human disease-causing strains in this group are M. tuberculosis and M. africanum. Other species within the group include species associated with animals where zoonotic infection may have occurred (for example, M. bovis, M. microti, M. caprae and M. canettii). M bovis infection associated with the Bacillus Calmette-Guerin (BCG) strain may be identified but is not notifiable.
The use of WGS for speciation and antimicrobial susceptibility for mycobacterium other than MTC including all NTMs is outside the scope of this document.
2 Using WGS for clustering information
2.1 Introduction to using WGS for clustering information
As implemented in UKHSA TB WGS, clustering is a process which yields a group of strains with closely related genomes; epidemiological data is not used during cluster formation. The process offers strong guarantees that all pairs of samples whose genomes are suggestive of recent case to case transmission will lie within the same cluster. However, it does not offer guarantees that all members of the cluster transmitted to each other recently, or even at all. This important to appreciate and is discussed more later.
Clustering based on molecular data requires an understanding of both how similar or different one TB strain is from another, and whether such differences should result in isolates being placed in a cluster compared to previous methods.
WGS for TB improves sensitivity of clusters when compared to 24 loci Mycobacterial Interspersed Repetitive Unit – Variable Number Tandem Repeats (MIRU-VNTR) typing. The discriminatory power of WGS enables outbreaks to be resolved with greater speed and confidence. The first use of WGS to describe TB diversity (8) demonstrated limitations in DNA fingerprinting in the detection of diversity between TB strains. Following this, studies in the Netherlands and Canada showed that application of WGS could resolve large outbreaks to distinct sub-clusters assisting epidemiological resolution (9 to 11). This evidence suggested that WGS application to TB cluster investigation could assist in public health understanding and resolution of TB transmission. A PHE-led study indicated that WGS was about 80 times more granular than the legacy typing method then in use, MIRU-VNTR (12). Because of this increased granularity, a 2015 national review recommended that WGS replace routine MIRU-VNTR typing as a public health tool for TB cluster management and investigation.
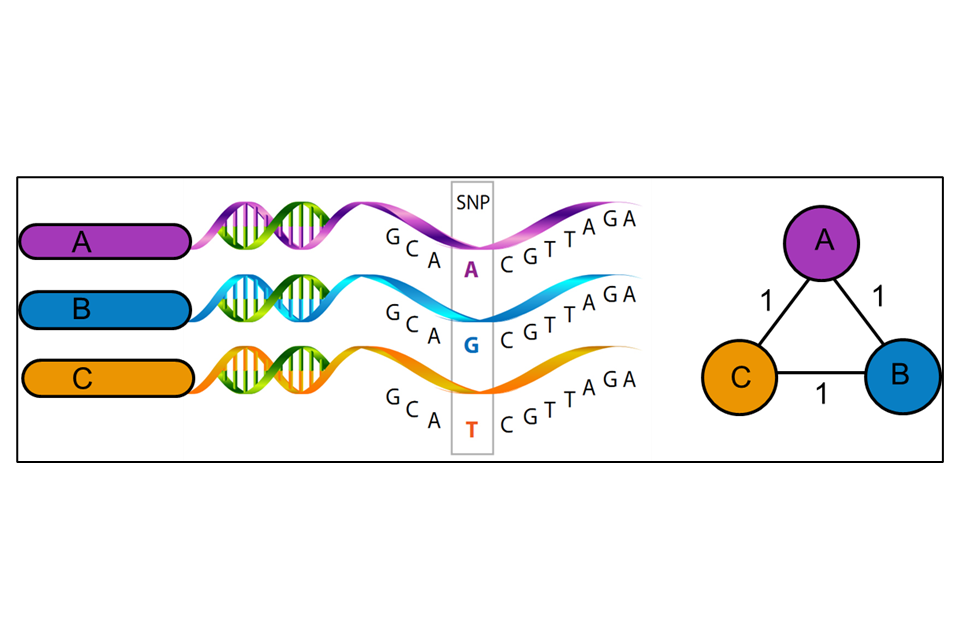
WGS uses variations in the genetic material (nucleotide bases of the DNA) of the unknown isolate compared to a reference strain (UKHSA use H37rV) to produce a series of single polynucleotide polymorphisms (SNPs), that is the differences between the genomes. WGS uses approximately 88% to 92% of the genome to identify the number of SNPs and their position on the genome. Some areas of the bacterial genome are difficult to align against the reference strain due to the size of the fragments of DNA generated by the sequencing method currently used. Further areas may be masked (that is not used) because they contain areas of low-quality mapping against the reference genome. The SNP threshold is the minimum number of changes in the sequenced genomes that places two people in the same transmission cluster, illustrated in Figure 3. The position of SNPs within the genome are used to create a phylogenetic tree showing how isolates may be related.
Note: a free training course on phylogenetic trees can be found at Phylogenetics: an introduction.
Figure 3: A schematic representation of the relatedness between three mycobacterial isolates (A, B and C) (Image created by M Reynolds)
WGS results, when combined with epidemiological data, can identify patients that may be involved in the same chain of TB transmission. This can assist with strategies for control measures and help in the understanding of TB epidemiology in different settings.
The main objectives of TB WGS cluster investigation are:
– at patient level –
- to identify issues such as laboratory contamination that may lead to unnecessary investigation and treatment
- to distinguish between re-infection from reactivation in patients with history of TB
– at regional and local public health level –
- to provide typing results to prospectively identify local, regional, or national incidents of suspected transmission, enabling proactive, locally led response to TB control and public health protection
- to determine whether patients are NOT part of a cluster for public health team resource management, such as targeting contact tracing
– at UKHSA TB Unit national level –
- to understand the national and local epidemiology of TB, including identification of risk groups and social networks for recent transmission
- to understand the molecular epidemiology of TB, including diversity of circulating strains, geographical distribution, and lineages
- to monitor TB control by analysing trends in estimates of recent transmission
- to meet international obligations for molecular surveillance, Europe-wide and globally
2.2 TB WGS and cluster investigation
TB WGS cluster investigations use the SNPs between isolates to estimate whether they are closely related, that is indicative of likely recent transmission.
Isolates from TB cases can differ significantly in the number of SNPs identified between them (0 to >1000 SNPS). Direct or recent transmission is associated with small numbers of nucleotide differences between separate samples. Initial investigation into strains from the UK indicated that SNP differences of less than 5 may flag recent transmission while SNP differences over 12 do not represent a recent transmission network (6), (11).
While this is a useful guide, SNP differences between isolates depend upon several factors including: time lapse between isolates, acquisition of drug resistance and specific phylogenetic lineage (13 to 16). SNP differences may also indicate mixed infection or laboratory contamination (17). The molecular clock of the tuberculosis genome, estimated as 0.5 changes in the genomic sequence per year (11), can also vary in different settings (18).
This means that while 12 SNPS can be defined as the upper threshold of genomic relatedness between epidemiologically related hosts (19), lower limits must be assessed on an individual situation or outbreak basis. Please note that currently the tool used to display, access, and utilise TB relatedness results is called Forest. Forest uses a 12 SNP distance as a cut-off for clustering isolates.
2.2.1 Definitions
Epidemiological cluster
An epidemiological cluster is defined as “2 or more persons with known epidemiological links”. An epidemiological link is defined as person linked by time and place.
The number of SNPs identified from WGS in related strains provides additional evidence as to whether a recent transmission event is likely to have occurred. Cases found to be greater than 12 SNPs apart from each other will generally not be considered to belong to the same chain of transmission.
Cluster by WGS SNP differences
A WGS cluster is defined as “2 or more persons with a diagnosis of active TB that have less than 12 SNPs difference”. Note that 1 person with multiple isolates will form a genomic cluster which will not require further follow up.
Epidemiological information is required to determine the likelihood of 2 isolates belonging to a cluster and representing recent transmission. The assessment of likely recent transmission of isolates clustered by WGS will depend on the amount of time between samples, geographical location, whether the isolates are multidrug resistant and the estimated changes (molecular clock) associated with the isolates. The epidemiological investigation will allow understanding of the potential for two cases to have had contact.
The following is a guide – expert guidance is available from the UKHSA TB Unit TBSection@phe.gov.uk
For this handbook, a cluster is defined as cases with TB isolates that exhibit 2 or more confirmed cases of TB with 0 to 12 SNP differences between their genomic sequence with supporting epidemiological evidence.
Epidemiologically confirmed WGS cluster
This is defined as “a cluster of 2 or more persons with TB whose sequence data have 12 or less SNP differences between them and have known epidemiological links between at least two other members of the cluster”.
2.2.2 Epidemiological links
Epidemiological links are based on information collected from 2 or more cases with active TB who are associated in time and place identified during interview, contact tracing or cluster investigations. Epidemiological links between TB cases can be characterised into three broad categories: known or definite epidemiological links, possible epidemiological links, and no identified epidemiological links.
Known epidemiological link
TB patients have a known epidemiological link if the following one of the following conditions are met:
- one case volunteered the name of the other as a contact while either was potentially infectious (that is had pulmonary TB, irrespective of sputum smear status) and this can be validated
- information confirms that the cases were in the same setting, such as hospital, school, workplace, sports place, or prison, at the same time when either of them could have been potentially infectious – this applies to pulmonary TB cases irrespective of sputum smear status
- other information linking the cases is identified through follow up by HPTs and Field Service
Possible epidemiological link
TB cases have a possible epidemiological link if any of the following conditions are met:
- 2 cases spent time in the same setting around the same time, but the timing that they were present, or the timing of the infectious period was not definite enough to meet the criteria for a definite epidemiological link
- 2 cases lived in the same setting around the same time and this can be validated
- 2 cases worked in, or were in the same setting, around the same time and shared social, occupational or behaviour characteristic social risk factors or similar backgrounds that increase the chances of transmission
- one case volunteered the name of the other as a contact but both patients have non-pulmonary TB
- 2 cases were in the same setting at the same time but both patients have non-pulmonary TB
No identified epidemiological link
Two cases should be classified as having no identified epidemiological link if they do not meet the criteria above. However, be aware it is possible that within this, epidemiological links may exist that have not been ascertained or identified.
For this handbook, the term ‘cluster’ is subsequently used to refer to WGS cluster.
TB cases may be linked epidemiologically without WGS (for example where clinical samples do not exist) and will require follow-up as a cluster.
2.2.3 TB WGS cluster information to inform public health action
It is important to note that:
- it is possible that WGS gives low SNP differences between 2 isolates, indicating a cluster, but epidemiological links cannot be demonstrated – for example, a person unknown to healthcare or who has not presented in the UK may link known cases
- an existing isolate can change status from ‘not-clustered’ to ‘clustered’ if further information becomes available – such as the addition of a new isolate from another patient with WGS data that exhibits SNP differences under 12 from the existing isolate
- a person who is epidemiologically linked to a cluster may not be linked by WGS SNP difference – for example, they may have a re-occurrence or re-activation coincidently at the same time, or they may be part of a different cluster identified by WGS that shares epidemiological attributes
- WGS relies on having a culture positive sample so culture negative TB cases will not be represented – note that persons identified with LTBI will not be present in trees nor will clinically treated cases of active TB (such as children treated as part of family cluster)
- WGS cannot prove transmission, or its direction – clustering and low SNP difference, alongside a defined epidemiological link is indicative of transmission
3 Naming WGS clusters
Clusters are automatically assigned a name in the Forest tool. The naming convention, adopted by UKHSA (previously PHE) in May 2017, is 2 letters (assigned sequentially starting with AA) followed by 3 numbers (also assigned sequentially starting with 001). For example, once AA999 is reached it moves to AB001. Lineage is added at the end of the name separated by a dash and corresponding to:
1 = Indo-Oceanic
2 = East Asian
3 = East-African Indian
4 = Euro-American
5 and 6 = M. africanum
BOV = M. bovis
Examples of cluster names include AA043-3 and AC344-BOV.
In Forest, multiple isolates from an individual will be assigned the same cluster name (providing they are within 12 SNPs) and this name will be retained should additionally samples from a different individual (2 or more people within 12 SNPs) occur.
Clusters may merge if an individual arises who is within 12 SNPs of 2 or more established clusters. The earliest cluster name will be retained for this merged cluster.
3.1 Cluster management process
As UKHSA’s Regional Health Protection Teams are unable to access cluster data directly at this time, cluster information is disseminated via the Field Service Cluster Investigators to the Health Protection Teams (HPTs) and TB services/case managers. New additions to clusters are reviewed daily by the Field Service Cluster Investigators. Information is then shared directly with local HPTs and TB nurses.
Information concerning multi-drug resistant isolates is shared directly with the local clinical teams by the UKHSA TB Unit or National Mycobacterial Reference Service (NMRS). HPTs can contact the National TB Surveillance Unit directly via email at TBSection@phe.gov.uk if any concerns arise regarding patients and/or clusters.
To support regional HPTs in interpreting and acting on cluster data, information review happens at UKHSA TB Unit and NMRS national level on some clusters. An initial cluster review is undertaken by a senior scientist from the UKHSA TB Unit and two Field Service cluster investigators. Each cluster is assessed on the number of new cases, SNP differences between cases and known epidemiological information. This will determine whether further review is necessary (summarising and recording the rationale).
Rationale for cases not recommended for further review at ATC meeting are:
- cluster information and epidemiological links/ transmission settings already known, for example a case is identified as part of a household grouping or cases identified as part of incident screening – the cluster may not require further review by ATC as the links have been established; information will be shared with HPTs as the new case may trigger further screening
- large SNP differences indicating cases are unlikely to reflect recent case to case transmission
- likely importation of strain and no indication of in-UK transmission due to date and time of symptoms and samples
Reasons for cases recommended for further review are:
- rapid growth in a cluster based on the number of new additions within 12 months
- indication of drug resistance as multi-drug resistance cases are likely to have treatment challenges
- clusters with cases with geographical dispersal (need for co-ordination of response)
- cases with social risk factors where contact tracing and control may be challenging
- cases linked to educational, healthcare and congregate e.g. prison or workplace settings
- cases are children (< 16 years) without an obvious source or index case in a household
- dynamic risk assessment meets criteria for escalation of response from routine to national incident (or has potential)
If a cluster requires further review, it is flagged for discussion by a multi-disciplinary team known as the ‘Air Traffic Control’ (ATC) group. The ATC group meets monthly and is chaired by the head of the UKHSA TB unit and has representation from NMRS, TB Unit, HPTs and Field Service. The aim of the ATC is to support local cluster investigators and HPTs to identify ‘high risk’ clusters of concern, provided expertise for the interpretation of WGS relatedness data, as well as expert advice relating to the public health investigation and response.
The ATC review process will assess how new cases relate to others in the cluster in terms of:
- whether SNP differences are suggestive of possible transmission
- geographical distribution – plausibility of transmission
- temporal relationship – plausibility of recent transmission or reactivation
- demographic profile – similarity to other cases
- already known epidemiological links between cases in the cluster
- already known contextual transmission settings identified / investigated such as common risk factors, behaviours, or activities
Once cases have been discussed at the ATC meeting, information is relayed back to the HPT and TB service where the case resides for local investigation follow up and public health management. Regional HPTs and Field Service teams will have their own arrangements for cluster review process to review the public health investigation and follow-up.
3.2 How to use cluster information
Health Protection Teams
Regional HPTs will have arrangements for reviewing and managing WGS clusters. Information in relation to new cases or expanding clusters is shared with the HPT by the Field Service Cluster Investigator. Work is then undertaken alongside TB services to establish epidemiological links between the cases.
TB services/case managers are also informed by the Field Service Cluster Investigator when their patients are found to be part of a WGS cluster and further information can be requested. Once the local HPTs are informed that a cluster exists, the following factors may influence local cluster public health actions and risk assessment:
- the cluster includes a child (defined as under 16 years), especially if under 2 years old
- the infectiousness of case, such as time to culture, X-ray cavities, length of illness, indicates risk of transmission
- the cluster includes cases with social risk factors which makes both treatment and identification of contacts more challenging
- the cluster includes a health care or social care professional, because of the possibility of nosocomial transmission
- the cluster includes a drug-resistant or multidrug -resistant strain
- the SNP distance and time frame between isolates
- a cluster of M. bovis strains (due to concern over zoonotic transmission)
- the cluster includes a case with known HIV infection
3.3 Roles and responsibilities
Identification of WGS clusters
As detailed above clusters identified by WGS sequencing are initially reviewed on an individual basis by a senior scientist from the UKHSA TB Unit and 2 Field Service cluster investigators.
All information is cascaded to the appropriate HPT after review and following discussion at the ATC meeting if the cluster is discussed.
A cluster involving 2 or more persons with epidemiologically linked risks, such as household contact, generally require no further public health action following WGS cluster identification with a small number of SNPs. Clusters with WGS results that involve 2 or more persons with small SNP numbers with unknown/possible epidemiological links or multi-drug resistance should trigger further investigation by HPTs.
The UKHSA TB Unit can provide additional support to cluster investigation:
- as national focal point for organisation and coordinating information relating to geographically dispersed and long-standing historical clusters
- as a source of expertise and skills of different professionals to assess, support plan and manage the public health response to complex clusters
UKHSA TB Unit and NMRS has a role in seeking assurance that public health follow up has been undertaken by HPTs in line with the UKHSA and NHSE TB Action Plan. HPTs will be asked for feedback and outcome of investigations of case and clusters of TB linked by WGS.
Investigation of WGS clusters
The investigation and response to cases linked by WGS is led by the HPT in liaison with local TB services where the case usually resides geographically.
Where cases are located across multiple HPTs, a lead HPT may be agreed with input from the UKHSA TB Unit.
In some clusters epidemiological links between cases will already have been established through follow up of the index case and routine contact tracing activities.
Where this has not been established, actions that follow the identification of a cluster may include:
- requesting enhanced information from cases through questionnaires to ascertain social networks
- further analysis of cases in the cluster to review risk social risk factors and potential links
- review of potential settings for public health action, contact tracing/screening and awareness raising
Management of local outbreaks of TB (for example in a school, hospital, residential care, prison, or community) including those identified by WGS requires a multi-agency response.
An Outbreak Control Team (OCT), should be convened by the local Health Protection Team as agreed through their regional process. Tiggers for an OCT will depend on risk assessment of the case. Guidance for outbreaks can be found at Communicable Disease Outbreak Management: operational guidance.
For TB clusters linked by WGS that are considered to be an outbreak or where wider actions are considered, the following persons should also be included as members of the OCT:
- Consultant in Communicable Disease Control/ Consultant in Health Protection (CCDC / CHP) responsible for the coordination of the OCT
- NHS TB Clinical Team (TB nurses, Physician responsible for the care of the case to establish infectious status of index case)
- microbiologist and/or infectious disease consultant from the treating NHS Trust
- local authority representative (Director of Public Health or nominated deputy)
- commissioners and/or providers (that is Clinical Commissioning Group representative, NHS England)
- depending upon the setting, representatives as appropriate from the implicated institutions for example hospital IPC or school nursing service, prison service may be appropriate
As needed or directed by the lead CCDC/ CHP:
- UKHSA TB Unit – TB service senior scientist / consultant from NRMS
- UKHSA TB Unit – Clinical Team member Senior Nurse
- Field Service Cluster Investigator
- UKHSA Travel and Migrant Health Section senior scientist/consultant epidemiologist (for national outbreaks associated with overseas travel only)
- UKHSA Health and Justice Team/consultant epidemiologist (for national outbreaks associated with secure settings)
Advice on outbreak investigation and management is available from the National TB Unit. A physician and TB specialist nurse are on duty every day and can be contacted at TBSection@phe.gov.uk
4 WGS cluster annotated examples
4.1 A cluster with low SNP difference
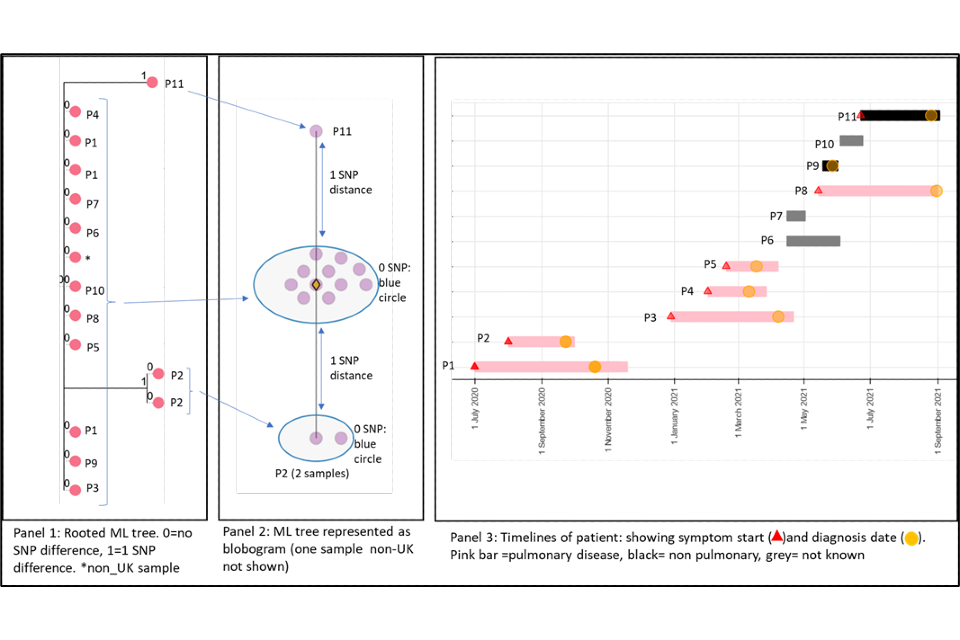
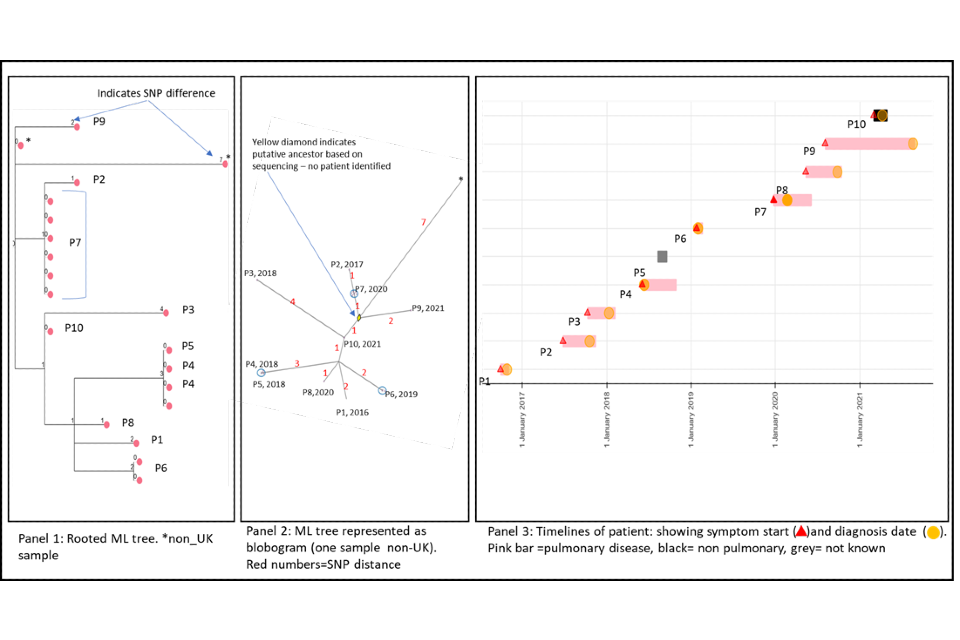
Figure 4 shows a cluster with 11 people with active culture confirmed TB that are 0 or 1 SNP apart alongside a timeline of symptom onset and diagnosis date (identifiers have been removed). The timeline and the blobogram (a pictorial representation of a phylogenetical tree) with demographic and geo-spacial information can be used to determine possible transmission within a community. The low SNP difference and short timeline in this example suggest that transmission within patients in this cluster has occurred, but this can be only confirmed by epidemiological data. Note that cluster information cannot determine the direction of transmission at this time.
Panel 1
A phylogenetic tree generated using a rooted maximum likelihood (ML) algorithm. There are 15 samples that include repeat samples from 2 patients and a sample from a laboratory outside the UK. The tree shows 0 SNPs between 9 patients (P) with 2 patients that are one SNP apart (P2 and P11). The isolates that are one SNP apart have different changes in the sequence compared to the main group. They have a 2 SNP distance between each other. From panel 3 (the timeline), we can see that these samples differ in time, P2 diagnosed in 2020 and P11 diagnosed in 2021.
Panel 2
This panel shows a blobogram which is a different way to show the ML tree. This diagram only shows samples from the UK (number=14) A blobogram takes all isolates that are 0 SNPs apart and puts them in a blue circle. Here, all samples from the patients are shown in the central blue circle. The 2 patients that have SNP differences are shown connected to the central blob. The SNP difference is indicated (blue arrows). From this, we can see more clearly that the 2 patients that are one SNP apart from the central blob are 2 SNPs away from each other. The yellow diamond in the central circle indicates the putative oldest sample. A putative sample is one that is inferred to be the oldest based on the genetic sequence of other samples. In some clusters the putative sample is a known sample but sometimes an actual sequence is not available. When it is not present, the algorithm used to create the tree will assign an assumed putative sample.
Panel 3
This panel shows the epidemiological timeline of the 11 patients in cluster with dates of symptom onset (a red triangle) and dates of diagnosis (a yellow circle). It also indicates whether patients have pulmonary disease (pink bar) or not (black bar) or site of disease is not known (grey). This information is taken from TB surveillance system records.
Figure 4: Annotated cluster showing ML tree (panel 1), blobogram (panel 2) and timeline (panel 3)
4.2 A cluster with variable SNP differences
Figure 5 shows a cluster with 10 people with active culture confirmed TB that are between 1 and 6 SNPs from nearest neighbour (one shown with 7 SNPs is a non-UK sample) alongside a timeline of symptom onset and diagnosis date (identifiers have been removed). The timeline and the blobogram with demographic and geospatial information can be used to determine possible transmission within a community.
The SNP difference and timelines in this example suggest that transmission within patients in this cluster is occurring, but this can be only confirmed by epidemiological data.
The larger SNP distances and longer timeframes may make it more difficult to ascertain epidemiological links in this cluster. The timeframe with one or two cases presenting per year suggest ongoing transmission with potentially unidentified cases.
Note that cluster information cannot determine the direction of transmission at this time but the dates of symptom onset may provide evidence of transmission.
Panel 1
The maximum likelihood tree of the samples with SNP distances. There are more than 10 samples for the 10 patients (for example, patient 7 has 6 samples that are 0 SNPs apart). Three samples are from non-UK patients, only one is shown on the blobogram.
Panel 2
The ML tree shown as a blogogram, annotated with patient number, year of sample and SNP distance (shown in red). A blobogram takes all isolates that are 0 SNPs apart and puts them in a blue circle – in this cluster only one of the blue circles has 2 patients, the other 2 blue circles show samples from the same patient that are 0 SNPs apart. The yellow diamond in the central circle indicates the putative oldest sample. The shape of the cluster is elongated and linked by the putative unknown sample and the latest sample from 2021. The addition of the latest person that connects the other cases may indicate a transmission link that was previously unknown.
Panel 3
This panel shows the epidemiological timeline of the 10 patients in cluster with dates of symptom onset (a red triangle) and dates of diagnosis (a yellow circle). It also indicates whether patients have pulmonary disease (pink) or not (black) or if site of disease is not known (grey).
Figure 5: Annotated cluster showing ML tree (panel 1), blobogram (panel 2) and timeline (panel 3)
4.2 Cluster with variable SNP differences
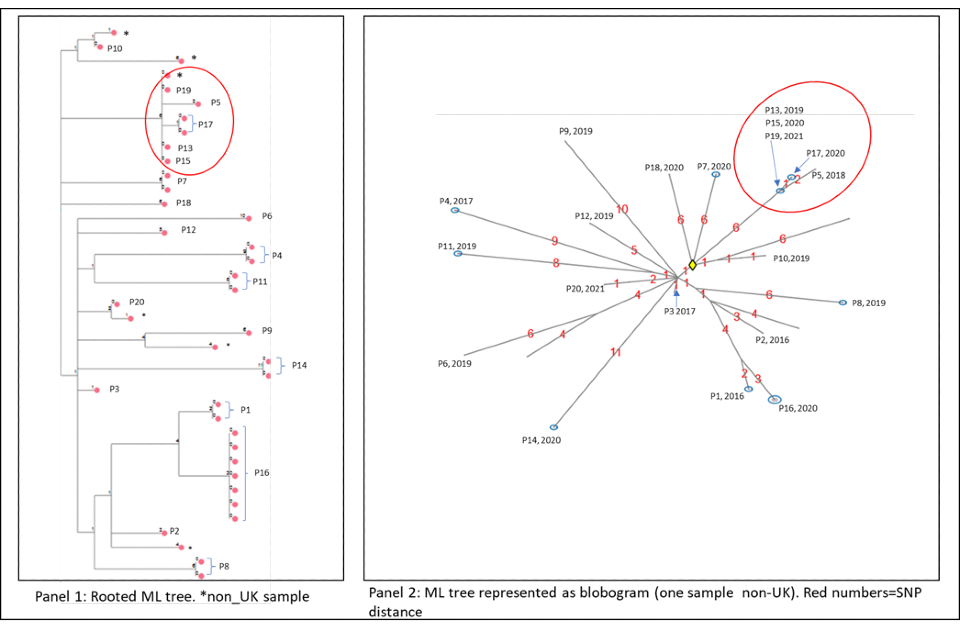
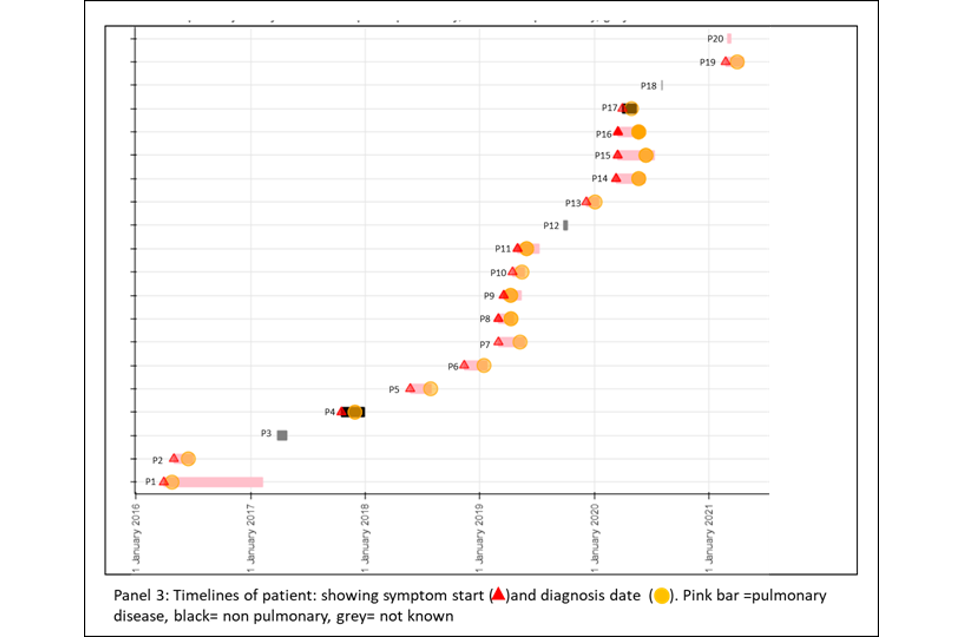
Figure 6a and 6b shows a cluster with 20 people with active culture confirmed TB that are between 0 or 11 SNPs to the nearest neighbour with a timeline of symptom onset and diagnosis date (identifiers have been removed). The timeline and the blobogram with demographic and geospatial information can be used to determine possible transmission within a community. This cluster contains people who are non-UK born with recent entry dates. The higher SNP difference between patients, alongside this epidemiological information suggests that the clustering may reflect the diversity within the country of origin. However, there are 5 people with low SNP differences (indicated by the red circle) that suggest more recent transmission occurring in the UK, but this can be only confirmed by epidemiological data. Note that WGS information alone cannot determine the direction of transmission at this time.
Panel 1
The maximum likelihood tree of the samples with SNP distances. There are more than 20 samples for the 20 patients (for example, patient 16 has 6 samples that are 0 SNPs apart). Several samples are from non-UK patients. The red circle indicates possible recent transmission.
Panel 2
The ML tree shown as a blogogram, annotated with patient number, year of sample and SNP distance (shown in red). A blobogram takes all isolates that are 0 SNPs apart and puts them in a blue circle – in this cluster one of the blue circles has 3 patients, the other blue circles show samples from the same patient that are 0 SNPs apart. The yellow diamond in the central circle indicates the putative oldest sample. The larger SNP distances between many samples in the cluster are shown in red.
Panel 3
This panel shows the epidemiological timeline of the 20 patients in cluster with dates of symptoms (a red triangle) and dates of diagnosis (a yellow circle). It also indicates whether patients have pulmonary disease (pink) or not (black) or if site of disease is not known (grey).
Figure 6a (top) and 6b (bottom): Annotated cluster showing ML tree (panel 1), blobogram (panel 2) and timeline (panel 3)
References
1 O’Shea MK and others. ‘Time-to-detection in culture predicts risk of Mycobacterium tuberculosis transmission: a cohort study’ Clinical Infectious Diseases 2014: volume 59(2), pages 177-85
2 Pankhurst LJ and others. ‘Rapid, comprehensive, and affordable mycobacterial diagnosis with whole-genome sequencing: a prospective study’ Lancet Respiratory Medicine 2016: volume 4(1), pages 49-58
3 Votintseva AA and others. ‘Same-Day Diagnostic and Surveillance Data for Tuberculosis via Whole-Genome Sequencing of Direct Respiratory Samples’ Journal of Clinical Microbiology 2017: volume 55(5), pages 1285-1298
4 Votintseva AA and others. ‘Mycobacterial DNA extraction for whole-genome sequencing from early positive liquid (MGIT) cultures’ Journal of Clinical Microbiology 2015: volume 53(4), pages 1137-43
5 Quan TP and others. ‘Evaluation of Whole-Genome Sequencing for Mycobacterial Species Identification and Drug Susceptibility Testing in a Clinical Setting: a Large-Scale Prospective Assessment of Performance against Line Probe Assays and Phenotyping’ Journal of Clinical Microbiology 2018: volume 56(2)
6 Walker TM and others. ‘Assessment of Mycobacterium tuberculosis transmission in Oxfordshire, UK, 2007-12, with whole pathogen genome sequences: an observational study’ Lancet Respiratory Medicine 2014: volume 2(4), pages 285-292
7 Walker TM and others. ‘Whole genome sequencing for M/XDR tuberculosis surveillance and for resistance testing’ Clinical Microbiology and Infection 2017: volume 23(3), pages 161-166
8 Niemann S and others. ‘Genomic diversity among drug sensitive and multidrug resistant isolates of Mycobacterium tuberculosis with identical DNA fingerprints’ PLoS One 2009: volume 4(10), page e7407
9 Schurch AC and others. ‘High-resolution typing by integration of genome sequencing data in a large tuberculosis cluster’ Journal of Clinical Microbiology 2010: volume 48(9), pages 3403-6
10 Gardy JL and others. ‘Whole-genome sequencing and social-network analysis of a tuberculosis outbreak’ New England Journal of Medicine 2011: volume 364(8), pages 730-9
11 Walker TM and others. ‘Whole-genome sequencing to delineate Mycobacterium tuberculosis outbreaks: a retrospective observational study’ Lancet Infectious Diseases 2013: volume 13(2), pages 137-46
12 Wyllie DH and others. ‘A Quantitative Evaluation of MIRU-VNTR Typing Against Whole-Genome Sequencing for Identifying Mycobacterium tuberculosis Transmission: A Prospective Observational Cohort Study’ EBioMedicine 2018: volume 34, pages 122-130
13 Nikolayevskyy V and others. ‘Role and value of whole genome sequencing in studying tuberculosis transmission’ Clinical Microbiology and Infection 2019: volume 25(11), pages 1377-1382
14 Roetzer A and others. ‘Whole genome sequencing versus traditional genotyping for investigation of a Mycobacterium tuberculosis outbreak: a longitudinal molecular epidemiological study’ PLoS Medicine 2013: 10(2), page e1001387
15 Jajou R and others. ‘Epidemiological links between tuberculosis cases identified twice as efficiently by whole genome sequencing than conventional molecular typing: A population-based study’ PLoS One 2018: volume 13(4), pages e0195413
16 Kato-Maeda M and others. ‘Use of whole genome sequencing to determine the microevolution of Mycobacterium tuberculosis during an outbreak’ PLoS One 2013: volume 8(3), page e58235
17 Wyllie DH and others. ‘Identifying Mixed Mycobacterium tuberculosis Infection and Laboratory Cross-Contamination during Mycobacterial Sequencing Programs’ Journal of Clinical Microbiology 2018: volume 56(11)
18 Stimson J and others. ‘Beyond the SNP Threshold: Identifying Outbreak Clusters Using Inferred Transmissions’ Molecular Biology and Evolution 2019: volume 36(3), pages 587-603
19 Hunt M and others. ‘Antibiotic resistance prediction for Mycobacterium tuberculosis from genome sequence data with Mykrobe’ Wellcome Open Research 2019: volume 4, page 191
Appendix 1
Figure A.1: Flow diagram of TB WGS cluster data inputs, process for action and information outputs

Note: this process is subject to local variation, the figure outlines a suggested process.
Figure A.1. Flow diagram of TB WGS cluster data inputs, process for action and information outputs – text version
Inputs 1
- CI (Cluster Investigator) cluster database
- FOREST data of WGS cluster cases
- STM (Strain Typing Module) data of historical MIRU-VNTR linked cases
- ETS data of epi linked cases
Then:
Process
- CIs review new cases and clusters to make suggestions on action
Then:
Path 1
Outputs
- Cluster line lists and cluster review summary
Or:
Path 2
Process
- ATC review selected priority clusters to make suggestions on action
Then:
Path 1
Outputs
- Cluster line lists and cluster review summary
Or:
Path 2
Process
- CIs provides cluster data and suggestions to HPT TB leads and FES (Field Service Epidemiologist) (for independent- or meeting-based review)
- HPT TB leads decide whether cluster warrants further information collected (by TB services) and/or cluster investigation
Then:
Path 1
Outputs
- HPZone (Health Protection Zone) record created/updated
- Log of action and outcomes
Or:
Path 2
Process
- Local cluster investigation led by HPT with or without OCT to agree and deliver public health action as required
Inputs 2
- Cluster line list
- Cluster summary report
- TB social context data
Then:
Process
- CIs provides cluster data and suggestions to HPT TB leads and FES (for independent or meeting based review)
- HPT TB leads decide whether cluster warrants further information collected (by TB services) and/or cluster investigation
Then:
Path 1
Outputs
- HPZone record created/updated
- Log of action and outcomes
Or:
Path 2
Process
Local cluster investigation led by HPT with or without OCT to agree and deliver public health action as required