The tax gap and compliance yield – what they are and how they relate
Published 21 December 2021

© Crown copyright 2021
This publication is licensed under the terms of the Open Government Licence v3.0 except where otherwise stated. To view this licence, visit nationalarchives.gov.uk/doc/open-government-licence/version/3 or write to the Information Policy Team, The National Archives, Kew, London TW9 4DU, or email: psi@nationalarchives.gov.uk.
Where we have identified any third party copyright information you will need to obtain permission from the copyright holders concerned.
This publication is available at https://www.gov.uk/government/publications/tax-gap-and-compliance-yield-technical-note/the-tax-gap-and-compliance-yield-what-they-are-and-how-they-relate
1. Introduction
The government’s 10-year tax administration strategy, published jointly by HM Revenue and Customs (HMRC) and HM Treasury in July 2020 sets out the government’s proposals for building a trusted, modern tax administration system – one that keeps pace with the rapid changes in society, the economy and technology and helps the UK build back better from the pandemic.
HMRC’s aim is for everyone to pay the tax that is legally due, no matter who they are. Our role is to help people to pay the right tax through education and well-designed systems, and to step in when tax is at risk of not being paid. In tax year 2020 to 2021 HMRC collected £608.8 billion in total tax revenues, the vast majority from taxpayers complying with their obligations.
A well-designed system prevents non-compliance before it can occur, while making things easier for taxpayers and allowing HMRC to focus our resources where they can make the most difference. The most efficient way to collect the right amount of tax is for HMRC to guide the taxpayer by intervening before anything has the chance to go wrong.
It is impossible to collect every penny of tax that is owed. Some taxpayers make errors despite their best efforts, while others don’t take enough care when they submit their returns. Legal interpretation, evasion, avoidance, and criminal attacks on the tax system also result in a tax loss. In certain cases, we decide to stop debt collection activity if it becomes uneconomic for us to pursue the outstanding amount, or if there is no practical means to collect it, for example, if companies become insolvent.
The annual Measuring tax gaps publication estimates the difference between the amount of tax that should, in theory, be paid to HMRC and what is actually paid.
Through our tax policy and process design, and risk-based activities to tackle non-compliance, HMRC collects and protects billions of pounds of ‘compliance yield’ each year – in 2020 to 2021 HMRC generated compliance yield of £30.4 billion. This is revenue that would have otherwise been lost to the Exchequer.
There are a number of components that make up compliance yield including:
- the additional revenue due when we identify past non-compliance (cash expected)
- the estimated effect of our compliance work on customers’ future behaviour (future revenue benefit)
- revenue that we prevented from being lost to the Exchequer (revenue loss prevented)
- legislative changes to close tax loop holes and changes to our processes (upstream product and process yield)
- promoting compliance and preventing non-compliance before it occurs (upstream operational yield)
The size of the tax gap and amount of compliance yield are connected but the impact of compliance yield on the tax gap is not straightforward because of:
-
the methods used to estimate the tax gap
-
the different components of compliance yield
-
wider deterrent effects
-
timing differences
-
factors outside of HMRC’s control
2. Tax gap
2.1 Background
HMRC measures the tax gap because it provides a useful tool for understanding the relative size and nature of non-compliance. This understanding can be applied in many ways:
- it provides a foundation for HMRC’s strategy – thinking about the tax gap helps us understand how non-compliance occurs and how we can address the causes and improve the overall health of the tax administration system
- our tax gap analysis provides insight into which strategies are most effective at reducing the tax gap
- although the tax gap isn’t sufficiently timely or precise enough to set annual targets or manage detailed operational performance, it provides important information which helps us understand our long-term performance
The tax gap also provides important information to the public on tax compliance, creating greater transparency and trust in the tax system.
2.2 What is the tax gap and how is it estimated?
Tax gaps are published annually by HMRC. These estimates are official statistics produced in accordance with the Code of Practice for Statistics. The tax gap is the difference between the amount of tax that should, in theory, be paid to HMRC and what is actually paid.
The ‘theoretical tax liability’ represents the tax that would be paid if all individuals, businesses, and companies complied with both the letter of the law and HMRC’s interpretation of Parliament’s intention in setting law (referred to as the spirit of the law). The total theoretical tax liability is calculated as the tax gap plus the amount of tax receipts received by HMRC. These are our best estimates based on the information available, but there are many sources of uncertainty.
There are numerous approaches to measuring tax gaps. VAT and excise tax gaps are predominantly estimated using a ‘top-down’ approach, by comparing the implied tax due from consumer expenditure data with tax receipts. Most other components are estimated using a ‘bottom-up’ approach, building up from our own operational data and management information. The way we estimate each tax gap component and the data we use is set out in the relevant chapters in the ‘Measuring tax gaps’ Methodological annex.
2.3 Measuring tax gaps 2021 edition – tax gap estimates for 2019 to 2020
Key findings for the tax year 2019 to 2020 are:
- the UK tax gap in 2019 to 2020 is estimated to be 5.3% of total theoretical tax liabilities, with an associated point estimate of £35 billion – this means in 2019 to 2020, HMRC secured 94.7% of all tax due
- there has been a long-term reduction in the overall tax gap, from 7.5% in the tax year 2005 to 2006 to 5.3% in 2019 to 2020
The percentage tax gap provides a better measure of HMRC’s collection of tax over time. It takes into account some of the effects of inflation, economic growth and changes to tax rates, whereas the cash figure does not. For instance, in a growing economy where the tax base is increasing, even if the percentage tax gap remained level, the cash figure would grow.
For further information see our Measuring tax gap report and methodological annex.
3. Compliance yield
HMRC measures the effectiveness of its compliance and enforcement activities through ‘compliance yield’ – that is, the estimate of the additional revenues that HMRC considers it has generated and the revenue losses it has prevented. It is one of HMRC’s main performance measures.
Every year, through our policy and process design and risk-based work to tackle non-compliance, we collect and protect billions of pounds of ‘compliance yield’. This is revenue that would have otherwise been lost to the Exchequer. We take firm action against those who deliberately cheat the system through fraud, avoidance and evasion, and pursue those who refuse to pay what they owe. We apply the most appropriate civil and criminal sanctions to this dishonest minority.
We conduct criminal investigations and seek criminal prosecutions if it is in the public interest, particularly where the behaviour displayed is very serious or where a criminal prosecution will act as a strong deterrent. Our focus is on maximising compliance and minimising the tax gap, rather than chasing arbitrary targets for arrests and prosecutions.
3.1 The different components of compliance yield
Compliance yield includes additional revenue due when we identify past non-compliance (cash expected) and also an estimate of the amount of revenue we prevent from being lost, together with the impact of legislative changes, process improvements and our current compliance activity on future customer behaviour.
The main components of our compliance yield are:
- Cash expected
- Future revenue benefit (FRB)
- Revenue loss prevented (RLP)
- Upstream product and process yield
- Upstream operational yield
- Accelerated payments
Cash expected
The amount of additional revenue due when we identify past non-compliance, reduced by a discount rate to reflect the fact that some of the amounts that we identify will not be collected, for example where a business subsequently becomes insolvent. While the amount of tax due from these cases is very clear, we cannot trace every compliance assessment through to final payment so there is an element of uncertainty involved in this figure.
Future revenue benefit (FRB)
The estimated effects of our compliance interventions on customers’ future behaviour. In July 2016 we published a technical paper setting out the changes we were making to the reporting of future revenue benefit. These changes mean we score FRB in the year that we expect the behaviour change to impact Exchequer receipts. We applied a discount to future revenue benefit brought forward to 2020 to 2021 from previous years to take account of the unforeseen impact of COVID-19 on tax receipts - more information can be found in this update on how HMRC reports FRB.
Revenue loss prevented (RLP)
The revenue prevented from being lost to the Exchequer through our compliance activities. Where we stop or reduce repayment claims as a result of error or fraud, we have a high level of certainty over the RLP generated. Quantifying the RLP generated from disrupting criminal activity requires a greater level of estimation.
Upstream product and process yield
The estimated annual impact on net tax receipts of legislative changes to close tax loopholes and changes to our processes which reduce opportunities to avoid or evade tax. This estimate is subject to independent scrutiny by the Office for Budget Responsibility.
Upstream operational yield
The estimated impact of operational activities undertaken to promote compliance and prevent non-compliance before it occurs through a range of activities such as education, nudges and prompt campaigns. Upstream operational yield includes the current impact and future behavioural effect of process changes.
Accelerated payments
The estimate of the amount that users of avoidance schemes have paid to HMRC upfront while their dispute is being resolved, as well as an estimate of the behavioural change that this policy has generated. From 2021-22 accelerated payment yield is negligible and included in cash expected or upstream operational yield as appropriate.
3.2 Table 1: Compliance yield, £m
| 2012-13 | 2013-14 | 2014-15 | 2015-16 | 2016-17 | 2017-18 | 2018-19 | 2019-20 | 2020-21 | |
|---|---|---|---|---|---|---|---|---|---|
| Cash expected £m | 8,975 | 9,182 | 9,838 | 9,028 | 10,340 | 10,326 | 13,138 | 9,042 | 7,381 |
| Upstream operational yield £m | - | - | - | - | - | - | - | 4,058 | 3,056 |
| Revenue lost prevented £m | 6,512 | 8,003 | 7,869 | 6,795 | 7,926 | 9,696 | 9,298 | 10,551 | 8,174 |
| Future revenue benefit £m | 4,441 | 5,508 | 6,748 | 6,238 | 6,259 | 6,080 | 7,632 | 8,998 | 5,905 |
| Upstream product and process yield £m | 794 | 1,233 | 1,335 | 2,110 | 3,013 | 3,373 | 3,719 | 4,187 | 5,925 |
| Accelerated payments £m | - | - | 768 | 2,436 | 1,317 | 817 | 283 | 113 | 8 |
| Total compliance yield £m | 20,722 | 23,926 | 26,558 | 26,607 | 28,855 | 30,292 | 34,070 | 36,948 | 30,450 |
4. Compliance yield and how this impacts the tax gap
4.1 The relationship between the tax gap and compliance yield
HMRC’s risk-based activities to tackle non-compliance aim to increase tax receipts and thereby reduce the tax gap. Our approach to tackling non-compliance is underpinned by cutting-edge data analysis, which we use to identify where tax is most at risk of not being paid. From this insight, we can design tailored, targeted and proportionate interventions to address these risks. However, there is no direct relationship between the tax gap and the many components of compliance yield over any specific tax year. The size of the tax gap and amount of compliance yield are connected but the impact of compliance yield on the tax gap is not straightforward.
For example, as shown in figure 1:
- between 2012 to 2013 and 2013 to 2014 compliance yield increased from 4.1% to 4.5% of total tax owed whilst the tax gap increased from 6.7% to 7.1%
- between 2014 to 2015 and 2017 to 2018 compliance yield stabilised around 4.8% of the total amount of tax owed, while the tax gap reduced from 6.7% to 5.1%
4.2 Figure 1: Tax gap and compliance yield as percentage of total theoretical tax liabilities
| Year | Tax gap (as percentage of total theoretical tax liabilities) | Compliance yield (as percentage of total theoretical tax liabilities) |
|---|---|---|
| 2012-13 | 6.7% | 4.1% |
| 2013-14 | 7.1% | 4.5% |
| 2014-15 | 6.7% | 4.8% |
| 2015-16 | 5.7% | 4.7% |
| 2016-17 | 5.4% | 4.8% |
| 2017-18 | 5.1% | 4.8% |
| 2018-19 | 5.0% | 5.2% |
| 2019-20 | 5.3% | 5.5% |
The reason why the tax gap and amount of compliance yield are connected but the impact of compliance yield on the tax gap is not straightforward is because of several factors including:
- the methods used to estimate the tax gap
- the different components of compliance yield
- wider deterrent effects
- timing differences
- factors outside of HMRC’s control
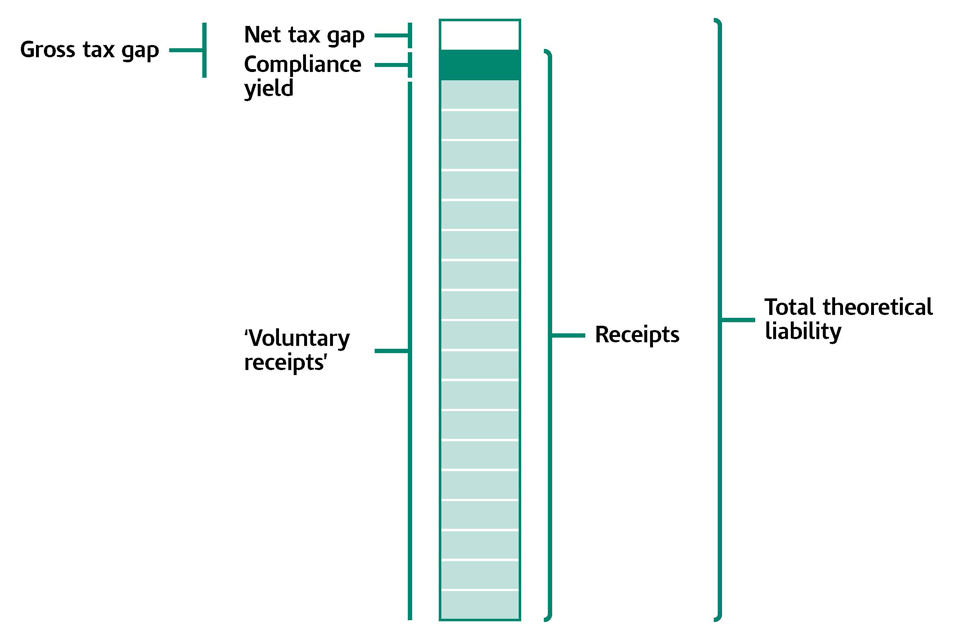
HMRC’s tax gap estimates the amount of tax unpaid after accounting for ‘voluntary receipts’ (receipts from taxpayers who get their tax right first time) and compliance yield (the additional tax receipts from taxpayers after HMRC’s activities to tackle non-compliance). This is illustrated in Figure 2 below.
Figure 2 shows the total theoretical liability due to HMRC. Total theoretical liabilities is the sum of ‘voluntary receipts’, which is the vast majority of total theoretical liabilities, plus the gross tax gap. The gross tax gap is the sum of ‘compliance yield’ receipts and the net tax gap.
4.3 Figure 2: Relationship between total theoretical liability, voluntary receipts, compliance yield and net tax gap
4.4 Methods used to estimate the tax gap
There are numerous approaches to measuring tax gaps. Whilst tax gaps are estimated net of compliance yield, each tax head’s tax gap methodology may adjust for compliance receipts differently. As a result, it is difficult to compare the overall tax gap directly to compliance receipts in a given tax year. The tax gap are our best estimates based on the information available, but there are many sources of uncertainty and potential error. For this reason, it is best to focus on the trend in the results rather than the absolute numbers when interpreting findings.
4.5 The different components of compliance yield
Different types of compliance yield have different relationships with the tax gap. For example, if the volume of organised criminal attacks on a tax repayment system increases and HMRC is successful in preventing these fraudulent claims, compliance yield would increase (as more RLP would be scored) but the tax gap would stay the same. This is because this RLP stops the tax gap from increasing, rather than decreases it. The refused claims would not affect the total theoretical liability or receipts but preventing the repayment would increase compliance yield.
The components of compliance yield impact the tax gap in different ways.
Cash expected
This reduces the cash value of the tax gap in the tax year when HMRC receives the payment of the additional revenue due.
Future revenue benefit (FRB)
This is tax gap reducing since it represents an approximation of revenue that otherwise may not have been paid. The impact on the tax gap is uncertain because FRB is an estimate of the effects our compliance interventions on customers’ future behaviour.
Revenue loss prevented (RLP)
This yield measure prevents the tax gap from increasing by stopping, for example, tax repayment fraud.
Upstream product and process yield
This is tax gap reducing since it represents an approximation of revenue that otherwise may not have been paid. The impact on the tax gap is uncertain because it is an estimate of the effects of legislative changes to close tax loopholes and changes to our processes which aim to reduce opportunities to avoid or evade tax.
Upstream operational yield
This is tax gap reducing since it represents an approximation of revenue that otherwise may not have been paid.
4.6 Wider deterrent effects
As well as compliance yield, there is also a deterrent effect that applies to many of our tax policy and process design, and risk-based work to tackle non-compliance. Deterrence occurs when there is a change in taxpayers’ behaviour, that leads to additional tax revenue, as a result of HMRC activity, but without direct contact from HMRC.
Measuring the wider deterrent effect is complicated and depends upon variable factors. In most cases, HMRC does not measure the wider deterrent effect, although it helps to increase the amount of voluntary receipts and thereby reduce the tax gap. In some limited cases, we have been able to evidence the deterrent impact of some of our work and reported this in upstream operational yield. For example, we reported some upstream operational yield when evidence showed that a compliance check on an agent’s client resulted in increased receipts in the agent’s other clients.
4.7 Timing differences
The cash expected element of compliance yield represents additional tax liabilities due from taxpayers after HMRC activities to tackle past non-compliance. Cash expected is tax gap closing and is part of the tax gap calculation because the payment of additional liabilities is included in receipts before the tax gap is estimated. Because the tax gap reflects a single tax year, and some compliance cases can cover multiple tax years, the year in which cash expected is recorded as compliance yield (and paid) is rarely the same as the year to which liabilities relate. Therefore, in a given tax gap year, it is possible that the amount of compliance yield HMRC secures might increase while the percentage tax gap remains unchanged.
Chapter C of the tax gap methodological annex explains how some methodologies specifically use the cash expected element of compliance yield in the tax gap calculation.
4.8 Factors outside of HMRC’s control
A range of factors outside of HMRC’s control affect the tax gap estimate. The tax gap estimate may change because of economic growth and tax policy that impacts both total receipts as well as a taxpayers’ compliance. For example, in a growing economy where the tax base is increasing, even if the percentage tax gap remained level, the tax gap cash figure would grow. The effects may not be uniform, different factors, such as the number of new businesses, new customers and customer behaviours affecting the levels of voluntary compliance all affect the tax gap.
4.9 Illustrative examples to demonstrate how compliance yield impacts the tax gap
The examples below illustrate the types of work that are recorded under each component of compliance yield and outline how these map to the tax gap.
Example 1: Cash expected and future revenue benefit
HMRC investigates a company’s Corporation Tax (CT) return and discovers that they have under-declared profits. HMRC concludes the company should pay an additional £2 million in CT for each of the previous three years. As a result, the company agrees the outstanding tax bill of £6 million along with interest and penalties of £1 million – HMRC records this as £7 million cash expected. The £7 million is paid to HMRC immediately.
The cash expected element of compliance yield represents additional liabilities due which arise from past non-compliance. The outstanding CT element of cash expected is tax gap closing. The tax year in which the payment for past CT non-compliance is received by HMRC increases the CT receipts in that year and therefore reduces the tax gap in that year.
Continuing the example above, the company puts in place a new accounting system to get its tax return right and prevent the same issue occurring in future. This leads to the company paying an additional £2 million in subsequent years. HMRC will record this improved behaviour for the next two tax returns and records this as a further £4 million of FRB. Under HMRC’s new approach to FRB reporting, the figure of £2 million FRB is recorded in each of the following two years.
As FRB reflects a customer’s future compliance behaviour, it is not explicitly reflected in the calculation of tax gap estimates. However, without HMRC compliance intervention the tax gap would be larger. The new approach to FRB means that the year it is recorded should match more closely with the year’s tax gap it is preventing from increasing.
Table 2: Example 1 simplified impact on compliance yield and tax gap
| Tax year | Year - 2 | Year - 1 | Year 0 | Year + 1 | Year + 2 |
|---|---|---|---|---|---|
| Change in customer liability | +£2m | +£2m | +£2m | +£2m | +£2m |
| HMRC receipts | £0 | £0 | +£7m | +£2m | +£2m |
| Compliance yield reported | - | - | £7m cash expected* | £2m FRB | £2m FRB |
| Tax gap impact | +£2m | +£2m | -£6m | -£2m | -£2m |
*Note for Table 2: Cash expected includes tax plus interest and penalties
Example 2: Revenue loss prevented
A business makes a claim for a repayment of £250,000. The repayment claim is selected for review prior to repayment. It is established that an invoice has been included which was for £100,000 against business entertainment, upon which VAT cannot be recovered. Therefore, HMRC reduces the repayment claim by £100,000. This results in revenue loss prevented of £100,000 as VAT was claimed by the business but HMRC did not make the repayment.
HMRC provided intelligence leading to the identification and dismantling of an overseas cigarette factory used by organised criminals to target the UK. More than 22,000 kilos of tobacco and 2.5 million cigarettes were seized. In total HMRC reported revenue loss prevented of £82.2 million, the equivalent of one year’s production (based on a 60% efficiency rate in the factory.)
RLP represents cases where HMRC has refused fraudulent or incorrect repayment claims or has disrupted criminal activity, for example seizures of illicit alcohol or tobacco. RLP activity is broadly preventing growth in the tax gap. An increase in RLP can indicate that HMRC is having to do more to maintain the tax gap at its current level. RLP is not reflected in the tax gap calculation. However, if HMRC were not generating RLP, the tax gap would be higher.
Example 3: Upstream product and process yield
A direct UK Income Tax charge was introduced to reduce opportunities for large multinationals to gain an unfair competitive advantage by holding intangible property in low tax offshore jurisdictions and level the playing field for businesses operating in UK markets. HMRC claimed £1.26 billion in upstream product and process yield which would have been lost to the exchequer in 2020 to 2021 if the avoidance opportunity had not been closed.
Upstream product and process yield is an increase in tax receipts from legislative changes to reduce opportunities for fraud and avoidance and educational activity to reduce errors. It is tax gap closing activity, however it is not explicitly reflected in tax gap estimates. The upstream product and process yield that we report relates to the year in which tax receipts are increased, which is similar but not the same as the year in which the liability arises.
Example 4: Upstream operational yield
HMRC identified an annual tax loss of £20 million due to errors applying Class 4 NIC exemption criteria. Digital prompts incorporated into the online SA system significantly reduced the number of errors. These prompts are being extended to third party software. £10 million upstream operational yield is recorded in the year of introduction and two subsequent years assuming it reduced these errors by 50%.
Upstream activities promote compliance and prevent non-compliance by enabling customers and agents to get their tax, customs affairs and payments entitlements right at the earliest possible opportunity. It removes opportunities and incentives to make mistakes or to bend or break the rules. This reduces future tax gaps by increasing voluntary receipts.
Table 3: Example 4 simplified impact on compliance yield and tax gap
| Tax year | Year - 2 | Year - 1 | Year 0 | Year + 1 | Year + 2 |
|---|---|---|---|---|---|
| Operational change | - | - | Digital Prompts | Digital Prompts | Digital Prompts |
| HMRC receipts | £0 | £0 | £10m | £10m | £10m |
| Compliance yield reported | - | - | £10m | £10m | £10m |
| Tax gap impact | +£20m | +£20m | -£10m | -£10m | -£10m |