Syphilis in England, 2019 to 2021
Published 22 November 2022
Applies to England

© Crown copyright 2022
This publication is licensed under the terms of the Open Government Licence v3.0 except where otherwise stated. To view this licence, visit nationalarchives.gov.uk/doc/open-government-licence/version/3 or write to the Information Policy Team, The National Archives, Kew, London TW9 4DU, or email: psi@nationalarchives.gov.uk.
Where we have identified any third party copyright information you will need to obtain permission from the copyright holders concerned.
This publication is available at https://www.gov.uk/government/publications/syphilis-quarterly-data-for-england/syphilis-in-england-2019-to-2021
This report provides a descriptive analysis of data on syphilis diagnoses and testing in England from January 2019 to December 2021.
1. Main messages
The main messages of this report are as follows:
- by the end of 2021, diagnoses of infectious syphilis returned to pre-coronavirus (COVID-19) pandemic levels, that is, quarter 4 2021 (Q4 2021, 1 October to 31 December 2021) versus quarter 4 2019 (Q4 2019, 1 October to 31 December 2019)
- gay, bisexual and other men who have sex with men remain disproportionately affected by syphilis (71% of all infectious syphilis diagnoses in 2021)
- the rate of diagnoses varies by ethnicity, with the rate remaining highest in people of Black Caribbean backgrounds
- diagnoses increased among individuals born in all world regions – among those born in Central and South America, Europe (non-UK) and the Caribbean, numbers were higher at the end of 2021 than pre-COVID-19 pandemic levels
- the proportion of syphilis diagnoses that are infectious has remained fairly stable between 2019 and 2021
- syphilis testing by the end of 2021 remained lower than pre-COVID-19 pandemic levels (2019)
- the proportion of syphilis tests delivered via online testing increased during the COVID-19 pandemic and remains at approximately 50%, which is more than double the proportion in 2019
For information on other sexually transmitted infection (STI) diagnoses, please refer to the sexually transmitted infections and screening for chlamydia in England: 2021 report.
2. Epidemiology
2.1 Trends of infectious syphilis
Diagnoses of infectious syphilis continued to increase in 2021 (Figure 1), with the number of diagnoses in Q4 2021 exceeding pre-pandemic levels (2,005 in Q4 2019 versus 2,091 in Q4 2021). However, the annual number of infectious syphilis diagnoses in 2021 remained lower than 2019 (7,506 versus 8,010 respectively) (Table 1).
Figure 1. Number of infectious syphilis diagnoses, 2019 to 2021, England*
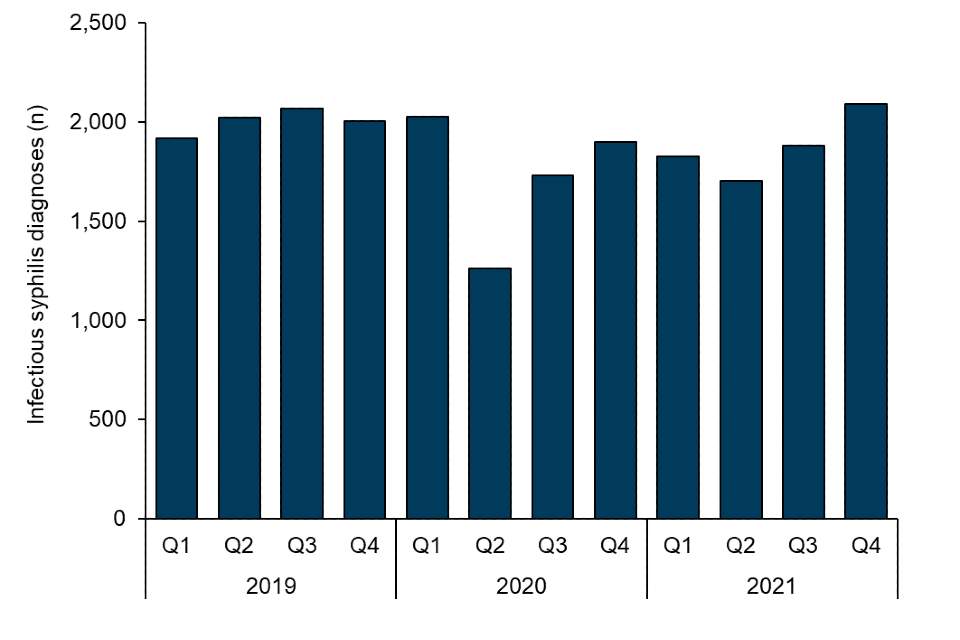
*Infectious syphilis is defined as primary, secondary, and early latent syphilis. Q1 is defined as quarter 1, 1 January to 31 March. Q2 is defined as quarter 2, 1 April to 30 June. Q3 is defined as quarter 3, 1 July to 30 September. Q4 is defined as quarter 4, 1 October to 31 December.
Table 1. Annual number of infectious syphilis diagnoses
| Year | Number of diagnoses |
|---|---|
| 2019 | 8,010 |
| 2020 | 6,923 |
| 2021 | 7,506 |
2.2 Trends of syphilis diagnoses by clinical stage
Whilst there was a reduction in the proportion of infectious syphilis from 80% to 73% between Q4 2020 and Q1 2021, the proportion of infectious syphilis has returned to pre-COVID-19 pandemic levels at 78% in Q4 2021.
Figure 2. Number of syphilis diagnoses by clinical stage of infection and percentage of infectious diagnoses, 2019 to 2021, England*
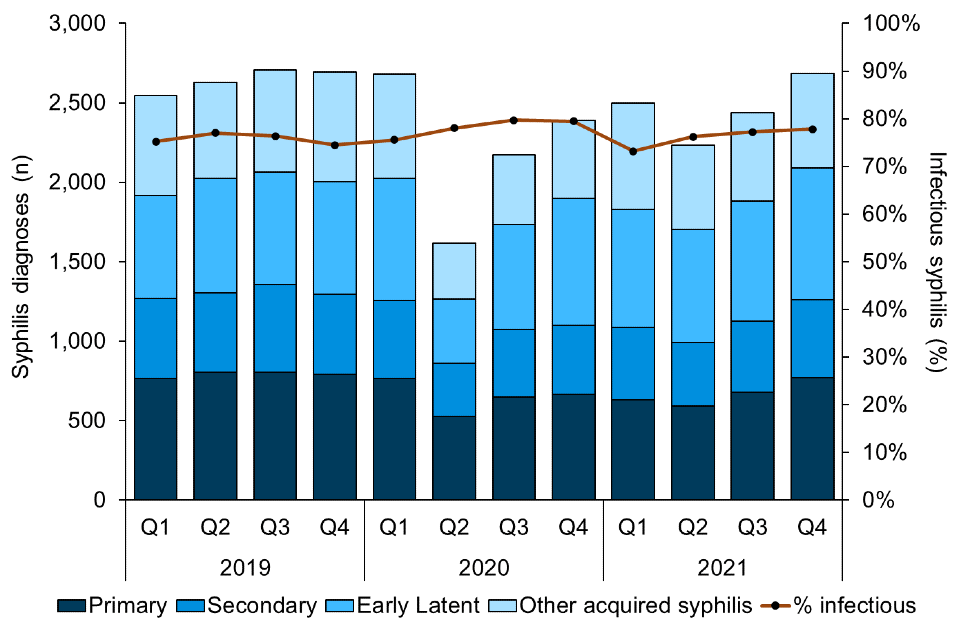
*Infectious syphilis is defined as primary, secondary, and early latent syphilis. Other acquired syphilis includes cardiovascular, neurosyphilis or any other late or latent syphilis.
2.3 Trends of infectious syphilis diagnoses by gender and sexual orientation
The distribution of infectious syphilis diagnoses by gender and sexual orientation remained consistent in 2021 compared to previous years – with 79% among gay, bisexual and other men who have sex with men (GBMSM) in Q4 2021 compared to 78% in Q4 2019 (Figure 3).
Data for GBMSM is under-reported in London for 2021 (also affecting the GBMSM total in England for 2021). Therefore, the associated trends in diagnoses among GBMSM should also be considered to be underestimated. Please refer to the ‘Technical note’ in the Sexually transmitted infections and screening for chlamydia in England: 2021 report for further information.
Figure 3. Number of infectious syphilis diagnoses by gender and sexual orientation, 2019 to 2021, England*
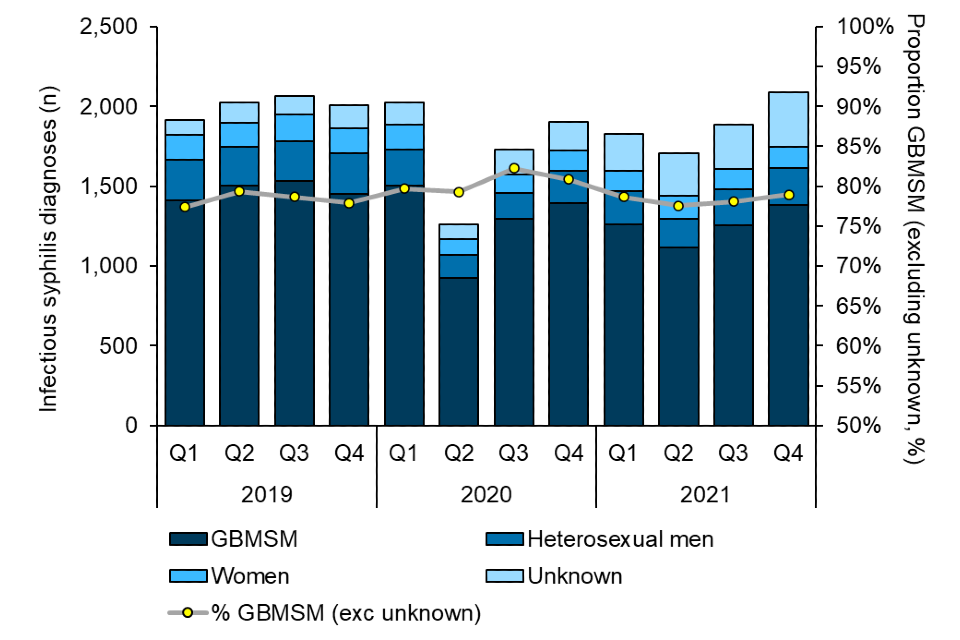
*Women includes women who have sex with men (WSM), and women who have sex with women (WSW); and has not been disaggregated due to small numbers among WSW.
2.4 Trends of infectious syphilis diagnoses by gender and sexual orientation and by age group
In 2021, the distribution of women with infectious syphilis diagnoses is generally younger (median of 26 years, interquartile range of 22 to 33 years) than that of heterosexual men (median of 28 years, interquartile range of 24 to 36 years) and GBMSM (median of 32 years, interquartile range of 26 to 41 years) (Figure 4).
Most diagnoses in all groups occur in the 25 to 34 age group (33%, 37% and 38% in GBMSM, heterosexual men and women, respectively).
Figure 4. Distribution of infectious syphilis diagnoses by gender and sexual orientation and by age group, 2021, England*
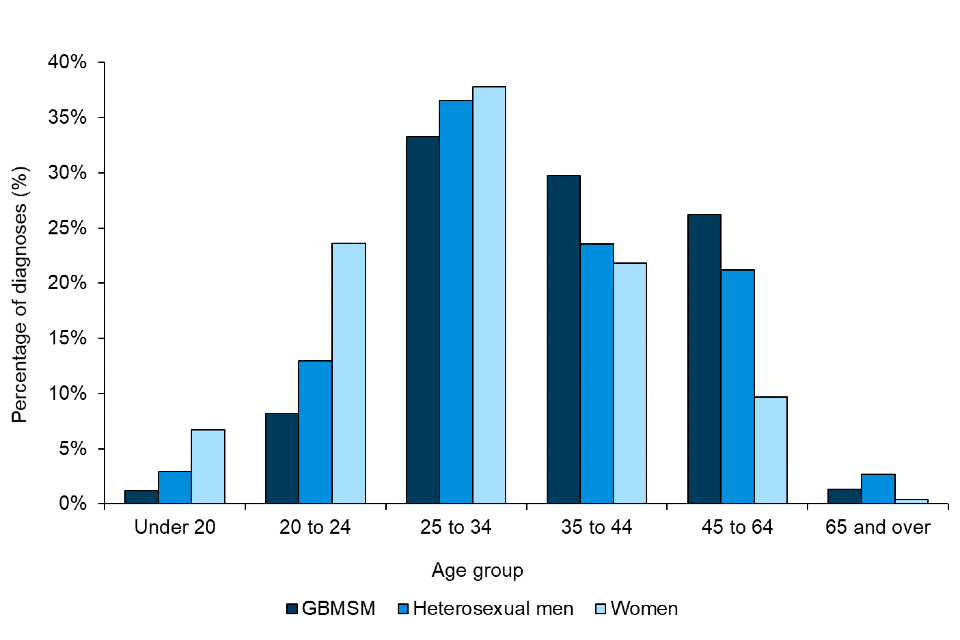
*Women includes women who have sex with men (WSM), and women who have sex with women (WSW); and has not been disaggregated due to small numbers among WSW.
2.5 Trends of infectious syphilis diagnoses by HIV status
The number of infectious syphilis diagnoses among those living with HIV remained fairly constant during 2019 to 2021. The proportion of diagnoses made among HIV negative or undiagnosed individuals has also remained fairly stable, at 78% in Q4 2021 (Figure 5).
Figure 5. Number of infectious syphilis diagnoses by HIV status, 2019 to 2021, England

3. Testing
3.1 Trends of syphilis testing, test positivity, and test modality
Despite steady increases, the number of syphilis tests in Q4 2021 remained lower than pre-pandemic levels (375,524 in Q4 2019 versus 330,359 in Q4 2021, Figure 6). The annual number of syphilis tests in 2021 was lower compared to 2019 (1,228,206 versus 1,527,002, respectively) (Table 2).
Whilst test positivity increased during the first (beginning March 2020) and second (beginning November 2020) national COVID-19 lockdowns, it returned to levels similar to those seen in 2019, at 0.6% in Q4 2021 (Figure 6).
Figure 6. Number of syphilis tests and test positivity, 2019 to 2021, England
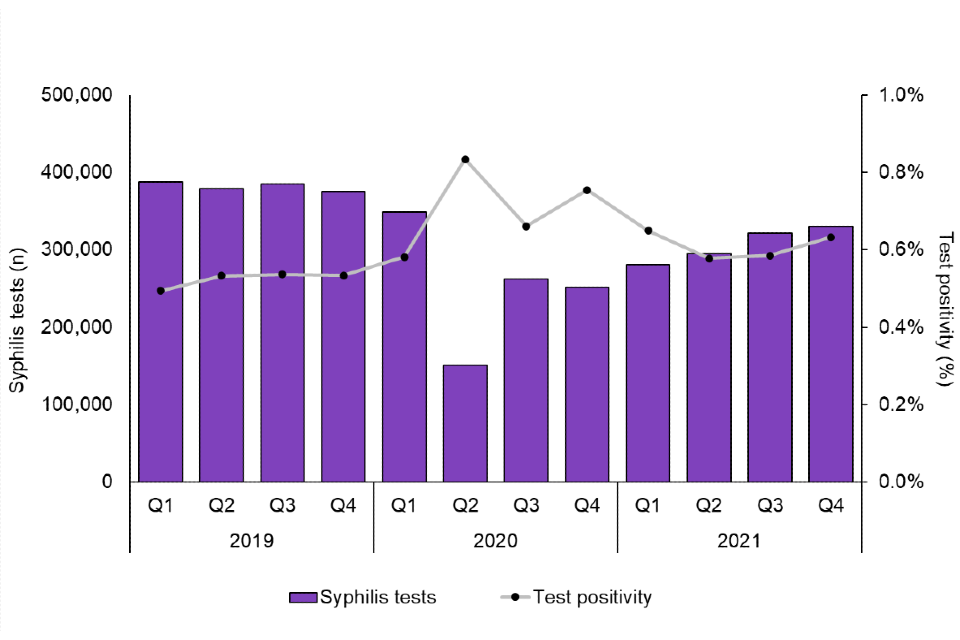
Table 2. Annual number of syphilis tests
| Year | Number of tests |
|---|---|
| 2019 | 1,527,002 |
| 2020 | 1,013,961 |
| 2021 | 1,228,206 |
Following the sharp increase of online tests during the pandemic, the proportion of tests that are accessed online stabilised at roughly 50% by the end 2021, which is more than double the proportion in 2019 (Figure 7).
Figure 7. Number of syphilis tests by modality and proportion of tests that were accessed online, 2019 to 2021, England

In this report, online or internet data is sourced from dedicated (standalone) online services reporting to the GUMCAD STI Surveillance System. GUMCAD is in the process of being updated to also include data from satellite online services provided by face-to-face SHSs. Therefore, the proportion of online tests reported in this data should be considered as an underestimate.
4. Health inequalities
4.1 Trends of infectious syphilis diagnoses by ethnicity
In 2021, the rate of infectious syphilis diagnoses per 100,000 population remains highest among people of Black Caribbean background (Figure 8).
The rate of infectious syphilis per 100,000 population increased in people of Black African backgrounds between 2019 and 2021 (15.1 to 19.9 per 100,000 population). Rates have decreased in people of White and Black Other backgrounds in the same period (12.9 to 11.7 per 100,000 population and 26.6 to 17.6 per 100,000 population, respectively).
Figure 8. Rate of infectious syphilis per 100,000 population by ethnic group, 2019 and 2021, England*

*Office for National Statistics (ONS) population estimates by ethnic group were only available for 2011 at the time of publication. Therefore, population estimates for 2011 have been used as a proxy for 2019 and 2021.
4.2 Trends of infectious syphilis diagnoses by index of multiple deprivation (IMD) and by gender and sexual orientation
In 2021, infectious syphilis diagnoses continued to be made more frequently among people living in more deprived areas in England (Figure 9).
Diagnoses among heterosexual men and women are most common among people living in the most deprived areas, whereas among GBMSM, diagnoses are most common in the second most deprived areas.
In women, 37% (197 out of 530) of diagnoses are made in people living in the most deprived areas compared to 31% (263 out of 840) and 24% (1,182 out of 4,939) in heterosexual men and GBMSM respectively.
As underlying population distributions by IMD and gender and sexual orientation are not available, caution should be taken when interpreting this data.
Figure 9. Distribution of infectious syphilis diagnoses by IMD and by gender and sexual orientation, 2021, England*
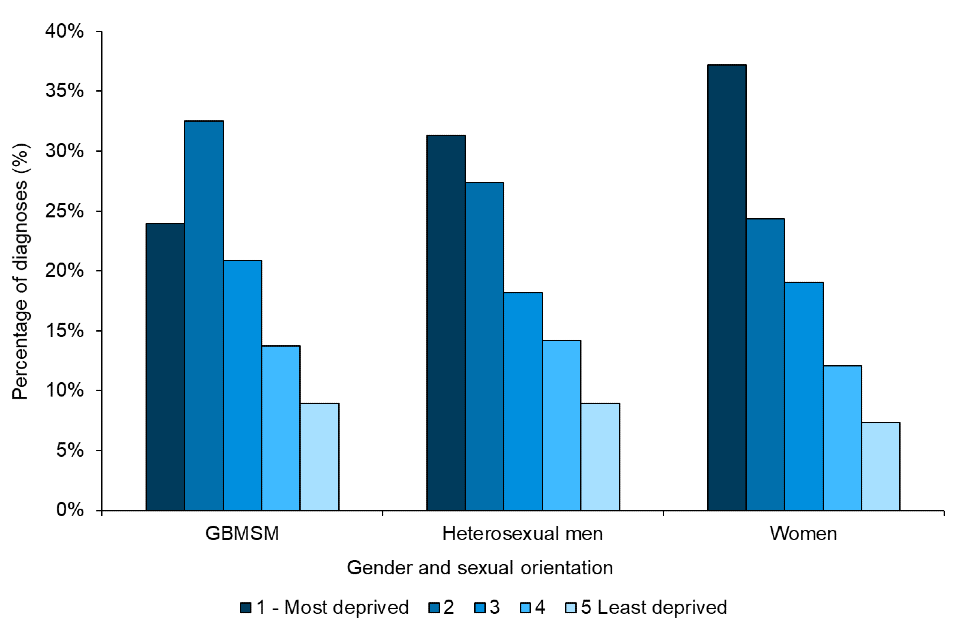
*Only diagnoses where gender and sexual orientation are known are included. Women includes women who have sex with men (WSM), and women who have sex with women (WSW); and has not been disaggregated due to small numbers among WSW.
4.3 Trends of infectious syphilis diagnoses and test positivity by region of birth
Diagnoses among individuals born in Europe (non-UK), Central and South America and the Caribbean increased in 2021 and are higher than pre-pandemic levels (indicated by red shading in Table 3). The highest number of diagnoses occur among individuals born in the UK.
Table 3. Number of infectious syphilis diagnoses by quarter and region of birth, 2019 to 2021, England*

*Individual colour formatting is applied within each row to show trends by region of birth. An accessible text alternative for this table is available.
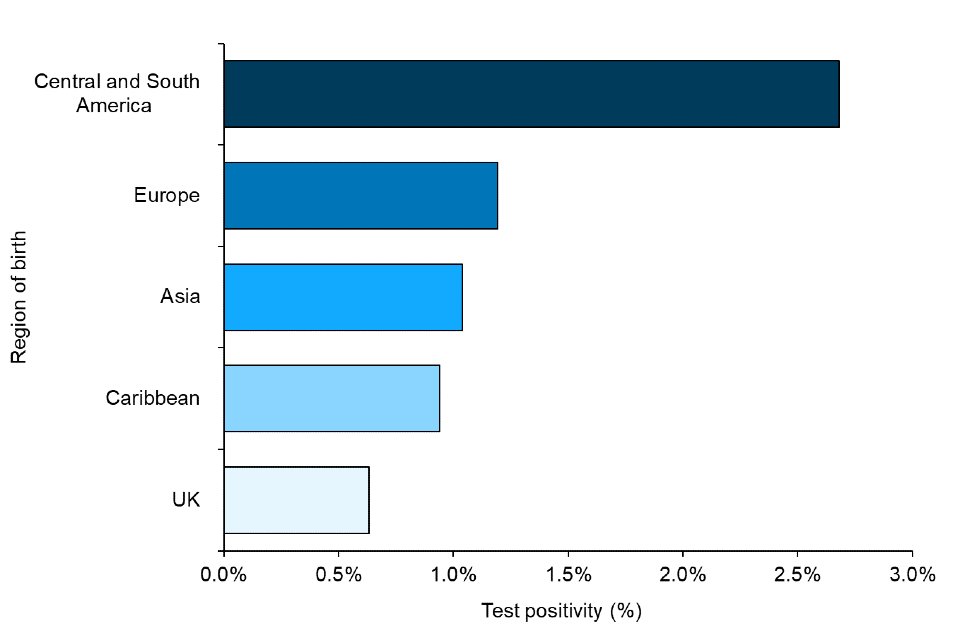
Test positivity is highest among individuals born in Central and South America and is more than double the next highest test positivity, Europe (2.7% versus 1.2%, respectively) (Figure 10).
Figure 10. Syphilis test positivity by region of birth, 2021, England
5. Appendix
5.1 Regional trends of syphilis testing
The highest number of syphilis tests by region occur among individuals who live in London (Table 4).
In Q4 2021, the quarterly number of syphilis tests among individuals who live in London was similar to pre-COVID-19 pandemic levels (135,151 in Q4 2019 versus 131,596 in Q4 2021). However, tests among individuals who live in the South West of England remains below pre-COVID-19 pandemic levels (26,789 in Q4 2019 versus 17,185 in Q4 2021). By Q4 2021, the quarterly number of tests were approaching pre-COVID-19 pandemic levels in all other regions (indicated by similar shades of green in Q4 2021 and Q4 2019 in Table 4).
Table 4. Number of syphilis tests by quarter and region, 2019 to 2021, England*

*Only tests where region is known are included. Individual colour formatting is applied within each row to show regional trends. An accessible text alternative for this table is available.
5.2 Regional trends of infectious syphilis diagnoses
In Q4 2021, the quarterly number of infectious syphilis diagnoses was higher than pre-COVID-19 pandemic levels in individuals living in the East of England (78 in Q4 2019 versus 133 in Q4 2021), West Midlands (115 in Q4 2019 versus 135 in Q4 2021) and Yorkshire and Humber (80 in Q4 2019 versus 100 in Q4 2021) (indicated by red shading in Q4 2021 in Table 5). The highest number of infectious syphilis diagnoses by region occur among individuals who live in London.
In Q4 2021, the quarterly number of diagnoses was lower than pre-COVID-19 pandemic in individuals who live in the North East (73 in Q4 2019 versus 63 in Q4 2021) and the South West (100 in Q4 2019 versus 77 in Q4 2021). The number of diagnoses in Q4 2021 was similar to pre-COVID-19 pandemic levels in all other regions.
Table 5. Number of infectious syphilis diagnoses by quarter and region, 2019 to 2021, England*

*Only diagnoses where region is known are included. Individual colour formatting is applied within each row to show regional trends. For trends by upper tier local authority, see the Sexual and Reproductive Health Profiles. An accessible text alternative for this table is available.
5.3 Regional trends of syphilis test positivity
Most regions have seen similar trends in test positivity (Table 6). Most regions saw a rise in Q2 2020 and some saw another in Q4 2020 (likely due to a reduction in overall testing and prioritisation of symptomatic individuals during lockdowns).
Whilst positivity has been relatively stable since then, albeit with some variation, it remains slightly higher than pre-pandemic in most regions.
Table 6. Syphilis test positivity by quarter and region, 2019 to 2021, England*
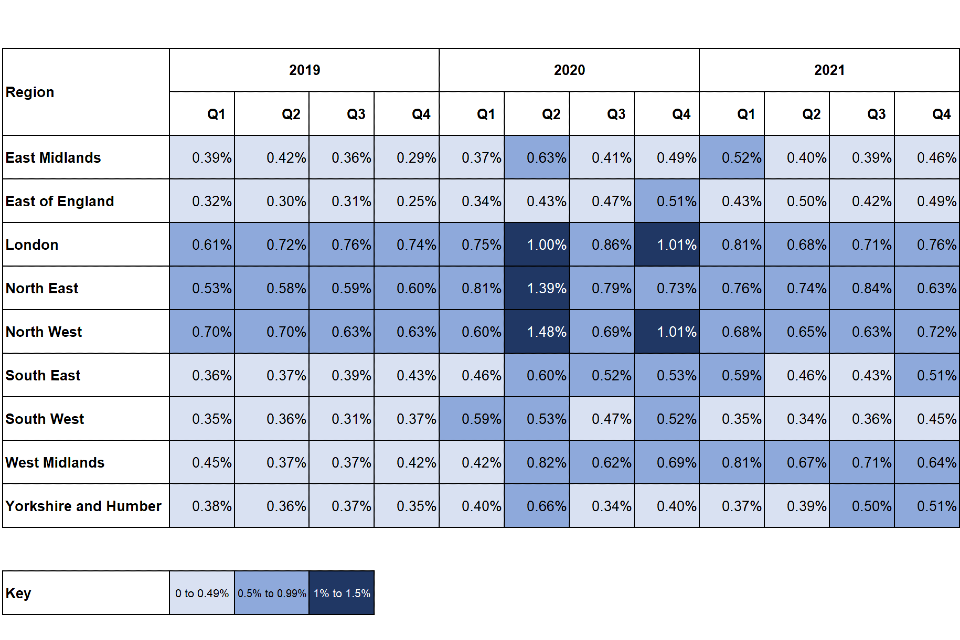
*Only test positivity where region is known are included. An accessible text alternative for this table is available.
6. Syphilis Action Plan
In June 2019, the UK Health Security Agency (formerly Public Health England) published the Syphilis Action Plan, bringing together existing recommendations for UKHSA and partner organisations to address the continued increase in syphilis diagnoses in England.
Four pillars of action were defined as follows:
- Increase testing frequency of high-risk GBMSM and re-testing of syphilis cases after treatment.
- Deliver partner notification to British Association of Sexual Health and HIV (BASHH) standards.
- Maintain high antenatal screening coverage and vigilance for syphilis throughout antenatal care.
- Sustain targeted health promotion.
Technical notes
This report describes syphilis trends in England between 2019 and 2021.
Data is presented quarterly where appropriate.
All data presented is sourced from the GUMCAD STI Surveillance System, which collects data on STI testing and diagnoses provided at sexual health services.
SHSs refer to services offering specialist (Level 3) STI-related care such as genitourinary medicine (GUM) and integrated GUM and sexual and reproductive health (SRH services). They also include other services offering non-specialist (Level 1 or Level 2) STI-related care and community-based settings. Further details on levels of sexual healthcare provision are provided in the BASHH Standards for the Management of STIs (Appendix B).
Residence data represent data from patients accessing services located in England who are also residents in England and those reported with an unknown residence (data for those outside of England is not included).
Sexual health services may be provided via face-to-face, telephone or internet consultations.
Data represent the number of diagnoses or tests reported, not the number of people diagnosed or tested.
ONS population estimates by ethnic group were only available for 2011 at the time of publication. Therefore, population estimates for 2011 have been used as a proxy for 2019 and 2021.
Data reported with an unknown gender and/or sexual orientation are included in the data total.
Sexual orientation data reflect the sexual orientation of attendees reported at the date of STI diagnosis.
GBMSM refers to gay, bisexual and other men who have sex with men. WSW refers to lesbians and other women who have sex with women exclusively. WSM refers to heterosexual and bisexual women who have sex with men.
Syphilis test positivity is defined as the number of infectious syphilis (primary, secondary, and early latent stage) diagnoses divided by all syphilis tests.
Complications of syphilis may be underreported as cases with cardiovascular and neurosyphilis may present in clinical settings other than SHSs and therefore will not be recorded in the GUMCAD STI Surveillance System.
Acknowledgements
Thank you to all sexual health services and GUMCAD reporters.
Contributors
Hannah Charles, Katy Sinka, Erna Buitendam, Mateo Prochazka, Helen Fifer, Stephanie Migchelsen, Norah O’Brien, Shahin Parmar, Hamish Mohammed, Debbie Mou, Freddy Green
Suggested citation
Green F, Charles H, Buitendam E, Prochazka M, Fifer H, Migchelsen S, O’Brien N, Parmar S, Mou D, Mohammed H, Sinka K. Syphilis in England, 2019 to 2021. November 2022, UK Health Security Agency, London
Accessible tables
Table 3. Number of infectious syphilis diagnoses by quarter and region of birth, 2019 to 2021, England*
| Region of birth | Q1 2019 | Q2 2019 | Q3 2019 | Q4 2019 | Q1 2020 | Q2 2020 | Q3 2020 | Q4 2020 | Q1 2021 | Q2 2021 | Q3 2021 | Q4 2021 |
|---|---|---|---|---|---|---|---|---|---|---|---|---|
| UK | 1,130 | 1,189 | 1,223 | 1,186 | 1,217 | 712 | 946 | 1,079 | 1,057 | 987 | 1,086 | 1,148 |
| Europe | 322 | 348 | 300 | 314 | 314 | 218 | 290 | 326 | 298 | 259 | 300 | 364 |
| Central and South America | 100 | 108 | 118 | 122 | 115 | 81 | 144 | 131 | 119 | 116 | 128 | 156 |
| Caribbean | 21 | 21 | 20 | 15 | 18 | 16 | 20 | 18 | 14 | 16 | 19 | 22 |
| Asia | 102 | 105 | 130 | 109 | 113 | 52 | 87 | 95 | 98 | 99 | 109 | 117 |
| Africa | 63 | 67 | 68 | 53 | 67 | 37 | 81 | 59 | 67 | 59 | 66 | 69 |
| Northern America | 13 | 18 | 13 | 21 | 22 | 13 | 22 | 21 | 16 | 10 | 13 | 20 |
| Oceania | 23 | 12 | 36 | 32 | 24 | 20 | 22 | 29 | 17 | 17 | 12 | 13 |
| Unknown | 142 | 155 | 158 | 153 | 137 | 114 | 120 | 143 | 142 | 141 | 150 | 182 |
*Individual colour formatting is applied within each row to show trends by region of birth.
Table 4. Number of syphilis tests by quarter and region, 2019 to 2021, England*
| Region | Q1 2019 | Q2 2019 | Q3 2019 | Q4 2019 | Q1 2020 | Q2 2020 | Q3 2020 | Q4 2020 | Q1 2021 | Q2 2021 | Q3 2021 | Q4 2021 |
|---|---|---|---|---|---|---|---|---|---|---|---|---|
| East Midlands | 23,773 | 23,649 | 23,847 | 23,283 | 20,567 | 6,470 | 11,878 | 13,538 | 14,529 | 15,564 | 16,203 | 17,523 |
| East of England | 33,980 | 32,645 | 33,815 | 30,699 | 27,184 | 11,957 | 19,547 | 20,444 | 21,756 | 21,934 | 25,178 | 26,970 |
| London | 136,526 | 138,273 | 136,556 | 135,151 | 133,055 | 65,452 | 108,940 | 96,448 | 110,683 | 117,672 | 131,836 | 131,596 |
| North East | 12,025 | 11,821 | 11,969 | 12,206 | 10,372 | 3,089 | 6,985 | 6,940 | 6,708 | 8,889 | 8,695 | 9,983 |
| North West | 37,321 | 36,184 | 37,646 | 38,678 | 34,893 | 8,730 | 21,263 | 21,884 | 28,277 | 29,020 | 31,158 | 32,336 |
| South East | 54,610 | 53,943 | 54,276 | 52,408 | 46,915 | 23,634 | 39,892 | 38,648 | 38,279 | 40,621 | 43,248 | 43,301 |
| South West | 29,850 | 28,258 | 28,460 | 26,789 | 23,823 | 12,721 | 18,477 | 17,198 | 18,510 | 17,217 | 17,409 | 17,185 |
| West Midlands | 29,514 | 26,816 | 27,690 | 27,319 | 24,659 | 7,291 | 14,394 | 15,687 | 17,820 | 18,942 | 21,014 | 21,022 |
| Yorkshire and Humber | 23,675 | 22,941 | 24,027 | 22,873 | 21,345 | 8,170 | 14,928 | 14,907 | 17,655 | 17,094 | 17,868 | 19,619 |
*Only tests where region is known are included. Individual colour formatting is applied within each row to show regional trends.
Table 5. Number of infectious syphilis diagnoses by quarter and region, 2019 to 2021, England*
| Region | Q1 2019 | Q2 2019 | Q3 2019 | Q4 2019 | Q1 2020 | Q2 2020 | Q3 2020 | Q4 2020 | Q1 2021 | Q2 2021 | Q3 2021 | Q4 2021 |
|---|---|---|---|---|---|---|---|---|---|---|---|---|
| East Midlands | 93 | 99 | 87 | 67 | 77 | 41 | 49 | 67 | 76 | 63 | 64 | 80 |
| East of England | 108 | 97 | 105 | 78 | 92 | 51 | 92 | 104 | 94 | 109 | 105 | 133 |
| London | 834 | 996 | 1,041 | 1,004 | 994 | 656 | 936 | 970 | 896 | 803 | 941 | 1,000 |
| North East | 64 | 69 | 71 | 73 | 84 | 43 | 55 | 51 | 51 | 66 | 73 | 63 |
| North West | 261 | 253 | 239 | 242 | 210 | 129 | 147 | 220 | 191 | 189 | 195 | 234 |
| South East | 196 | 199 | 214 | 225 | 214 | 142 | 209 | 206 | 225 | 188 | 184 | 220 |
| South West | 104 | 103 | 87 | 100 | 140 | 67 | 87 | 90 | 64 | 58 | 62 | 77 |
| West Midlands | 133 | 99 | 102 | 115 | 104 | 60 | 89 | 109 | 144 | 127 | 150 | 135 |
| Yorkshire and Humber | 89 | 82 | 89 | 80 | 86 | 54 | 51 | 59 | 66 | 67 | 90 | 100 |
*Only diagnoses where region is known are included. Individual colour formatting is applied within each row to show regional trends. For trends by upper tier local authority, see the Sexual and Reproductive Health Profiles.
Table 6. Syphilis test positivity by quarter and region, 2019 to 2021, England*
| Region | Q1 2019 | Q2 2019 | Q3 2019 | Q4 2019 | Q1 2020 | Q2 2020 | Q3 2020 | Q4 2020 | Q1 2021 | Q2 2021 | Q3 2021 | Q4 2021 |
|---|---|---|---|---|---|---|---|---|---|---|---|---|
| East Midlands | 0.39% | 0.42% | 0.36% | 0.29% | 0.37% | 0.63% | 0.41% | 0.49% | 0.52% | 0.40% | 0.39% | 0.46% |
| East of England | 0.32% | 0.30% | 0.31% | 0.25% | 0.34% | 0.43% | 0.47% | 0.51% | 0.43% | 0.50% | 0.42% | 0.49% |
| London | 0.61% | 0.72% | 0.76% | 0.74% | 0.75% | 1.00% | 0.86% | 1.01% | 0.81% | 0.68% | 0.71% | 0.76% |
| North East | 0.53% | 0.58% | 0.59% | 0.60% | 0.81% | 1.39% | 0.79% | 0.73% | 0.76% | 0.74% | 0.84% | 0.63% |
| North West | 0.70% | 0.70% | 0.63% | 0.63% | 0.60% | 1.48% | 0.69% | 1.01% | 0.68% | 0.65% | 0.63% | 0.72% |
| South East | 0.36% | 0.37% | 0.39% | 0.43% | 0.46% | 0.60% | 0.52% | 0.53% | 0.59% | 0.46% | 0.43% | 0.51% |
| South West | 0.35% | 0.36% | 0.31% | 0.37% | 0.59% | 0.53% | 0.47% | 0.52% | 0.35% | 0.34% | 0.36% | 0.45% |
| West Midlands | 0.45% | 0.37% | 0.37% | 0.42% | 0.42% | 0.82% | 0.62% | 0.69% | 0.81% | 0.67% | 0.71% | 0.64% |
| Yorkshire and Humber | 0.38% | 0.36% | 0.37% | 0.35% | 0.40% | 0.66% | 0.34% | 0.40% | 0.37% | 0.39% | 0.50% | 0.51% |
*Only test positivity where region is known are included.