Technical appendices
Updated 7 December 2022
Applies to England

© Crown copyright 2022
This publication is licensed under the terms of the Open Government Licence v3.0 except where otherwise stated. To view this licence, visit nationalarchives.gov.uk/doc/open-government-licence/version/3 or write to the Information Policy Team, The National Archives, Kew, London TW9 4DU, or email: psi@nationalarchives.gov.uk.
Where we have identified any third party copyright information you will need to obtain permission from the copyright holders concerned.
This publication is available at https://www.gov.uk/government/publications/student-level-equalities-analyses-for-gcse-a-level-and-vtqs-2022/technical-appendices
Appendix A - Variables and data sources
Gender
Source: Awarding organisations
Values: Male/Female/Unknown or neither
Reference group: Female
Prior attainment
Source: Awarding organisations
Values: Very low, low, medium, high, very high, missing
Reference group: Medium
Notes: Normalised KS2 or GCSE score originally ranging from 0 – 100, divided into quintiles.
Ethnicity
Source: DfE (NDP and/or ILR)
Values:
White: British, White Irish, any other White background (AOWB)
Asian: Indian, Pakistani, Bangladeshi, Chinese, any other Asian background (AOAB)
Black: African, Caribbean, any other Black, African or Caribbean background (AOBACB)
Mixed or Multiple: White and Black Caribbean, White and Black African, White and Asian, any other Mixed or Multiple ethnic background (AOMMB)
Any Other Ethnic Group (AOEG)
Missing
Reference group: White British
Notes: For the A level analysis, because of their very low numbers of entries, WIRT and WROM were merged with WOTH. For the GCSE analysis, WIRT, WROM and WOTH remained separate categories.
For the VTQ analysis, categorisations were harmonised between the NPD and ILR for consistency and to align with the Government Statistical Service guidance where possible (some groups had to be merged into one of the ‘other’ groups, as numbers were too small to include as a separate category – for example, ‘Gypsy or Irish Traveller’ learners had to be merged into the ‘Any Other White Background’ group)
Special Educational Needs and Disabilities (SEND)
Source: DfE (NDP and/or ILR)
Values: With SEND, without SEND, missing
Reference group: Without SEND
Free school meals (FSM) eligibility
Source: DfE (NDP and/or ILR)
Values: Eligible for FSM, not eligible for FSM, missing
Reference group: Not eligible for FSM
Income Deprivation Affecting Children Index (IDACI) score
Source: DfE (NDP and/or ILR)
Values: Very low, low, medium, high, very high, missing
Reference group: Medium
Notes: Higher scores indicate higher levels of local deprivation and lower scores indicate lower levels of local deprivation. For the purpose of our modelling, these scores were divided into quintiles
Language
Source: DfE (NDP and/or ILR)
Values: ENG (English), OTH (other than English),missing/unknown
Reference group: English
Notes: Used for GQ analysis only
Region
Source: Awarding organisations
Values: EM (East Midlands), EA (East of England), LD (London), NE (north-east), NW (north-west), SE (south-east), SW (south-west), WM (West Midlands), Y&H (Yorkshire and the Humber)
Reference group: south-east
Notes: Used for GQ analysis only
Centre Type
Source: Awarding organisations
Values: Acad (academy), Free (free school), FurE (further education establishment), Indp (independent school [including city training college]), SecComp (secondary comprehensive or middle school), SecMod (secondary modern or high school), SecSel (secondary selective school), Sixth (sixth form college), Tert (tertiary college), Other (covering college of higher education, university department, tutorial college, language school, special school, pupil referral unit, HM Young Offender Institution, HM Prison, training centre).
Reference group: Academy
Notes: Used for GQ analysis only
Appendix B - Missing data summary
Appendix B.1 - GQ
Table B1.1 Percentage of A level entries in each year with missing/unknown information on each background variable in equalities dataset
| Variable | 2018 | 2019 | 2020 | 2021 | 2022 |
|---|---|---|---|---|---|
| Centre type | 0 | 0 | 0 | 0 | 0 |
| Region | 0 | 0 | 0 | 0 | 0 |
| Gender | 0 | 0 | 0 | 0 | 0 |
| Prior attainment | 7 | 7 | 6 | 7 | 8 |
| Ethnicity | 39 | 38 | 38 | 38 | 38 |
| Major language | 38 | 38 | 38 | 38 | 37 |
| SEND | 38 | 37 | 37 | 37 | 37 |
| FSM eligibility | 38 | 37 | 37 | 37 | 37 |
| Deprivation | 38 | 37 | 38 | 37 | 37 |
Table B1.2 Percentage of GCSE entries in each year with missing/unknown information on each background variable in equalities dataset
| Variable | 2018 | 2019 | 2020 | 2021 | 2022 |
|---|---|---|---|---|---|
| Centre type | 0 | 0 | 0 | 0 | 0 |
| Region | 0 | 0 | 0 | 0 | 0 |
| Gender | 0 | 0 | 0 | 0 | 0 |
| Prior attainment | 14 | 13 | 13 | 12 | 12 |
| Ethnicity | 7 | 7 | 6 | 7 | 7 |
| Major language | 6 | 6 | 5 | 6 | 6 |
| SEND | 6 | 6 | 5 | 5 | 5 |
| FSM eligibility | 6 | 6 | 5 | 5 | 5 |
| Deprivation | 6 | 6 | 5 | 5 | 6 |
Table B1.3 Percentage of each centre type’s A level entries in each year with missing/unknown information on the prior attainment, SEND and deprivation variables in equalities dataset
| Centre Type | Variable | 2018 | 2019 | 2020 | 2021 | 2022 |
|---|---|---|---|---|---|---|
| Acad | Prior attainment | 2 | 2 | 2 | 2 | 3 |
| Free | Prior attainment | 6 | 6 | 6 | 6 | 6 |
| FurE | Prior attainment | 7 | 7 | 6 | 19 | 24 |
| Indp | Prior attainment | 29 | 30 | 28 | 27 | 25 |
| Other | Prior attainment | 9 | 14 | 12 | 20 | 21 |
| SecComp | Prior attainment | 3 | 2 | 2 | 2 | 2 |
| SecMod | Prior attainment | 1 | 2 | 1 | 1 | 2 |
| SecSel | Prior attainment | 5 | 4 | 3 | 2 | 3 |
| Sixth | Prior attainment | 5 | 5 | 5 | 8 | 9 |
| Tert | Prior attainment | 5 | 5 | 5 | 25 | 26 |
| Acad | SEND | 4 | 4 | 4 | 4 | 4 |
| Free | SEND | 1 | 2 | 1 | 1 | 1 |
| FurE | SEND | 98 | 98 | 98 | 98 | 99 |
| Indp | SEND | 98 | 98 | 98 | 98 | 98 |
| Other | SEND | 46 | 45 | 44 | 49 | 47 |
| SecComp | SEND | 0 | 0 | 0 | 1 | 1 |
| SecMod | SEND | 0 | 1 | 1 | 1 | 1 |
| SecSel | SEND | 0 | 1 | 0 | 0 | 0 |
| Sixth | SEND | 97 | 96 | 96 | 96 | 96 |
| Tert | SEND | 100 | 99 | 100 | 100 | 100 |
| Acad | Deprivation | 4 | 4 | 4 | 5 | 5 |
| Free | Deprivation | 2 | 2 | 1 | 1 | 1 |
| FurE | Deprivation | 98 | 98 | 98 | 98 | 99 |
| Indp | Deprivation | 98 | 98 | 98 | 98 | 98 |
| Other | Deprivation | 46 | 45 | 44 | 49 | 47 |
| SecComp | Deprivation | 1 | 1 | 1 | 1 | 1 |
| SecMod | Deprivation | 1 | 1 | 1 | 1 | 1 |
| SecSel | Deprivation | 0 | 1 | 1 | 1 | 1 |
| Sixth | Deprivation | 97 | 96 | 96 | 96 | 96 |
| Tert | Deprivation | 100 | 99 | 100 | 100 | 100 |
Table B1.4 Percentage of each centre type’s GCSE entries in each year with missing/unknown information on the prior attainment, SEND and deprivation variables in equalities dataset
| Centre type | Variable | 2018 | 2019 | 2020 | 2021 | 2022 |
|---|---|---|---|---|---|---|
| Acad | Prior attainment | 11 | 11 | 10 | 9 | 9 |
| Free | Prior attainment | 18 | 15 | 14 | 13 | 13 |
| FurE | Prior attainment | 18 | 20 | 20 | 23 | 24 |
| Indp | Prior attainment | 58 | 56 | 57 | 57 | 58 |
| Other | Prior attainment | 23 | 21 | 21 | 21 | 21 |
| SecComp | Prior attainment | 12 | 12 | 11 | 10 | 10 |
| SecMod | Prior attainment | 11 | 11 | 10 | 10 | 10 |
| SecSel | Prior attainment | 11 | 11 | 11 | 10 | 10 |
| Sixth | Prior attainment | 19 | 16 | 15 | 13 | 18 |
| Tert | Prior attainment | 23 | 24 | 25 | 28 | 31 |
| Acad | SEND | 1 | 1 | 1 | 1 | 1 |
| Free | SEND | 3 | 3 | 2 | 2 | 2 |
| FurE | SEND | 79 | 77 | 82 | 79 | 77 |
| Indp | SEND | 93 | 93 | 92 | 92 | 92 |
| Other | SEND | 13 | 13 | 12 | 12 | 12 |
| SecComp | SEND | 1 | 1 | 1 | 1 | 1 |
| SecMod | SEND | 1 | 1 | 1 | 1 | 1 |
| SecSel | SEND | 1 | 0 | 0 | 1 | 1 |
| Sixth | SEND | 13 | 12 | 9 | 10 | 10 |
| Tert | SEND | 32 | 40 | 33 | 45 | 37 |
| Acad | Deprivation | 1 | 1 | 1 | 1 | 1 |
| Free | Deprivation | 3 | 3 | 2 | 2 | 2 |
| FurE | Deprivation | 79 | 77 | 82 | 79 | 77 |
| Indp | Deprivation | 93 | 93 | 92 | 92 | 92 |
| Other | Deprivation | 13 | 13 | 12 | 12 | 13 |
| SecComp | Deprivation | 1 | 1 | 1 | 1 | 1 |
| SecMod | Deprivation | 1 | 1 | 1 | 1 | 1 |
| SecSel | Deprivation | 1 | 1 | 1 | 1 | 1 |
| Sixth | Deprivation | 13 | 12 | 9 | 11 | 10 |
| Tert | Deprivation | 32 | 41 | 33 | 45 | 37 |
Table B1.5 Each centre type’s share (in percentage) of each year’s A level entries with missing/unknown information on the prior attainment, SEND and deprivation variables
| Centre type | Variable | 2018 | 2019 | 2020 | 2021 | 2022 |
|---|---|---|---|---|---|---|
| Acad | Prior attainment | 14 | 14 | 13 | 11 | 15 |
| Free | Prior attainment | 1 | 1 | 1 | 1 | 1 |
| FurE | Prior attainment | 2 | 2 | 2 | 6 | 8 |
| Indp | Prior attainment | 58 | 59 | 58 | 45 | 39 |
| Other | Prior attainment | 1 | 1 | 1 | 1 | 1 |
| SecComp | Prior attainment | 6 | 6 | 6 | 4 | 4 |
| SecMod | Prior attainment | 0 | 0 | 0 | 0 | 0 |
| SecSel | Prior attainment | 3 | 3 | 2 | 1 | 2 |
| Sixth | Prior attainment | 13 | 14 | 14 | 20 | 21 |
| Tert | Prior attainment | 2 | 2 | 2 | 10 | 10 |
| Acad | SEND | 4 | 5 | 5 | 5 | 5 |
| Free | SEND | 0 | 0 | 0 | 0 | 0 |
| FurE | SEND | 5 | 6 | 6 | 7 | 7 |
| Indp | SEND | 35 | 35 | 34 | 33 | 33 |
| Other | SEND | 1 | 1 | 1 | 1 | 1 |
| SecComp | SEND | 0 | 0 | 0 | 0 | 0 |
| SecMod | SEND | 0 | 0 | 0 | 0 | 0 |
| SecSel | SEND | 0 | 0 | 0 | 0 | 0 |
| Sixth | SEND | 47 | 46 | 47 | 46 | 47 |
| Tert | SEND | 8 | 8 | 8 | 8 | 8 |
| Acad | Deprivation | 5 | 5 | 5 | 5 | 5 |
| Free | Deprivation | 0 | 0 | 0 | 0 | 0 |
| FurE | Deprivation | 5 | 6 | 6 | 6 | 7 |
| Indp | Deprivation | 35 | 35 | 34 | 33 | 32 |
| Other | Deprivation | 1 | 1 | 1 | 1 | 1 |
| SecComp | Deprivation | 0 | 0 | 0 | 0 | 0 |
| SecMod | Deprivation | 0 | 0 | 0 | 0 | 0 |
| SecSel | Deprivation | 0 | 0 | 0 | 0 | 0 |
| Sixth | Deprivation | 47 | 46 | 47 | 46 | 47 |
| Tert | Deprivation | 8 | 8 | 8 | 8 | 8 |
Table B1.6 Each centre type’s share (in percentage) of each year’s GCSE entries with missing/unknown information on the prior attainment, SEND and deprivation variables
| Centre type | Variable | 2018 | 2019 | 2020 | 2021 | 2022 |
|---|---|---|---|---|---|---|
| Acad | Prior attainment | 46 | 45 | 45 | 45 | 11 |
| Free | Prior attainment | 1 | 1 | 1 | 1 | 1 |
| FurE | Prior attainment | 0 | 0 | 0 | 0 | 1 |
| Indp | Prior attainment | 20 | 21 | 22 | 22 | 77 |
| Other | Prior attainment | 2 | 2 | 2 | 2 | 2 |
| SecComp | Prior attainment | 28 | 27 | 27 | 27 | 7 |
| SecMod | Prior attainment | 1 | 1 | 1 | 1 | 0 |
| SecSel | Prior attainment | 2 | 2 | 2 | 2 | 0 |
| Sixth | Prior attainment | 0 | 0 | 0 | 0 | 0 |
| Tert | Prior attainment | 0 | 0 | 0 | 0 | 0 |
| Acad | SEND | 11 | 10 | 7 | 8 | 10 |
| Free | SEND | 1 | 1 | 0 | 0 | 0 |
| FurE | SEND | 1 | 2 | 2 | 2 | 2 |
| Indp | SEND | 77 | 78 | 84 | 81 | 79 |
| Other | SEND | 2 | 2 | 2 | 2 | 2 |
| SecComp | SEND | 7 | 6 | 4 | 5 | 6 |
| SecMod | SEND | 0 | 0 | 0 | 0 | 0 |
| SecSel | SEND | 0 | 0 | 0 | 0 | 0 |
| Sixth | SEND | 0 | 0 | 0 | 0 | 0 |
| Tert | SEND | 0 | 0 | 0 | 0 | 0 |
| Acad | Deprivation | 13 | 12 | 8 | 10 | 11 |
| Free | Deprivation | 1 | 1 | 0 | 0 | 0 |
| FurE | Deprivation | 1 | 2 | 2 | 2 | 2 |
| Indp | Deprivation | 75 | 76 | 82 | 79 | 78 |
| Other | Deprivation | 2 | 2 | 2 | 2 | 2 |
| SecComp | Deprivation | 8 | 7 | 5 | 6 | 6 |
| SecMod | Deprivation | 0 | 0 | 0 | 0 | 0 |
| SecSel | Deprivation | 0 | 0 | 0 | 0 | 0 |
| Sixth | Deprivation | 0 | 0 | 0 | 0 | 0 |
| Tert | Deprivation | 0 | 0 | 0 | 0 | 0 |
Appendix B.2 - VTQ
Table B2.1 Percentage of Level 1/2 Technical Awards entries in each year with missing/unknown information on each background variable in the equalities dataset
| Variable | 2018 | 2019 | 2020 | 2021 | 2022 |
|---|---|---|---|---|---|
| Ethnicity | 4.8 | 3.8 | 3.4 | 3.1 | 3.8 |
| FSM | 3.0 | 2.0 | 1.6 | 1.0 | 2.2 |
| Gender | 0.1 | 0.1 | 0.0 | 0.0 | 0.1 |
| IDACI | 4.1 | 3.0 | 2.4 | 1.9 | 2.3 |
| Prior attainment | 23.1 | 21.1 | 18.9 | 19.7 | 20.8 |
| SEND | 4.2 | 3.1 | 2.3 | 1.8 | 2.2 |
Table B2.2 Percentage of Level 1/2 Technical Certificates entries in each year with missing/unknown information on each background variable in the equalities dataset
| Variable | 2018 | 2019 | 2020 | 2021 | 2022 |
|---|---|---|---|---|---|
| Ethnicity | 30.4 | 48.3 | 62.6 | 65.8 | 9.7 |
| FSM | 14.5 | 8.3 | 5.3 | 6.9 | 9.0 |
| Gender | 0.1 | 0.2 | 0.4 | 5.9 | 21.7 |
| IDACI | 30.0 | 48.3 | 62.4 | 65.4 | 9.1 |
| Prior attainment | 79.3 | 55.7 | 40.7 | 36.8 | 69.4 |
| SEND | 93.0 | 84.2 | 77.4 | 77.4 | 31.1 |
Table B2.3 Percentage of Level 3 Applied Generals entries in each year with missing/unknown information on each background variable in the equalities dataset
| Variable | 2018 | 2019 | 2020 | 2021 | 2022 |
|---|---|---|---|---|---|
| Ethnicity | 29.0 | 31.2 | 43.5 | 49.1 | 4.0 |
| FSM | 3.7 | 3.6 | 4.1 | 1.1 | 2.6 |
| Gender | 0.0 | 0.0 | 0.0 | 0.0 | 0.0 |
| IDACI | 28.3 | 30.3 | 42.5 | 48.3 | 2.8 |
| Prior attainment | 10.8 | 11.0 | 11.7 | 12.4 | 12.4 |
| SEND | 29.2 | 31.1 | 43.0 | 48.7 | 3.1 |
Table B2.4 Percentage of Level 3 Tech Level entries in each year with missing/unknown information on each background variable in the equalities dataset
| Variable | 2018 | 2019 | 2020 | 2021 | 2022 |
|---|---|---|---|---|---|
| Ethnicity | 41.2 | 43.8 | 53.6 | 57.3 | 4.8 |
| FSM | 6.1 | 5.9 | 2.3 | 3.5 | 3.7 |
| Gender | 4.3 | 0.0 | 0.8 | 0.5 | 2.6 |
| IDACI | 40.7 | 43.2 | 53.0 | 56.9 | 3.9 |
| Prior attainment | 33.4 | 27.1 | 16.3 | 19.1 | 21.1 |
| SEND | 62.4 | 59.9 | 58.4 | 63.8 | 12.5 |
Appendix C - Descriptives
Appendix C.1 - GQ
Table C1.1 2018 entries in A level equalities dataset: results and prior attainment information broken down by centre type, region, prior attainment category, ethnicity, major language, SEND status, FSM eligibility status, deprivation
| Group | N | MeanGrade | GradeSD | %GradeA | %GradeC | %PA | PAMedian | PAMean | PASD |
|---|---|---|---|---|---|---|---|---|---|
| Centre Type: Academies | 169,135 | 3.52 | 1.36 | 24.30 | 77.64 | 97.62 | 63.41 | 64.04 | 10.72 |
| Centre Type: Free schools | 2,715 | 3.49 | 1.54 | 28.76 | 75.41 | 94.04 | 66.62 | 66.38 | 10.91 |
| Centre Type: Further education establishment | 8,430 | 3.10 | 1.29 | 13.23 | 68.70 | 92.70 | 58.90 | 59.58 | 9.19 |
| Centre Type: Independent school including city training colleges (CTCs) | 55,770 | 4.20 | 1.29 | 45.02 | 89.57 | 70.52 | 69.87 | 70.30 | 11.99 |
| Centre Type: Other | 1,720 | 3.14 | 1.38 | 16.36 | 68.51 | 90.69 | 61.08 | 61.51 | 9.31 |
| Centre Type: Secondary comprehensive or middle school | 64,545 | 3.38 | 1.35 | 20.52 | 74.95 | 97.36 | 62.17 | 62.73 | 10.14 |
| Centre Type: Secondary modern school/high school | 1,815 | 3.01 | 1.38 | 13.44 | 65.86 | 98.90 | 58.45 | 58.36 | 10.13 |
| Centre Type: Secondary selective school | 19,500 | 3.85 | 1.36 | 34.35 | 83.58 | 95.16 | 68.83 | 69.45 | 9.85 |
| Centre Type: Sixth form college | 74,845 | 3.44 | 1.35 | 21.84 | 76.19 | 95.16 | 61.94 | 62.70 | 10.18 |
| Centre Type: Tertiary college | 11,920 | 3.57 | 1.27 | 23.53 | 80.63 | 95.22 | 62.41 | 63.15 | 9.43 |
| Region: East Midlands | 32,750 | 3.47 | 1.35 | 22.98 | 76.76 | 94.34 | 62.71 | 63.36 | 10.54 |
| Region: East of England | 51,025 | 3.60 | 1.37 | 26.68 | 79.10 | 93.86 | 63.49 | 64.32 | 10.94 |
| Region: London | 69,225 | 3.65 | 1.40 | 28.99 | 79.51 | 91.45 | 64.58 | 65.31 | 11.13 |
| Region: North East | 14,860 | 3.48 | 1.31 | 22.13 | 77.89 | 94.70 | 63.03 | 63.88 | 10.31 |
| Region: North West | 53,065 | 3.56 | 1.34 | 24.66 | 78.84 | 95.14 | 63.41 | 64.08 | 10.51 |
| Region: South East | 76,960 | 3.66 | 1.39 | 28.82 | 79.80 | 91.23 | 63.95 | 64.64 | 11.22 |
| Region: South West | 41,760 | 3.60 | 1.36 | 26.66 | 79.05 | 91.31 | 63.49 | 64.06 | 10.87 |
| Region: West Midlands | 36,270 | 3.46 | 1.37 | 23.11 | 76.42 | 93.89 | 63.49 | 64.25 | 10.62 |
| Region: Yorkshire and the Humber | 34,485 | 3.51 | 1.36 | 24.51 | 77.42 | 95.93 | 63.03 | 63.84 | 10.60 |
| Gender: F | 242,265 | 3.63 | 1.35 | 26.84 | 80.15 | 94.41 | 64.50 | 65.07 | 10.93 |
| Gender: M | 168,130 | 3.51 | 1.40 | 25.40 | 76.49 | 91.24 | 62.41 | 63.25 | 10.67 |
| Gender: Unknown/Neither | * | * | * | * | * | * | * | * | * |
| Prior attainment: Very low | 63,625 | 2.49 | 1.18 | 3.52 | 50.60 | 100.00 | 50.24 | 49.18 | 3.86 |
| Prior attainment: Low | 67,630 | 2.94 | 1.16 | 7.26 | 66.92 | 100.00 | 56.80 | 56.75 | 1.61 |
| Prior attainment: Medium | 88,660 | 3.36 | 1.16 | 14.42 | 78.86 | 100.00 | 62.41 | 62.36 | 2.00 |
| Prior attainment: High | 68,465 | 3.84 | 1.13 | 27.88 | 88.51 | 100.00 | 68.57 | 68.48 | 1.75 |
| Prior attainment: Very high | 93,745 | 4.67 | 1.04 | 61.10 | 96.77 | 100.00 | 77.15 | 78.97 | 5.94 |
| Prior attainment: Unknown | 28,270 | 4.00 | 1.39 | 40.42 | 85.26 | 0.00 | 0.00 | 0.00 | 0.00 |
| Ethnicity: ABAN | 4,200 | 3.29 | 1.36 | 19.21 | 72.20 | 95.29 | 63.03 | 63.52 | 9.89 |
| Ethnicity: AIND | 11,900 | 3.60 | 1.40 | 27.73 | 78.14 | 96.81 | 65.86 | 66.61 | 11.28 |
| Ethnicity: AOTH | 6,185 | 3.41 | 1.43 | 23.69 | 73.83 | 96.70 | 65.43 | 66.02 | 10.91 |
| Ethnicity: APKN | 8,915 | 3.23 | 1.39 | 19.14 | 70.37 | 95.95 | 62.41 | 62.97 | 10.56 |
| Ethnicity: BAFR | 9,660 | 3.23 | 1.33 | 16.97 | 72.15 | 94.47 | 61.29 | 61.91 | 9.98 |
| Ethnicity: BCRB | 2,360 | 3.14 | 1.27 | 12.77 | 70.40 | 97.50 | 59.50 | 60.32 | 9.44 |
| Ethnicity: BOTH | 1,440 | 3.20 | 1.29 | 15.02 | 71.28 | 95.34 | 59.50 | 60.81 | 9.67 |
| Ethnicity: CHNE | 1,830 | 3.86 | 1.40 | 35.50 | 83.42 | 94.80 | 69.53 | 69.60 | 11.27 |
| Ethnicity: MOTH | 4,860 | 3.57 | 1.40 | 26.76 | 77.75 | 96.17 | 64.58 | 65.22 | 10.86 |
| Ethnicity: MWAS | 3,780 | 3.66 | 1.37 | 28.11 | 80.72 | 96.27 | 65.86 | 65.88 | 10.98 |
| Ethnicity: MWBA | 1,390 | 3.36 | 1.40 | 21.37 | 72.52 | 96.26 | 62.41 | 62.92 | 10.55 |
| Ethnicity: MWBC | 2,455 | 3.26 | 1.33 | 17.59 | 72.39 | 97.76 | 59.50 | 61.06 | 10.13 |
| Ethnicity: OOTH | 4,530 | 3.43 | 1.42 | 23.38 | 75.43 | 95.25 | 63.71 | 64.19 | 10.80 |
| Ethnicity: WBRI | 175,485 | 3.53 | 1.35 | 24.38 | 77.96 | 98.27 | 63.49 | 64.02 | 10.57 |
| Ethnicity: WIRI | 1,385 | 3.75 | 1.33 | 29.24 | 84.19 | 97.40 | 65.43 | 65.88 | 10.92 |
| Ethnicity: WOTH ** | 11,330 | 3.53 | 1.38 | 25.16 | 77.62 | 95.22 | 63.71 | 64.18 | 10.97 |
| Ethnicity: Unknown | 158,690 | 3.71 | 1.37 | 29.90 | 81.06 | 86.06 | 63.95 | 64.79 | 11.20 |
| Major language: English | 218,275 | 3.52 | 1.36 | 24.39 | 77.75 | 97.80 | 63.49 | 64.16 | 10.64 |
| Major language: Not English | 35,880 | 3.36 | 1.40 | 21.47 | 73.35 | 95.99 | 63.03 | 63.74 | 10.80 |
| Major language: Unknown | 156,245 | 3.71 | 1.37 | 29.95 | 81.13 | 85.90 | 63.95 | 64.79 | 11.20 |
| SEND: No SEND | 245,255 | 3.50 | 1.36 | 24.07 | 77.26 | 97.53 | 63.49 | 64.20 | 10.65 |
| SEND: SEND | 9,810 | 3.36 | 1.38 | 20.88 | 73.40 | 97.57 | 61.01 | 61.24 | 10.58 |
| SEND: Unknown | 155,335 | 3.72 | 1.37 | 30.03 | 81.19 | 85.86 | 63.95 | 64.81 | 11.21 |
| FSM: Not FSM | 244,445 | 3.51 | 1.36 | 24.31 | 77.47 | 97.57 | 63.71 | 64.23 | 10.66 |
| FSM: FSM | 10,615 | 3.13 | 1.36 | 15.50 | 68.82 | 96.60 | 59.50 | 60.77 | 10.12 |
| FSM: Unknown | 155,335 | 3.72 | 1.37 | 30.03 | 81.19 | 85.86 | 63.95 | 64.81 | 11.21 |
| Deprivation: Very low | 51,920 | 3.74 | 1.33 | 30.04 | 82.38 | 97.73 | 65.43 | 66.08 | 10.78 |
| Deprivation: Low | 51,845 | 3.58 | 1.36 | 26.00 | 79.03 | 97.81 | 63.95 | 64.76 | 10.74 |
| Deprivation: Medium | 50,810 | 3.50 | 1.36 | 23.92 | 77.14 | 97.72 | 63.49 | 64.10 | 10.58 |
| Deprivation: High | 50,610 | 3.39 | 1.37 | 21.27 | 74.64 | 97.63 | 62.71 | 63.28 | 10.42 |
| Deprivation: Very high | 49,320 | 3.27 | 1.36 | 18.18 | 72.11 | 96.72 | 61.62 | 62.11 | 10.36 |
| Deprivation: Unknown | 155,890 | 3.71 | 1.37 | 30.00 | 81.15 | 85.90 | 63.95 | 64.80 | 11.21 |
Values have been rounded to the nearest 5. * indicates that results are withheld for very small groups out of concern for disclosure. ** WIRT and WROM merged with WOTH in this analysis.
Table C1.2 2019 entries in A level equalities dataset: results and prior attainment information broken down by centre type, region, prior attainment category, ethnicity, major language, SEND status, FSM eligibility status, deprivation
| Group | N | MeanGrade | GradeSD | %GradeA | %GradeC | %PA | PAMedian | PAMean | PASD |
|---|---|---|---|---|---|---|---|---|---|
| Centre Type: Academies | 178,475 | 3.46 | 1.37 | 23.06 | 76.40 | 97.78 | 62.97 | 64.02 | 10.68 |
| Centre Type: Free schools | 3,190 | 3.60 | 1.45 | 29.21 | 77.50 | 93.80 | 66.58 | 66.67 | 10.75 |
| Centre Type: Further education establishment | 9,110 | 3.00 | 1.29 | 10.93 | 66.18 | 92.81 | 58.97 | 59.55 | 8.77 |
| Centre Type: Independent school including city training colleges (CTCs) | 56,705 | 4.18 | 1.30 | 44.29 | 89.27 | 69.89 | 69.22 | 70.22 | 12.29 |
| Centre Type: Other | 1,900 | 3.24 | 1.36 | 17.93 | 71.35 | 86.28 | 61.24 | 62.01 | 9.60 |
| Centre Type: Secondary comprehensive or middle school | 67,705 | 3.31 | 1.35 | 19.05 | 73.17 | 97.59 | 61.80 | 62.58 | 10.20 |
| Centre Type: Secondary modern school/high school | 1,825 | 2.95 | 1.39 | 13.49 | 62.31 | 98.41 | 57.72 | 58.47 | 9.88 |
| Centre Type: Secondary selective school | 19,830 | 3.85 | 1.35 | 33.95 | 84.08 | 96.29 | 68.98 | 69.76 | 9.93 |
| Centre Type: Sixth form college | 76,875 | 3.44 | 1.35 | 21.80 | 76.30 | 94.83 | 62.06 | 62.89 | 10.03 |
| Centre Type: Tertiary college | 12,290 | 3.41 | 1.29 | 19.82 | 76.68 | 95.27 | 62.28 | 63.09 | 9.29 |
| Region: East Midlands | 34,030 | 3.39 | 1.35 | 20.78 | 74.98 | 95.08 | 62.71 | 63.47 | 10.48 |
| Region: East of England | 53,595 | 3.55 | 1.39 | 25.67 | 77.99 | 93.26 | 62.97 | 64.17 | 10.83 |
| Region: London | 73,070 | 3.60 | 1.41 | 27.71 | 78.40 | 91.66 | 64.04 | 65.26 | 11.24 |
| Region: North East | 15,530 | 3.49 | 1.32 | 22.46 | 77.73 | 94.22 | 62.97 | 63.91 | 10.51 |
| Region: North West | 55,090 | 3.51 | 1.35 | 23.78 | 77.78 | 95.51 | 63.33 | 64.12 | 10.55 |
| Region: South East | 79,340 | 3.62 | 1.39 | 27.78 | 79.12 | 90.66 | 63.81 | 64.50 | 11.11 |
| Region: South West | 42,975 | 3.54 | 1.39 | 25.53 | 77.56 | 92.51 | 62.97 | 64.02 | 10.91 |
| Region: West Midlands | 38,235 | 3.43 | 1.37 | 22.31 | 75.47 | 93.57 | 63.56 | 64.37 | 10.68 |
| Region: Yorkshire and the Humber | 36,040 | 3.49 | 1.35 | 23.32 | 77.08 | 96.47 | 62.97 | 64.00 | 10.43 |
| Gender: F | 251,505 | 3.60 | 1.35 | 26.03 | 79.36 | 94.37 | 64.32 | 65.10 | 10.96 |
| Gender: M | 176,350 | 3.45 | 1.41 | 23.89 | 75.21 | 91.55 | 62.28 | 63.19 | 10.58 |
| Gender: Unknown/Neither | * | * | * | * | * | * | * | * | * |
| Prior attainment: Very low | 66,520 | 2.43 | 1.18 | 3.09 | 48.79 | 100.00 | 50.17 | 49.39 | 3.60 |
| Prior attainment: Low | 78,805 | 2.90 | 1.17 | 6.57 | 65.72 | 100.00 | 57.02 | 56.92 | 1.75 |
| Prior attainment: Medium | 84,140 | 3.33 | 1.16 | 13.68 | 78.06 | 100.00 | 62.64 | 62.59 | 1.70 |
| Prior attainment: High | 79,315 | 3.84 | 1.12 | 27.53 | 88.68 | 100.00 | 68.59 | 68.66 | 1.94 |
| Prior attainment: Very high | 90,015 | 4.69 | 1.02 | 61.96 | 97.18 | 100.00 | 78.22 | 79.66 | 5.96 |
| Prior attainment: Unknown | 29,110 | 3.96 | 1.40 | 38.70 | 84.28 | 0.00 | 0.00 | 0.00 | 0.00 |
| Ethnicity: ABAN | 5,135 | 3.27 | 1.35 | 17.96 | 72.54 | 96.53 | 62.97 | 63.81 | 10.13 |
| Ethnicity: AIND | 12,795 | 3.55 | 1.41 | 26.76 | 77.42 | 97.56 | 65.87 | 66.61 | 11.50 |
| Ethnicity: AOTH | 7,360 | 3.37 | 1.42 | 22.97 | 73.42 | 96.87 | 65.11 | 65.69 | 10.86 |
| Ethnicity: APKN | 10,215 | 3.16 | 1.39 | 17.37 | 68.70 | 96.31 | 62.06 | 62.68 | 10.40 |
| Ethnicity: BAFR | 11,165 | 3.16 | 1.35 | 15.71 | 69.45 | 94.80 | 61.12 | 61.82 | 9.95 |
| Ethnicity: BCRB | 2,640 | 3.09 | 1.25 | 12.60 | 69.04 | 97.96 | 59.60 | 60.43 | 9.21 |
| Ethnicity: BOTH | 1,715 | 3.19 | 1.38 | 17.19 | 69.35 | 95.22 | 60.67 | 61.59 | 10.30 |
| Ethnicity: CHNE | 1,900 | 4.00 | 1.39 | 39.58 | 85.21 | 94.79 | 70.67 | 70.72 | 11.84 |
| Ethnicity: MOTH | 5,680 | 3.51 | 1.40 | 25.48 | 76.49 | 95.18 | 63.98 | 64.91 | 11.12 |
| Ethnicity: MWAS | 3,985 | 3.66 | 1.38 | 28.57 | 80.24 | 97.11 | 65.44 | 66.15 | 11.40 |
| Ethnicity: MWBA | 1,510 | 3.33 | 1.39 | 19.81 | 72.23 | 97.02 | 62.97 | 63.54 | 10.81 |
| Ethnicity: MWBC | 2,755 | 3.27 | 1.32 | 16.78 | 72.54 | 98.51 | 61.23 | 61.83 | 9.99 |
| Ethnicity: OOTH | 5,035 | 3.37 | 1.38 | 21.39 | 74.02 | 94.14 | 62.97 | 63.83 | 10.70 |
| Ethnicity: WBRI | 178,340 | 3.48 | 1.36 | 23.19 | 76.83 | 98.62 | 63.33 | 64.03 | 10.54 |
| Ethnicity: WIRI | 1,440 | 3.68 | 1.31 | 28.85 | 81.48 | 98.61 | 64.91 | 65.45 | 10.69 |
| Ethnicity: WOTH ** | 12,745 | 3.47 | 1.40 | 24.34 | 75.95 | 95.00 | 62.97 | 64.15 | 10.95 |
| Ethnicity: Unknown | 163,490 | 3.68 | 1.37 | 28.97 | 80.50 | 85.74 | 63.81 | 64.78 | 11.17 |
| Major language: English | 225,595 | 3.47 | 1.37 | 23.24 | 76.52 | 98.06 | 63.41 | 64.18 | 10.66 |
| Major language: Not English | 41,515 | 3.31 | 1.39 | 20.39 | 72.39 | 96.31 | 62.68 | 63.55 | 10.71 |
| Major language: Unknown | 160,800 | 3.68 | 1.37 | 29.06 | 80.60 | 85.56 | 63.81 | 64.79 | 11.17 |
| SEND: No SEND | 257,435 | 3.45 | 1.37 | 22.85 | 75.99 | 97.79 | 63.41 | 64.20 | 10.65 |
| SEND: SEND | 10,865 | 3.36 | 1.40 | 21.20 | 73.06 | 97.42 | 60.77 | 61.35 | 10.69 |
| SEND: Unknown | 159,605 | 3.68 | 1.37 | 29.13 | 80.63 | 85.50 | 63.81 | 64.79 | 11.18 |
| FSM: Not FSM | 254,785 | 3.46 | 1.37 | 23.17 | 76.26 | 97.81 | 63.41 | 64.25 | 10.67 |
| FSM: FSM | 13,520 | 3.14 | 1.35 | 15.50 | 68.65 | 97.11 | 59.83 | 61.05 | 10.03 |
| FSM: Unknown | 159,605 | 3.68 | 1.37 | 29.13 | 80.63 | 85.50 | 63.81 | 64.79 | 11.18 |
| Deprivation: Very low | 55,420 | 3.69 | 1.35 | 28.85 | 81.32 | 98.16 | 65.28 | 66.07 | 10.86 |
| Deprivation: Low | 54,250 | 3.53 | 1.36 | 24.62 | 77.94 | 98.04 | 63.66 | 64.62 | 10.59 |
| Deprivation: Medium | 53,620 | 3.45 | 1.37 | 22.67 | 76.13 | 98.07 | 63.41 | 64.15 | 10.65 |
| Deprivation: High | 52,795 | 3.33 | 1.38 | 20.16 | 73.17 | 97.72 | 62.32 | 63.15 | 10.57 |
| Deprivation: Very high | 51,690 | 3.21 | 1.37 | 17.19 | 70.42 | 96.83 | 61.58 | 62.27 | 10.21 |
| Deprivation: Unknown | 160,140 | 3.68 | 1.37 | 29.09 | 80.60 | 85.54 | 63.66 | 64.78 | 11.17 |
Values have been rounded to the nearest 5. * indicates that results are withheld for very small groups out of concern for disclosure. ** WIRT and WROM merged with WOTH in this analysis.
Table C1.3 2020 entries in A level equalities dataset: results and prior attainment information broken down by centre type, region, prior attainment category, ethnicity, major language, SEND status, FSM eligibility status, deprivation
| Group | N | MeanGrade | GradeSD | %GradeA | %GradeC | %PA | PAMedian | PAMean | PASD |
|---|---|---|---|---|---|---|---|---|---|
| Centre Type: Academies | 177,210 | 3.97 | 1.26 | 35.32 | 87.8 | 98 | 62.91 | 63.94 | 10.81 |
| Centre Type: Free schools | 3,275 | 4.04 | 1.34 | 40.71 | 86.79 | 93.93 | 66.31 | 66.86 | 10.63 |
| Centre Type: Further education establishment | 9,830 | 3.6 | 1.22 | 23.15 | 82.57 | 94.18 | 58.15 | 59.07 | 8.91 |
| Centre Type: Independent school including city training colleges (CTCs) | 55,315 | 4.66 | 1.11 | 59.6 | 96.29 | 72.35 | 69.76 | 70.74 | 12.28 |
| Centre Type: Other | 1,880 | 3.89 | 1.22 | 31.08 | 87.39 | 88.29 | 61.98 | 62.91 | 9.85 |
| Centre Type: Secondary comprehensive or middle school | 66,790 | 3.86 | 1.25 | 31.64 | 86.32 | 97.64 | 61.31 | 62.28 | 10.22 |
| Centre Type: Secondary modern school/high school | 1,865 | 3.64 | 1.31 | 25.67 | 80.92 | 98.71 | 58.61 | 59.22 | 10.61 |
| Centre Type: Secondary selective school | 19,825 | 4.27 | 1.24 | 46.02 | 91.5 | 97.34 | 68.86 | 70.01 | 10.22 |
| Centre Type: Sixth form college | 77,965 | 3.82 | 1.26 | 30.49 | 85.41 | 95.21 | 61.85 | 62.7 | 10.19 |
| Centre Type: Tertiary college | 12,475 | 3.81 | 1.21 | 28.66 | 86.48 | 95.07 | 61.93 | 62.71 | 9.51 |
| Region: East Midlands | 34,690 | 3.89 | 1.28 | 33.36 | 86.09 | 95.59 | 62.05 | 63.24 | 10.65 |
| Region: East of England | 52,945 | 4.02 | 1.28 | 37.27 | 88.13 | 93.97 | 62.91 | 64.12 | 11.04 |
| Region: London | 74,175 | 4.1 | 1.27 | 40.03 | 89.21 | 91.88 | 63.96 | 65.26 | 11.43 |
| Region: North East | 15,640 | 3.95 | 1.23 | 34.28 | 88.4 | 94.24 | 62.6 | 63.44 | 10.49 |
| Region: North West | 54,785 | 3.96 | 1.25 | 34.91 | 87.75 | 95.99 | 62.91 | 63.86 | 10.7 |
| Region: South East | 79,040 | 4.09 | 1.27 | 39.95 | 89.26 | 90.74 | 63.71 | 64.61 | 11.27 |
| Region: South West | 41,730 | 4.03 | 1.26 | 37.62 | 88.49 | 94.61 | 63.32 | 64.36 | 10.97 |
| Region: West Midlands | 37,990 | 3.93 | 1.26 | 34.26 | 87.18 | 95.39 | 63.11 | 64.12 | 10.87 |
| Region: Yorkshire and the Humber | 35,435 | 3.93 | 1.25 | 34.03 | 87.29 | 96.77 | 62.69 | 63.71 | 10.62 |
| Gender: F | 252,420 | 4.09 | 1.24 | 39.08 | 90.04 | 94.88 | 63.71 | 64.7 | 11.12 |
| Gender: M | 174,005 | 3.89 | 1.3 | 34.01 | 85.55 | 92.31 | 62.53 | 63.61 | 10.82 |
| Gender: Unknown/Neither | * | * | * | * | * | * | * | * | * |
| Prior attainment: Very low | 67,800 | 2.91 | 1.03 | 5.5 | 67.34 | 100 | 50.25 | 49.38 | 3.63 |
| Prior attainment: Low | 78,770 | 3.39 | 1.04 | 12.39 | 82.5 | 100 | 56.9 | 56.85 | 1.66 |
| Prior attainment: Medium | 81,570 | 3.82 | 1.05 | 24.84 | 90.05 | 100 | 62.28 | 62.36 | 1.6 |
| Prior attainment: High | 87,655 | 4.36 | 1.01 | 47.36 | 95.94 | 100 | 68.58 | 68.65 | 2.16 |
| Prior attainment: Very high | 84,330 | 5.19 | 0.84 | 82.27 | 99.42 | 100 | 78.62 | 80.4 | 6.45 |
| Prior attainment: Unknown | 26,310 | 4.35 | 1.26 | 50.14 | 91.61 | 0 | 0 | 0 | 0 |
| Ethnicity: ABAN | 5,375 | 3.76 | 1.25 | 28.63 | 84.8 | 96.22 | 62.55 | 63.31 | 10.19 |
| Ethnicity: AIND | 13,215 | 4.1 | 1.26 | 40.37 | 89.43 | 97.54 | 65.72 | 67.01 | 11.9 |
| Ethnicity: AOTH | 7,805 | 3.91 | 1.28 | 35.07 | 85.97 | 96.58 | 65.63 | 66.12 | 11.2 |
| Ethnicity: APKN | 11,425 | 3.68 | 1.27 | 27.34 | 82.32 | 96.96 | 62.13 | 62.74 | 10.62 |
| Ethnicity: BAFR | 11,930 | 3.7 | 1.24 | 26.77 | 83.84 | 95.12 | 61.04 | 61.93 | 10.13 |
| Ethnicity: BCRB | 2,235 | 3.66 | 1.19 | 24.11 | 84.26 | 96.74 | 59.39 | 59.9 | 9.44 |
| Ethnicity: BOTH | 1,780 | 3.69 | 1.27 | 25.97 | 83.25 | 95.39 | 60.52 | 61.2 | 10.07 |
| Ethnicity: CHNE | 1,815 | 4.49 | 1.23 | 54.8 | 93.38 | 96.14 | 70.49 | 70.84 | 11.76 |
| Ethnicity: MOTH | 5,775 | 3.97 | 1.26 | 35.89 | 87.77 | 95.34 | 63.96 | 64.83 | 10.98 |
| Ethnicity: MWAS | 4,345 | 4.14 | 1.28 | 41.87 | 89.16 | 97.24 | 65.22 | 66.64 | 11.43 |
| Ethnicity: MWBA | 1,600 | 3.85 | 1.26 | 31.31 | 85.88 | 96.81 | 61.93 | 62.78 | 10.32 |
| Ethnicity: MWBC | 2,680 | 3.77 | 1.25 | 29.28 | 85.03 | 98.36 | 60.9 | 61.65 | 10.28 |
| Ethnicity: OOTH | 5,050 | 3.93 | 1.26 | 34.03 | 86.95 | 95.35 | 62.8 | 63.59 | 10.55 |
| Ethnicity: WBRI | 172,835 | 3.99 | 1.26 | 35.91 | 88.2 | 98.8 | 62.91 | 63.89 | 10.67 |
| Ethnicity: WIRI | 1,410 | 4.17 | 1.21 | 39.46 | 92.26 | 97.94 | 63.96 | 65.29 | 10.72 |
| Ethnicity: WOTH ** | 13,295 | 4.04 | 1.27 | 38.13 | 88.72 | 96.02 | 63.11 | 64.17 | 11.09 |
| Ethnicity: Unknown | 163,865 | 4.09 | 1.27 | 39.86 | 89.13 | 87.18 | 63.54 | 64.7 | 11.34 |
| Major language: English | 221,940 | 3.98 | 1.26 | 35.68 | 87.91 | 98.23 | 63.07 | 64.05 | 10.79 |
| Major language: Not English | 43,255 | 3.87 | 1.27 | 32.75 | 85.97 | 96.64 | 62.91 | 63.77 | 10.96 |
| Major language: Unknown | 161,240 | 4.09 | 1.27 | 39.98 | 89.2 | 87.03 | 63.54 | 64.73 | 11.35 |
| SEND: No SEND | 254,755 | 3.97 | 1.26 | 35.47 | 87.74 | 97.94 | 63.11 | 64.12 | 10.81 |
| SEND: SEND | 11,905 | 3.77 | 1.28 | 29.23 | 84.32 | 98 | 60.52 | 61.34 | 10.71 |
| SEND: Unknown | 159,770 | 4.1 | 1.27 | 40.05 | 89.23 | 86.97 | 63.59 | 64.74 | 11.35 |
| FSM: Not FSM | 251,265 | 3.98 | 1.26 | 35.8 | 87.9 | 97.98 | 63.27 | 64.22 | 10.83 |
| FSM: FSM | 15,395 | 3.64 | 1.25 | 25.27 | 82.51 | 97.4 | 59.65 | 60.35 | 9.87 |
| FSM: Unknown | 159,770 | 4.1 | 1.27 | 40.05 | 89.23 | 86.97 | 63.59 | 64.74 | 11.35 |
| Deprivation: Very low | 53,595 | 4.14 | 1.25 | 41.14 | 90.33 | 98.43 | 64.85 | 65.86 | 11.05 |
| Deprivation: Low | 54,890 | 4.04 | 1.26 | 37.88 | 88.88 | 98.3 | 63.71 | 64.8 | 10.91 |
| Deprivation: Medium | 53,790 | 3.96 | 1.26 | 34.96 | 87.65 | 98.22 | 62.91 | 63.96 | 10.73 |
| Deprivation: High | 52,385 | 3.9 | 1.27 | 33.18 | 86.56 | 97.71 | 62.28 | 63.33 | 10.72 |
| Deprivation: Very high | 51,560 | 3.75 | 1.26 | 28.51 | 84.36 | 97.04 | 61.15 | 61.92 | 10.24 |
| Deprivation: Unknown | 160,215 | 4.1 | 1.27 | 40.01 | 89.22 | 86.99 | 63.59 | 64.74 | 11.35 |
Values have been rounded to the nearest 5. * indicates that results are withheld for very small groups out of concern for disclosure. ** WIRT and WROM merged with WOTH in this analysis.
Table C1.4 2021 entries in A level equalities dataset: results and prior attainment information broken down by centre type, region, prior attainment category, ethnicity, major language, SEND status, FSM eligibility status, deprivation
| Group | N | MeanGrade | GradeSD | %GradeA | %GradeC | %PA | PAMedian | PAMean | PASD |
|---|---|---|---|---|---|---|---|---|---|
| Centre Type: Academies | 188,980 | 4.1 | 1.32 | 41.2 | 88.42 | 97.94 | 62.61 | 63.64 | 10.81 |
| Centre Type: Free schools | 3,650 | 4.15 | 1.38 | 44.7 | 87.32 | 93.86 | 66.22 | 66.69 | 10.61 |
| Centre Type: Further education establishment | 11,190 | 3.69 | 1.31 | 28.3 | 82.68 | 80.87 | 57.67 | 58.65 | 9.06 |
| Centre Type: Independent school including city training colleges (CTCs) | 57,360 | 4.92 | 1.11 | 69.3 | 96.87 | 73.46 | 68.65 | 70.26 | 12.21 |
| Centre Type: Other | 2,125 | 4.03 | 1.32 | 37.61 | 88.39 | 80.49 | 62.57 | 63.1 | 9.87 |
| Centre Type: Secondary comprehensive or middle school | 72,005 | 4 | 1.32 | 37.54 | 87.02 | 98.25 | 60.86 | 61.98 | 10.24 |
| Centre Type: Secondary modern school/high school | 2,025 | 3.78 | 1.36 | 30.55 | 83.39 | 98.76 | 57.39 | 58.47 | 9.89 |
| Centre Type: Secondary selective school | 20,285 | 4.46 | 1.27 | 54.15 | 92.36 | 97.7 | 68.65 | 69.91 | 9.95 |
| Centre Type: Sixth form college | 81,350 | 3.9 | 1.3 | 34.34 | 85.94 | 91.58 | 61.79 | 62.61 | 10.05 |
| Centre Type: Tertiary college | 13,830 | 3.9 | 1.29 | 33.33 | 86.46 | 75.31 | 60.86 | 62.01 | 9.47 |
| Region: East Midlands | 36,235 | 4.05 | 1.34 | 40.06 | 87.33 | 94.61 | 62.23 | 63.18 | 10.45 |
| Region: East of England | 55,380 | 4.17 | 1.32 | 43.5 | 89.13 | 93.56 | 62.61 | 63.67 | 10.93 |
| Region: London | 80,150 | 4.26 | 1.34 | 46.66 | 89.62 | 91.35 | 64.05 | 65.16 | 11.39 |
| Region: North East | 16,230 | 4.03 | 1.29 | 37.75 | 88.19 | 92.91 | 61.96 | 62.98 | 10.48 |
| Region: North West | 57,410 | 4.08 | 1.31 | 40.23 | 88.24 | 92.31 | 62.81 | 63.61 | 10.65 |
| Region: South East | 83,785 | 4.22 | 1.33 | 45.44 | 89.6 | 90.36 | 63.29 | 64.16 | 11.27 |
| Region: South West | 45,185 | 4.16 | 1.34 | 43.54 | 88.49 | 93.53 | 62.81 | 63.93 | 10.98 |
| Region: West Midlands | 41,240 | 4.06 | 1.31 | 39.75 | 87.91 | 94.87 | 63.1 | 63.92 | 10.84 |
| Region: Yorkshire and the Humber | 37,185 | 4.08 | 1.31 | 40.38 | 88.22 | 92.52 | 62.61 | 63.6 | 10.6 |
| Gender: F | 265,870 | 4.25 | 1.28 | 45.59 | 90.84 | 93.07 | 63.62 | 64.46 | 11.08 |
| Gender: M | 186,925 | 4.01 | 1.38 | 39.13 | 85.8 | 91.72 | 62.23 | 63.32 | 10.79 |
| Gender: Unknown/Neither | * | * | * | * | * | * | * | * | * |
| Prior attainment: Very low | 67,815 | 2.99 | 1.16 | 8.51 | 68.75 | 100 | 49.79 | 48.88 | 3.65 |
| Prior attainment: Low | 83,910 | 3.52 | 1.15 | 18.15 | 83.02 | 100 | 56.56 | 56.44 | 1.74 |
| Prior attainment: Medium | 84,690 | 3.97 | 1.13 | 32.64 | 90.42 | 100 | 61.96 | 61.97 | 1.59 |
| Prior attainment: High | 91,575 | 4.52 | 1.06 | 55.42 | 96.02 | 100 | 68.02 | 68.23 | 2.14 |
| Prior attainment: Very high | 90,900 | 5.3 | 0.84 | 84.91 | 99.3 | 100 | 77.92 | 79.84 | 6.23 |
| Prior attainment: Unknown | 33,910 | 4.41 | 1.33 | 52.49 | 91.03 | 0 | 0 | 0 | 0 |
| Ethnicity: ABAN | 6,035 | 3.94 | 1.35 | 36.13 | 85.55 | 97.23 | 62.81 | 63.66 | 10.65 |
| Ethnicity: AIND | 14,555 | 4.32 | 1.31 | 48.91 | 90.72 | 97.74 | 66.6 | 67.31 | 11.78 |
| Ethnicity: AOTH | 8,570 | 4.12 | 1.36 | 43.13 | 87.08 | 97.55 | 64.89 | 65.7 | 11.23 |
| Ethnicity: APKN | 11,925 | 3.83 | 1.36 | 33.95 | 83.32 | 97.84 | 62.23 | 62.92 | 10.42 |
| Ethnicity: BAFR | 12,925 | 3.81 | 1.31 | 31.66 | 84.42 | 95.34 | 60.86 | 61.74 | 9.93 |
| Ethnicity: BCRB | 2,440 | 3.75 | 1.27 | 28.44 | 84.84 | 96.31 | 58.86 | 59.73 | 9.54 |
| Ethnicity: BOTH | 2,020 | 3.87 | 1.34 | 34.22 | 84.42 | 93.57 | 60.28 | 61.16 | 9.96 |
| Ethnicity: CHNE | 1,990 | 4.56 | 1.26 | 57.01 | 93.06 | 96.83 | 69.7 | 70.58 | 11.77 |
| Ethnicity: MOTH | 6,575 | 4.11 | 1.33 | 41.35 | 88.26 | 95.83 | 63.43 | 64.47 | 11.13 |
| Ethnicity: MWAS | 4,840 | 4.3 | 1.32 | 48.45 | 90.21 | 96.61 | 65.36 | 66.43 | 11.47 |
| Ethnicity: MWBA | 1,900 | 3.97 | 1.3 | 36.4 | 86.27 | 96.63 | 60.86 | 62.72 | 10.47 |
| Ethnicity: MWBC | 2,810 | 3.89 | 1.3 | 33.14 | 86.22 | 98.01 | 60.86 | 61.37 | 9.96 |
| Ethnicity: OOTH | 5,920 | 4.02 | 1.36 | 39.09 | 86.66 | 96.4 | 61.96 | 63.12 | 10.77 |
| Ethnicity: WBRI | 180,385 | 4.13 | 1.31 | 41.83 | 88.87 | 98.64 | 62.61 | 63.45 | 10.66 |
| Ethnicity: WIRI | 1,480 | 4.32 | 1.22 | 47.06 | 92.57 | 97.5 | 64.23 | 65.16 | 10.56 |
| Ethnicity: WOTH ** | 14,780 | 4.15 | 1.33 | 43.27 | 88.83 | 96.3 | 62.81 | 63.76 | 10.88 |
| Ethnicity: Unknown | 173,645 | 4.23 | 1.33 | 45.59 | 89.51 | 83.73 | 63.43 | 64.55 | 11.26 |
| Major language: English | 235,985 | 4.12 | 1.32 | 41.66 | 88.64 | 98.09 | 62.81 | 63.7 | 10.76 |
| Major language: Not English | 46,645 | 4.02 | 1.35 | 39.35 | 86.5 | 97.23 | 62.61 | 63.64 | 10.99 |
| Major language: Unknown | 170,165 | 4.23 | 1.33 | 45.67 | 89.56 | 83.48 | 63.43 | 64.58 | 11.27 |
| SEND: No SEND | 270,735 | 4.11 | 1.32 | 41.53 | 88.48 | 97.92 | 62.81 | 63.82 | 10.78 |
| SEND: SEND | 13,265 | 3.88 | 1.38 | 35.39 | 84.1 | 97.98 | 60.08 | 60.9 | 10.75 |
| SEND: Unknown | 168,795 | 4.24 | 1.33 | 45.76 | 89.58 | 83.41 | 63.43 | 64.59 | 11.28 |
| FSM: Not FSM | 264,135 | 4.13 | 1.32 | 42.08 | 88.74 | 97.93 | 63.1 | 63.95 | 10.82 |
| FSM: FSM | 19,870 | 3.73 | 1.36 | 30.22 | 82.17 | 97.84 | 59.41 | 60.2 | 9.94 |
| FSM: Unknown | 168,795 | 4.24 | 1.33 | 45.76 | 89.58 | 83.41 | 63.43 | 64.59 | 11.28 |
| Deprivation: Very low | 57,235 | 4.31 | 1.28 | 48.08 | 91.15 | 98.11 | 64.53 | 65.56 | 10.98 |
| Deprivation: Low | 59,335 | 4.19 | 1.3 | 44.12 | 89.92 | 98.24 | 63.43 | 64.32 | 10.83 |
| Deprivation: Medium | 56,880 | 4.12 | 1.31 | 41.62 | 88.73 | 98.05 | 62.81 | 63.78 | 10.76 |
| Deprivation: High | 55,570 | 4.01 | 1.34 | 38.4 | 86.61 | 97.87 | 61.96 | 62.88 | 10.71 |
| Deprivation: Very high | 54,505 | 3.86 | 1.34 | 33.46 | 84.7 | 97.32 | 60.86 | 61.72 | 10.29 |
| Deprivation: Unknown | 169,275 | 4.24 | 1.33 | 45.75 | 89.58 | 83.44 | 63.43 | 64.59 | 11.28 |
Values have been rounded to the nearest 5. * indicates that results are withheld for very small groups out of concern for disclosure. ** WIRT and WROM merged with WOTH in this analysis.
Table C1.5 2022 entries in A level equalities dataset: results and prior attainment information broken down by centre type, region, prior attainment category, ethnicity, major language, SEND status, FSM eligibility status, deprivation
| Group | N | MeanGrade | GradeSD | %GradeA | %GradeC | %PA | PAMedian | PAMean | PASD |
|---|---|---|---|---|---|---|---|---|---|
| Centre Type: Academies | 199,115 | 3.84 | 1.4 | 33.52 | 82.95 | 97.28 | 61.84 | 62.76 | 10.96 |
| Centre Type: Free schools | 3,795 | 4 | 1.43 | 41.06 | 84.57 | 93.94 | 67.07 | 67.26 | 10.78 |
| Centre Type: Further education establishment | 12,060 | 3.17 | 1.38 | 16.14 | 69.64 | 75.96 | 57.18 | 58.59 | 9.76 |
| Centre Type: Independent school including city training colleges (CTCs) | 58,045 | 4.54 | 1.27 | 56.37 | 92.75 | 74.95 | 69.65 | 70.34 | 11.61 |
| Centre Type: Other | 2,250 | 3.58 | 1.4 | 25.67 | 78.51 | 79.18 | 61.31 | 62.39 | 9.99 |
| Centre Type: Secondary comprehensive or middle school | 74,540 | 3.69 | 1.38 | 28.75 | 80.71 | 98.04 | 60.49 | 61.17 | 10.45 |
| Centre Type: Secondary modern school/high school | 2,165 | 3.51 | 1.39 | 24.05 | 77.42 | 98.38 | 57.18 | 58.54 | 10.47 |
| Centre Type: Secondary selective school | 21,425 | 4.27 | 1.33 | 47.29 | 89.67 | 96.89 | 67.98 | 68.59 | 9.77 |
| Centre Type: Sixth form college | 85,300 | 3.76 | 1.4 | 31.05 | 81.78 | 90.97 | 61.36 | 62.11 | 10.65 |
| Centre Type: Tertiary college | 13,585 | 3.65 | 1.37 | 27.23 | 80.67 | 74.12 | 60.7 | 61.37 | 9.73 |
| Region: East Midlands | 36,955 | 3.73 | 1.41 | 30.5 | 80.75 | 93.75 | 61 | 62.17 | 10.71 |
| Region: East of England | 58,495 | 3.89 | 1.41 | 35.38 | 83.6 | 93.27 | 61.84 | 62.99 | 11.18 |
| Region: London | 84,660 | 3.98 | 1.43 | 38.85 | 84.33 | 91.19 | 63.43 | 64.33 | 11.38 |
| Region: North East | 17,215 | 3.75 | 1.36 | 30.23 | 82.41 | 93.43 | 61.84 | 62.62 | 10.9 |
| Region: North West | 61,010 | 3.86 | 1.38 | 33.88 | 83.7 | 91.58 | 62.25 | 62.97 | 10.86 |
| Region: South East | 86,770 | 3.96 | 1.41 | 37.81 | 84.71 | 89.79 | 62.71 | 63.49 | 11.48 |
| Region: South West | 46,120 | 3.89 | 1.4 | 35.41 | 83.81 | 93.86 | 62.71 | 63.28 | 11.15 |
| Region: West Midlands | 42,500 | 3.79 | 1.4 | 32.2 | 81.95 | 93.43 | 62.71 | 63.49 | 10.99 |
| Region: Yorkshire and the Humber | 38,555 | 3.79 | 1.39 | 31.79 | 82.4 | 93.58 | 62.26 | 62.94 | 10.85 |
| Gender: F | 275,620 | 3.95 | 1.38 | 36.79 | 85.03 | 92.6 | 63.29 | 63.94 | 11.22 |
| Gender: M | 196,650 | 3.78 | 1.43 | 32.76 | 81.26 | 91.6 | 61.36 | 62.41 | 11 |
| Gender: Unknown/Neither | * | * | * | * | * | * | * | * | * |
| Prior attainment: Very low | 71,740 | 2.74 | 1.24 | 6.19 | 59.4 | 100 | 48.6 | 47.71 | 3.88 |
| Prior attainment: Low | 87,130 | 3.28 | 1.23 | 13.77 | 75.72 | 100 | 55.73 | 55.68 | 1.74 |
| Prior attainment: Medium | 87,925 | 3.72 | 1.21 | 25.14 | 84.7 | 100 | 61.36 | 61.51 | 1.63 |
| Prior attainment: High | 96,055 | 4.25 | 1.15 | 43.9 | 92.63 | 100 | 67.98 | 67.93 | 2.26 |
| Prior attainment: Very high | 92,500 | 5.06 | 0.96 | 75.82 | 98.45 | 100 | 78.39 | 79.49 | 5.68 |
| Prior attainment: Unknown | 36,925 | 4.01 | 1.46 | 40.55 | 84.06 | 0 | 0 | 0 | 0 |
| Ethnicity: ABAN | 6,590 | 3.66 | 1.43 | 29.86 | 79.65 | 97.42 | 62.26 | 63.07 | 10.86 |
| Ethnicity: AIND | 15,700 | 4.08 | 1.4 | 42.04 | 85.49 | 97.45 | 66.2 | 66.45 | 11.47 |
| Ethnicity: AOTH | 9,335 | 3.77 | 1.45 | 33.93 | 80.2 | 97.57 | 63.96 | 64.39 | 11.09 |
| Ethnicity: APKN | 12,190 | 3.54 | 1.45 | 26.79 | 76.49 | 97.94 | 61 | 61.67 | 10.9 |
| Ethnicity: BAFR | 15,000 | 3.55 | 1.39 | 25.44 | 77.75 | 95.15 | 59.89 | 60.58 | 10.23 |
| Ethnicity: BCRB | 2,620 | 3.45 | 1.37 | 21.78 | 76.43 | 95.16 | 57.18 | 58.88 | 9.75 |
| Ethnicity: BOTH | 2,105 | 3.44 | 1.42 | 22.39 | 75.33 | 94.44 | 58.29 | 59.49 | 10.08 |
| Ethnicity: CHNE | 2,000 | 4.37 | 1.35 | 50.85 | 90.44 | 95.65 | 68.89 | 69.23 | 11.63 |
| Ethnicity: MOTH | 7,095 | 3.85 | 1.4 | 34.32 | 82.8 | 95.36 | 62.71 | 63.55 | 11.27 |
| Ethnicity: MWAS | 5,315 | 4.04 | 1.39 | 40.23 | 86.4 | 96.41 | 63.96 | 64.92 | 11.33 |
| Ethnicity: MWBA | 2,155 | 3.78 | 1.4 | 32.13 | 81.89 | 96.38 | 61 | 61.92 | 10.28 |
| Ethnicity: MWBC | 3,050 | 3.63 | 1.41 | 26.4 | 79.3 | 96.95 | 59.75 | 60.44 | 10.47 |
| Ethnicity: OOTH | 6,660 | 3.73 | 1.41 | 31.15 | 80.67 | 96.11 | 61.36 | 62.32 | 10.79 |
| Ethnicity: WBRI | 184,495 | 3.85 | 1.38 | 33.35 | 83.58 | 98.48 | 61.84 | 62.66 | 10.77 |
| Ethnicity: WIRI | 1,455 | 4.17 | 1.33 | 43.48 | 88.87 | 97.18 | 65.16 | 64.92 | 11.31 |
| Ethnicity: WOTH ** | 16,720 | 3.84 | 1.42 | 34.29 | 82.66 | 96.46 | 62.16 | 63.02 | 11.14 |
| Ethnicity: Unknown | 179,795 | 3.98 | 1.42 | 38.33 | 84.69 | 83.07 | 63.43 | 64.22 | 11.53 |
| Major language: English | 247,270 | 3.84 | 1.39 | 33.44 | 83.2 | 97.85 | 61.84 | 62.86 | 10.88 |
| Major language: Not English | 49,220 | 3.72 | 1.44 | 31.56 | 80.06 | 97.31 | 61.84 | 62.62 | 11.09 |
| Major language: Unknown | 175,785 | 3.98 | 1.42 | 38.46 | 84.76 | 82.78 | 63.43 | 64.27 | 11.54 |
| SEND: No SEND | 282,735 | 3.83 | 1.39 | 33.29 | 82.83 | 97.72 | 62.26 | 62.97 | 10.89 |
| SEND: SEND | 15,340 | 3.68 | 1.44 | 29.62 | 79.45 | 97.58 | 59.19 | 59.96 | 10.95 |
| SEND: Unknown | 174,200 | 3.98 | 1.42 | 38.55 | 84.83 | 82.72 | 63.43 | 64.3 | 11.55 |
| FSM: Not FSM | 274,670 | 3.86 | 1.39 | 34.01 | 83.32 | 97.72 | 62.26 | 63.12 | 10.9 |
| FSM: FSM | 23,405 | 3.41 | 1.41 | 22.4 | 74.81 | 97.65 | 58.29 | 59.28 | 10.46 |
| FSM: Unknown | 174,200 | 3.98 | 1.42 | 38.55 | 84.83 | 82.72 | 63.43 | 64.3 | 11.55 |
| Deprivation: Very low | 61,295 | 4.08 | 1.34 | 40.29 | 87.55 | 97.9 | 63.66 | 64.4 | 10.95 |
| Deprivation: Low | 61,245 | 3.94 | 1.37 | 36.19 | 84.99 | 97.91 | 62.65 | 63.41 | 10.94 |
| Deprivation: Medium | 59,215 | 3.83 | 1.38 | 32.88 | 83.1 | 97.96 | 61.84 | 62.75 | 10.81 |
| Deprivation: High | 58,240 | 3.71 | 1.41 | 30.06 | 80.58 | 97.9 | 61.36 | 62.21 | 10.86 |
| Deprivation: Very high | 57,640 | 3.53 | 1.42 | 25.51 | 76.62 | 96.85 | 60.46 | 61.17 | 10.75 |
| Deprivation: Unknown | 174,645 | 3.98 | 1.42 | 38.52 | 84.82 | 82.76 | 63.43 | 64.29 | 11.54 |
Values have been rounded to the nearest 5. * indicates that results are withheld for very small groups out of concern for disclosure. ** WIRT and WROM merged with WOTH in this analysis.
Table C1.6 2018 entries in GCSE equalities dataset: results and prior attainment information broken down by centre type, region, prior attainment category, ethnicity, major language, SEND status, FSM eligibility status, deprivation
| Group | N | MeanGrade | GradeSD | %GradeA | %GradeC | %PA | PAMedian | PAMean | PASD |
|---|---|---|---|---|---|---|---|---|---|
| Centre Type: Academies | 1,972,305 | 4.8 | 2.06 | 21.48 | 71.74 | 88.87 | 51.72 | 51.62 | 16.39 |
| Centre Type: Free schools | 35,625 | 4.77 | 2.07 | 20.95 | 71.61 | 82.23 | 50.33 | 49.89 | 15.65 |
| Centre Type: Further education establishment | 3,630 | 3.22 | 1.78 | 4.24 | 41.03 | 81.54 | 44.73 | 44.69 | 13.65 |
| Centre Type: Independent school including city training colleges (CTCs) | 159,270 | 6.38 | 1.9 | 49.97 | 92.48 | 42.41 | 59.57 | 59.11 | 15.56 |
| Centre Type: Other | 33,885 | 3.35 | 2.09 | 8.83 | 41.28 | 76.81 | 45.21 | 44.88 | 16.2 |
| Centre Type: Secondary comprehensive or middle school | 1,109,835 | 4.66 | 2.01 | 18.88 | 69.95 | 87.74 | 50.75 | 50.57 | 15.81 |
| Centre Type: Secondary modern school/high school | 51,995 | 4.21 | 1.89 | 12.06 | 62.9 | 89.05 | 47.48 | 47.01 | 15.05 |
| Centre Type: Secondary selective school | 80,760 | 6.74 | 1.62 | 56.96 | 97.21 | 88.82 | 68.94 | 69.2 | 11.44 |
| Centre Type: Sixth form college | 1,750 | 4.2 | 1.94 | 12.36 | 62.59 | 80.89 | 50.84 | 50.51 | 14.76 |
| Centre Type: Tertiary college | 1,375 | 3.97 | 1.88 | 10.04 | 57.71 | 76.64 | 48.12 | 47.61 | 14.1 |
| Region: East Midlands | 295,880 | 4.7 | 2.03 | 19.62 | 70.41 | 87.53 | 51.38 | 51.19 | 16.21 |
| Region: East of England | 401,995 | 4.88 | 2.07 | 22.69 | 72.88 | 87.31 | 51.8 | 51.48 | 16.56 |
| Region: London | 533,730 | 5.12 | 2.14 | 27.54 | 75.43 | 80.4 | 52.64 | 52.64 | 16.38 |
| Region: North East | 143,845 | 4.68 | 2 | 18.87 | 70.64 | 90.55 | 52.18 | 52.19 | 15.91 |
| Region: North West | 466,025 | 4.72 | 2.06 | 20.4 | 70.51 | 87.65 | 51.93 | 51.96 | 15.92 |
| Region: South East | 583,030 | 5.02 | 2.1 | 25.59 | 74.7 | 85.67 | 52.94 | 52.53 | 16.45 |
| Region: South West | 334,645 | 4.87 | 2.05 | 22.3 | 73 | 86.85 | 52.18 | 51.99 | 16.2 |
| Region: West Midlands | 360,745 | 4.67 | 2.06 | 19.76 | 69.19 | 86.8 | 50.71 | 50.81 | 16.58 |
| Region: Yorkshire and the Humber | 330,530 | 4.63 | 2.05 | 18.91 | 69.32 | 88.31 | 50.08 | 49.86 | 16.45 |
| Gender: F | 1,743,310 | 5.09 | 2.04 | 25.57 | 76.52 | 86.62 | 51.84 | 51.76 | 16.32 |
| Gender: M | 1,707,020 | 4.61 | 2.09 | 19.34 | 67.87 | 85.7 | 51.93 | 51.67 | 16.38 |
| Gender: Unknown/Neither | * | * | * | * | * | * | * | * | * |
| Prior attainment: Very low | 531,350 | 2.99 | 1.45 | 1.43 | 32.68 | 100 | 29.55 | 27.62 | 7.5 |
| Prior attainment: Low | 564,320 | 3.95 | 1.53 | 5.01 | 60.49 | 100 | 41.83 | 41.73 | 2.78 |
| Prior attainment: Medium | 595,475 | 4.69 | 1.6 | 12.45 | 77.92 | 100 | 50.59 | 50.54 | 2.42 |
| Prior attainment: High | 624,175 | 5.53 | 1.64 | 27.43 | 89.72 | 100 | 59.27 | 59.35 | 2.77 |
| Prior attainment: Very high | 657,630 | 6.72 | 1.63 | 57.21 | 96.82 | 100 | 71.85 | 73.57 | 7.41 |
| Prior attainment: Unknown | 477,470 | 4.72 | 2.35 | 24.83 | 66.36 | 0 | 0 | 0 | 0 |
| Ethnicity: ABAN | 55,460 | 4.98 | 2.04 | 24.27 | 74.98 | 77.62 | 49.08 | 49.16 | 16.08 |
| Ethnicity: AIND | 98,705 | 5.69 | 2.08 | 37.02 | 83.76 | 83.84 | 55.05 | 55.04 | 16.49 |
| Ethnicity: AOTH | 59,970 | 5.48 | 2.11 | 33.74 | 81.02 | 78.77 | 54.53 | 54.13 | 16.43 |
| Ethnicity: APKN | 136,700 | 4.65 | 2.04 | 19.27 | 68.88 | 84.33 | 47.06 | 47.3 | 16.2 |
| Ethnicity: BAFR | 117,260 | 4.83 | 2 | 21.33 | 72.8 | 74.05 | 49.83 | 49.85 | 15.64 |
| Ethnicity: BCRB | 42,260 | 4.07 | 1.9 | 10.97 | 58.36 | 88.38 | 45.78 | 45.82 | 15.1 |
| Ethnicity: BOTH | 22,710 | 4.42 | 1.99 | 15.94 | 64.92 | 73.22 | 46.63 | 46.54 | 15.45 |
| Ethnicity: CHNE | 12,620 | 6.38 | 1.96 | 50.9 | 91.15 | 78.83 | 62.15 | 61.34 | 16.29 |
| Ethnicity: MOTH | 58,745 | 5.04 | 2.11 | 25.9 | 74.88 | 83 | 53.41 | 53.03 | 16.39 |
| Ethnicity: MWAS | 36,920 | 5.35 | 2.14 | 31.83 | 78.75 | 87.92 | 56.33 | 55.54 | 16.84 |
| Ethnicity: MWBA | 18,890 | 4.72 | 2.06 | 20.46 | 70.89 | 82.49 | 51.46 | 51.1 | 16.36 |
| Ethnicity: MWBC | 42,930 | 4.27 | 1.99 | 14.2 | 62.75 | 91.91 | 48.83 | 48.96 | 15.81 |
| Ethnicity: OOTH | 52,175 | 4.87 | 2.14 | 23.7 | 71.92 | 69.99 | 49.67 | 49.61 | 16.12 |
| Ethnicity: WBRI | 2,288,915 | 4.74 | 2.03 | 20.12 | 71.17 | 93.43 | 52.05 | 51.9 | 16.21 |
| Ethnicity: WIRI | 11,100 | 5.35 | 2.07 | 30.53 | 80.12 | 86.1 | 57.33 | 57.14 | 15.7 |
| Ethnicity: WIRT | 480 | 2.92 | 1.69 | 2.09 | 33.19 | 77.66 | 40.14 | 39.38 | 15.17 |
| Ethnicity: WOTH | 160,390 | 4.76 | 2.16 | 22.32 | 69.95 | 66.2 | 49.83 | 49.97 | 17.19 |
| Ethnicity: WROM | 4,945 | 2.24 | 1.77 | 2.12 | 22.13 | 50.6 | 35.61 | 34.86 | 15.61 |
| Ethnicity: Unknown | 229,250 | 5.7 | 2.24 | 39.57 | 81.66 | 45.39 | 56.07 | 55.43 | 16.79 |
| Major language: English | 2,726,510 | 4.78 | 2.04 | 20.96 | 71.62 | 92.25 | 52.1 | 51.95 | 16.26 |
| Major language: Not English | 526,760 | 4.82 | 2.13 | 22.87 | 71.15 | 72.21 | 49.08 | 49.08 | 16.51 |
| Major language: Unknown | 197,150 | 5.87 | 2.21 | 42.68 | 83.82 | 39.2 | 57.61 | 56.91 | 16.61 |
| SEND: No SEND | 2,897,655 | 4.97 | 2 | 23.05 | 75.46 | 89.83 | 52.94 | 53.08 | 15.54 |
| SEND: SEND | 360,330 | 3.31 | 1.93 | 6.94 | 40 | 82.23 | 37.46 | 38.37 | 17.02 |
| SEND: Unknown | 192,435 | 5.9 | 2.2 | 43.19 | 84.19 | 38.33 | 58.03 | 57.22 | 16.58 |
| FSM: Not FSM | 2,901,685 | 4.92 | 2.03 | 22.76 | 74.02 | 89.46 | 52.6 | 52.46 | 16.17 |
| FSM: FSM | 356,300 | 3.75 | 1.95 | 9.12 | 51.3 | 85.12 | 44.07 | 44 | 15.63 |
| FSM: Unknown | 192,435 | 5.9 | 2.2 | 43.19 | 84.19 | 38.33 | 58.03 | 57.22 | 16.58 |
| Deprivation: Very low | 695,370 | 5.45 | 1.98 | 30.87 | 82.86 | 92.09 | 56.38 | 55.99 | 15.87 |
| Deprivation: Low | 675,365 | 5.07 | 2 | 24.55 | 76.97 | 91.7 | 53.79 | 53.45 | 16.09 |
| Deprivation: Medium | 647,115 | 4.75 | 2.02 | 20.2 | 71.25 | 89.62 | 51.3 | 51.18 | 16.2 |
| Deprivation: High | 630,160 | 4.44 | 2.02 | 16.39 | 65.5 | 86.52 | 48.91 | 48.96 | 16.14 |
| Deprivation: Very high | 604,450 | 4.12 | 2 | 12.85 | 59.1 | 84.51 | 47.02 | 47.04 | 15.74 |
| Deprivation: Unknown | 197,965 | 5.86 | 2.21 | 42.43 | 83.64 | 39.07 | 57.52 | 56.78 | 16.65 |
Values have been rounded to the nearest 5. * indicates that results are withheld for very small groups out of concern for disclosure.
Table C1.7 2019 entries in GCSE equalities dataset: results and prior attainment information broken down by centre type, region, prior attainment category, ethnicity, major language, SEND status, FSM eligibility status, deprivation
| Group | N | MeanGrade | GradeSD | %GradeA | %GradeC | %PA | PAMedian | PAMean | PASD |
|---|---|---|---|---|---|---|---|---|---|
| Centre Type: Academies | 2,032,875 | 4.82 | 2.06 | 21.75 | 72.11 | 89.33 | 51.93 | 51.78 | 16.41 |
| Centre Type: Free schools | 39,300 | 4.74 | 2.08 | 20.74 | 70.74 | 84.61 | 50 | 49.59 | 15.98 |
| Centre Type: Further education establishment | 4,020 | 3.08 | 1.72 | 4.08 | 36.38 | 80.23 | 43.67 | 44.18 | 13.66 |
| Centre Type: Independent school including city training colleges (CTCs) | 166,420 | 6.32 | 1.93 | 48.88 | 91.89 | 43.6 | 59.18 | 58.67 | 15.92 |
| Centre Type: Other | 35,810 | 3.39 | 2.12 | 9.63 | 41.74 | 79.2 | 45.39 | 45.11 | 16.57 |
| Centre Type: Secondary comprehensive or middle school | 1,141,315 | 4.67 | 2.02 | 18.94 | 69.98 | 88.36 | 50.75 | 50.61 | 15.77 |
| Centre Type: Secondary modern school/high school | 52,180 | 4.25 | 1.89 | 12.34 | 63.37 | 89.01 | 47.48 | 47.3 | 14.81 |
| Centre Type: Secondary selective school | 82,575 | 6.78 | 1.63 | 58.27 | 97.16 | 89.06 | 69.34 | 69.6 | 11.31 |
| Centre Type: Sixth form college | 1,565 | 4.09 | 2.03 | 12.45 | 60.09 | 83.52 | 50.54 | 50.73 | 14.33 |
| Centre Type: Tertiary college | 1,510 | 4.07 | 2.02 | 11.04 | 60.58 | 76.46 | 48.49 | 49.32 | 14.66 |
| Region: East Midlands | 305,755 | 4.71 | 2.03 | 19.86 | 70.61 | 88.41 | 51.3 | 50.97 | 16.4 |
| Region: East of England | 413,260 | 4.88 | 2.07 | 22.62 | 72.78 | 87.99 | 51.8 | 51.71 | 16.59 |
| Region: London | 551,640 | 5.14 | 2.16 | 28.02 | 75.68 | 80.6 | 52.81 | 52.83 | 16.31 |
| Region: North East | 146,360 | 4.63 | 2 | 18.04 | 69.68 | 91 | 51.93 | 51.84 | 16.02 |
| Region: North West | 478,955 | 4.72 | 2.07 | 20.51 | 70.42 | 87.82 | 51.93 | 51.87 | 15.91 |
| Region: South East | 603,380 | 5.03 | 2.1 | 25.42 | 74.97 | 86.23 | 53.2 | 52.88 | 16.37 |
| Region: South West | 346,540 | 4.87 | 2.06 | 22.33 | 73.04 | 88.15 | 51.97 | 51.88 | 16.44 |
| Region: West Midlands | 376,600 | 4.71 | 2.06 | 20.29 | 69.97 | 87.37 | 51.05 | 50.96 | 16.51 |
| Region: Yorkshire and the Humber | 335,085 | 4.68 | 2.06 | 19.62 | 69.98 | 88.66 | 50.33 | 50.22 | 16.42 |
| Gender: F | 1,797,875 | 5.1 | 2.05 | 25.84 | 76.63 | 87.13 | 51.8 | 51.75 | 16.31 |
| Gender: M | 1,759,565 | 4.62 | 2.09 | 19.43 | 68.15 | 86.25 | 52.1 | 51.9 | 16.42 |
| Gender: Unknown/Neither | * | * | * | * | * | * | * | * | * |
| Prior attainment: Very low | 551,875 | 3 | 1.46 | 1.51 | 33.04 | 100 | 29.64 | 27.75 | 7.51 |
| Prior attainment: Low | 583,650 | 3.95 | 1.54 | 5.22 | 60.55 | 100 | 41.97 | 41.83 | 2.77 |
| Prior attainment: Medium | 617,525 | 4.69 | 1.61 | 12.55 | 77.84 | 100 | 50.67 | 50.62 | 2.42 |
| Prior attainment: High | 645,500 | 5.53 | 1.66 | 27.49 | 89.6 | 100 | 59.32 | 59.41 | 2.77 |
| Prior attainment: Very high | 685,690 | 6.74 | 1.64 | 57.39 | 96.92 | 100 | 71.85 | 73.66 | 7.49 |
| Prior attainment: Unknown | 473,335 | 4.75 | 2.35 | 25.18 | 67.08 | 0 | 0 | 0 | 0 |
| Ethnicity: ABAN | 57,555 | 5.1 | 2.05 | 26.32 | 76.49 | 80.68 | 49.46 | 49.97 | 16.4 |
| Ethnicity: AIND | 104,515 | 5.76 | 2.09 | 38.95 | 84.18 | 83.86 | 56.47 | 55.9 | 16.65 |
| Ethnicity: AOTH | 62,245 | 5.55 | 2.11 | 34.98 | 81.78 | 80.42 | 54.61 | 54.61 | 16.25 |
| Ethnicity: APKN | 139,880 | 4.7 | 2.06 | 20.31 | 69.57 | 85.62 | 47.53 | 47.54 | 16.13 |
| Ethnicity: BAFR | 124,490 | 4.82 | 2.02 | 21.47 | 72.37 | 75.45 | 49.42 | 49.37 | 15.56 |
| Ethnicity: BCRB | 44,435 | 4.03 | 1.89 | 10.5 | 57.77 | 87.51 | 45.47 | 45.73 | 14.88 |
| Ethnicity: BOTH | 23,810 | 4.42 | 2.01 | 16.09 | 64.61 | 72.11 | 46.93 | 46.87 | 15.56 |
| Ethnicity: CHNE | 13,700 | 6.41 | 1.96 | 51.47 | 91.55 | 81.18 | 63.33 | 62.8 | 16.6 |
| Ethnicity: MOTH | 64,575 | 5.03 | 2.13 | 25.96 | 74.56 | 83.63 | 53.07 | 52.76 | 16.41 |
| Ethnicity: MWAS | 40,805 | 5.38 | 2.15 | 32.25 | 79.15 | 88.63 | 56.33 | 55.56 | 17.09 |
| Ethnicity: MWBA | 20,730 | 4.82 | 2.03 | 21.46 | 72.28 | 84.4 | 51.05 | 51.41 | 15.84 |
| Ethnicity: MWBC | 45,075 | 4.28 | 1.98 | 13.91 | 63.05 | 91.34 | 48.83 | 48.66 | 15.52 |
| Ethnicity: OOTH | 57,645 | 4.88 | 2.15 | 24.09 | 72.3 | 71.93 | 50.63 | 50.18 | 16.39 |
| Ethnicity: WBRI | 2,328,905 | 4.75 | 2.03 | 20.14 | 71.35 | 93.81 | 52.18 | 52.02 | 16.21 |
| Ethnicity: WIRI | 11,265 | 5.36 | 2.03 | 30.58 | 80.48 | 88.04 | 57.43 | 56.83 | 15.92 |
| Ethnicity: WIRT | 735 | 3.46 | 1.94 | 7.35 | 45.03 | 86.94 | 46.76 | 45.75 | 16.31 |
| Ethnicity: WOTH | 172,665 | 4.73 | 2.17 | 21.94 | 69.52 | 68.05 | 49.96 | 49.91 | 16.98 |
| Ethnicity: WROM | 5,660 | 2.32 | 1.77 | 1.93 | 23.53 | 53.73 | 34.55 | 33.85 | 15.71 |
| Ethnicity: Unknown | 238,880 | 5.68 | 2.23 | 38.94 | 81.58 | 47.35 | 55.49 | 55.1 | 16.84 |
| Major language: English | 2,805,480 | 4.79 | 2.05 | 21.08 | 71.81 | 92.57 | 52.18 | 52.05 | 16.26 |
| Major language: Not English | 547,355 | 4.85 | 2.15 | 23.58 | 71.41 | 73.58 | 49.37 | 49.4 | 16.6 |
| Major language: Unknown | 204,745 | 5.84 | 2.21 | 41.89 | 83.65 | 41.19 | 56.92 | 56.46 | 16.72 |
| SEND: No SEND | 2,982,685 | 4.99 | 2.01 | 23.29 | 75.63 | 90.09 | 53.11 | 53.25 | 15.49 |
| SEND: SEND | 377,835 | 3.36 | 1.94 | 7.28 | 41.05 | 84.41 | 37.63 | 38.57 | 17.3 |
| SEND: Unknown | 197,055 | 5.88 | 2.2 | 42.71 | 84.18 | 39.75 | 57.38 | 56.89 | 16.73 |
| FSM: Not FSM | 2,952,855 | 4.94 | 2.04 | 23.14 | 74.46 | 89.87 | 52.81 | 52.68 | 16.17 |
| FSM: FSM | 407,670 | 3.78 | 1.96 | 9.52 | 52.05 | 86.42 | 44.29 | 44.24 | 15.62 |
| FSM: Unknown | 197,055 | 5.88 | 2.2 | 42.71 | 84.18 | 39.75 | 57.38 | 56.89 | 16.73 |
| Deprivation: Very low | 716,505 | 5.46 | 1.98 | 30.98 | 83.05 | 92.19 | 56.6 | 56.25 | 15.81 |
| Deprivation: Low | 697,870 | 5.08 | 2.01 | 24.73 | 77.08 | 92.03 | 53.92 | 53.69 | 16.11 |
| Deprivation: Medium | 668,550 | 4.76 | 2.03 | 20.45 | 71.4 | 90.02 | 51.38 | 51.31 | 16.25 |
| Deprivation: High | 646,725 | 4.45 | 2.03 | 16.63 | 65.62 | 87 | 49 | 48.94 | 16.02 |
| Deprivation: Very high | 625,530 | 4.15 | 2.01 | 13.18 | 59.6 | 85.54 | 47.02 | 47.01 | 15.79 |
| Deprivation: Unknown | 202,395 | 5.85 | 2.21 | 42.04 | 83.68 | 40.43 | 56.97 | 56.5 | 16.79 |
Values have been rounded to the nearest 5. * indicates that results are withheld for very small groups out of concern for disclosure.
Table C1.8 2020 entries in GCSE equalities dataset: results and prior attainment information broken down by centre type, region, prior attainment category, ethnicity, major language, SEND status, FSM eligibility status, deprivation
| Group | N | MeanGrade | GradeSD | %GradeA | %GradeC | %PA | PAMedian | PAMean | PASD |
|---|---|---|---|---|---|---|---|---|---|
| Centre Type: Academies | 2,086,520 | 5.2 | 1.99 | 26.67 | 79.62 | 90.09 | 51.76 | 51.66 | 16.42 |
| Centre Type: Free schools | 40,915 | 5.16 | 1.98 | 25.86 | 79.15 | 86.15 | 49.33 | 49.16 | 15.84 |
| Centre Type: Further education establishment | 4,735 | 3.69 | 1.78 | 7.48 | 50.58 | 80 | 43.73 | 44.4 | 14.23 |
| Centre Type: Independent school including city training colleges (CTCs) | 170,310 | 6.78 | 1.74 | 58.58 | 96.4 | 43.19 | 58.55 | 58.32 | 15.77 |
| Centre Type: Other | 37,500 | 3.94 | 2.08 | 13.3 | 53.95 | 78.61 | 44.82 | 44.54 | 16.33 |
| Centre Type: Secondary comprehensive or middle school | 1,172,540 | 5.08 | 1.95 | 24.03 | 78.44 | 89.28 | 50.71 | 50.56 | 15.79 |
| Centre Type: Secondary modern school/high school | 53,295 | 4.65 | 1.83 | 16.03 | 72.82 | 89.55 | 47.06 | 46.74 | 14.85 |
| Centre Type: Secondary selective school | 83,665 | 7.06 | 1.48 | 65.12 | 98.98 | 89.13 | 69.26 | 69.47 | 11.56 |
| Centre Type: Sixth form college | 1,540 | 4.59 | 2.07 | 19.01 | 69.31 | 85.01 | 52.6 | 51.74 | 15.42 |
| Centre Type: Tertiary college | 1,990 | 4.59 | 1.85 | 14.67 | 72.71 | 75.43 | 47.06 | 46.99 | 15.35 |
| Region: East Midlands | 314,215 | 5.09 | 1.97 | 24.42 | 78.34 | 89.25 | 51.05 | 50.75 | 16.23 |
| Region: East of England | 424,175 | 5.28 | 2 | 28 | 80.48 | 88.88 | 51.97 | 51.72 | 16.7 |
| Region: London | 565,120 | 5.54 | 2.05 | 33.57 | 82.98 | 81.45 | 52.56 | 52.68 | 16.28 |
| Region: North East | 152,170 | 5.06 | 1.96 | 23.59 | 78.15 | 91.98 | 52.14 | 52.05 | 16.01 |
| Region: North West | 499,670 | 5.13 | 2 | 25.56 | 78.4 | 88.52 | 51.84 | 51.83 | 15.92 |
| Region: South East | 614,380 | 5.41 | 2.02 | 30.92 | 81.93 | 86.58 | 53.03 | 52.69 | 16.51 |
| Region: South West | 351,350 | 5.28 | 1.98 | 27.8 | 81.09 | 88.62 | 51.97 | 51.85 | 16.36 |
| Region: West Midlands | 384,230 | 5.1 | 1.99 | 25.28 | 78.03 | 88.22 | 50.92 | 50.86 | 16.5 |
| Region: Yorkshire and the Humber | 347,685 | 5.04 | 2 | 24.16 | 77.4 | 89.63 | 49.75 | 49.76 | 16.39 |
| Gender: F | 1,846,585 | 5.49 | 1.98 | 31.77 | 83.74 | 87.87 | 51.55 | 51.52 | 16.23 |
| Gender: M | 1,806,215 | 5.01 | 2.02 | 23.85 | 76.28 | 86.99 | 52.05 | 51.87 | 16.51 |
| Gender: Unknown/Neither | * | * | * | * | * | * | * | * | * |
| Prior attainment: Very low | 572,480 | 3.4 | 1.39 | 2.13 | 45.07 | 100 | 29.55 | 27.63 | 7.5 |
| Prior attainment: Low | 608,480 | 4.36 | 1.47 | 7.37 | 73.39 | 100 | 41.88 | 41.74 | 2.78 |
| Prior attainment: Medium | 641,185 | 5.11 | 1.54 | 17.41 | 86.86 | 100 | 50.59 | 50.56 | 2.43 |
| Prior attainment: High | 668,445 | 5.93 | 1.57 | 35.79 | 94.29 | 100 | 59.23 | 59.36 | 2.78 |
| Prior attainment: Very high | 703,285 | 7.09 | 1.53 | 66.68 | 98.36 | 100 | 71.75 | 73.64 | 7.5 |
| Prior attainment: Unknown | 459,140 | 5.16 | 2.29 | 30.66 | 74.19 | 0 | 0 | 0 | 0 |
| Ethnicity: ABAN | 61,240 | 5.46 | 1.96 | 31.16 | 83.41 | 80.73 | 49.42 | 49.74 | 15.83 |
| Ethnicity: AIND | 107,650 | 6.12 | 1.99 | 45.25 | 89.35 | 83.82 | 56.38 | 56.02 | 16.63 |
| Ethnicity: AOTH | 68,110 | 5.86 | 2.02 | 40.06 | 86.76 | 81.28 | 54.57 | 54.34 | 16.48 |
| Ethnicity: APKN | 142,645 | 5.04 | 1.99 | 24.24 | 76.82 | 85.24 | 47.06 | 47.3 | 16.2 |
| Ethnicity: BAFR | 134,330 | 5.18 | 1.92 | 25.49 | 80.11 | 77.23 | 49.21 | 49.19 | 15.56 |
| Ethnicity: BCRB | 43,460 | 4.54 | 1.8 | 14.32 | 70.42 | 89.27 | 45.86 | 45.66 | 14.54 |
| Ethnicity: BOTH | 26,330 | 4.87 | 1.93 | 20.65 | 74.8 | 76.85 | 47.48 | 47.46 | 15.41 |
| Ethnicity: CHNE | 13,795 | 6.77 | 1.85 | 59.06 | 94.92 | 83.67 | 60.98 | 60.44 | 16.99 |
| Ethnicity: MOTH | 69,970 | 5.36 | 2.03 | 30.04 | 81.08 | 84.11 | 52.86 | 52.53 | 16.5 |
| Ethnicity: MWAS | 43,290 | 5.74 | 2.05 | 37.67 | 85.13 | 88.97 | 55.62 | 55.48 | 17.04 |
| Ethnicity: MWBA | 23,550 | 5.2 | 2 | 26.86 | 79.39 | 86.34 | 51.72 | 51.31 | 16.1 |
| Ethnicity: MWBC | 47,860 | 4.68 | 1.92 | 18.07 | 71.83 | 92.45 | 48.49 | 48.6 | 15.66 |
| Ethnicity: OOTH | 63,210 | 5.25 | 2.08 | 28.9 | 79.04 | 71.74 | 49.5 | 49.79 | 16.54 |
| Ethnicity: WBRI | 2,368,050 | 5.13 | 1.96 | 25.05 | 79.16 | 94.3 | 52.05 | 51.91 | 16.21 |
| Ethnicity: WIRI | 10,920 | 5.68 | 2.04 | 36.81 | 85.07 | 88.55 | 56.88 | 56.56 | 16.26 |
| Ethnicity: WIRT | 865 | 3.78 | 1.91 | 8.9 | 54.91 | 83.58 | 43.85 | 43.3 | 15.44 |
| Ethnicity: WOTH | 186,890 | 5.18 | 2.09 | 27.76 | 77.78 | 71.25 | 50.17 | 49.8 | 17.14 |
| Ethnicity: WROM | 6,595 | 2.73 | 1.74 | 2.76 | 30.97 | 54.21 | 34.29 | 33.3 | 16.8 |
| Ethnicity: Unknown | 234,245 | 6.23 | 2.07 | 48.64 | 89.2 | 49.27 | 55.36 | 55.09 | 16.73 |
| Major language: English | 2,885,560 | 5.18 | 1.97 | 26.05 | 79.61 | 93.09 | 52.1 | 51.96 | 16.26 |
| Major language: Not English | 573,280 | 5.21 | 2.08 | 28.27 | 78.31 | 74.39 | 48.96 | 49 | 16.64 |
| Major language: Unknown | 194,165 | 6.46 | 1.99 | 53.52 | 91.71 | 41.77 | 57.2 | 56.91 | 16.47 |
| SEND: No SEND | 3,060,430 | 5.38 | 1.93 | 28.72 | 83.25 | 90.55 | 53.03 | 53.16 | 15.5 |
| SEND: SEND | 404,780 | 3.74 | 1.88 | 8.94 | 50.16 | 85.52 | 37.85 | 38.7 | 17.22 |
| SEND: Unknown | 187,795 | 6.52 | 1.97 | 54.56 | 92.37 | 40.76 | 57.66 | 57.29 | 16.36 |
| FSM: Not FSM | 2,984,505 | 5.35 | 1.96 | 28.69 | 82.28 | 90.43 | 52.86 | 52.7 | 16.17 |
| FSM: FSM | 480,705 | 4.17 | 1.91 | 12.24 | 61.39 | 87.03 | 44.2 | 44.21 | 15.54 |
| FSM: Unknown | 187,795 | 6.52 | 1.97 | 54.56 | 92.37 | 40.76 | 57.66 | 57.29 | 16.36 |
| Deprivation: Very low | 725,255 | 5.8 | 1.89 | 36.59 | 88.47 | 92.57 | 56.51 | 56.09 | 15.93 |
| Deprivation: Low | 723,465 | 5.45 | 1.92 | 30.09 | 84.11 | 92.24 | 53.67 | 53.53 | 16.07 |
| Deprivation: Medium | 692,435 | 5.17 | 1.97 | 25.77 | 79.45 | 89.86 | 51.34 | 51.19 | 16.25 |
| Deprivation: High | 673,890 | 4.88 | 1.98 | 21.43 | 74.62 | 87.68 | 49.12 | 49.09 | 16.1 |
| Deprivation: Very high | 645,155 | 4.54 | 1.96 | 16.76 | 68.81 | 87.17 | 46.76 | 46.82 | 15.74 |
| Deprivation: Unknown | 192,800 | 6.48 | 1.98 | 53.73 | 91.91 | 41.34 | 57.2 | 56.94 | 16.43 |
Values have been rounded to the nearest 5. * indicates that results are withheld for very small groups out of concern for disclosure.
Table C1.9 2021 entries in GCSE equalities dataset: results and prior attainment information broken down by centre type, region, prior attainment category, ethnicity, major language, SEND status, FSM eligibility status, deprivation
| Group | N | MeanGrade | GradeSD | %GradeA | %GradeC | %PA | PAMedian | PAMean | PASD |
|---|---|---|---|---|---|---|---|---|---|
| Centre Type: Academies | 2,131,780 | 5.26 | 2.06 | 28.71 | 79.87 | 90.62 | 51.66 | 51.67 | 16.42 |
| Centre Type: Free schools | 42,200 | 5.25 | 2.1 | 29.17 | 79.14 | 87.5 | 49.44 | 49.22 | 15.94 |
| Centre Type: Further education establishment | 4,805 | 3.82 | 2.01 | 10.3 | 55.82 | 77.38 | 43.95 | 43.59 | 14.55 |
| Centre Type: Independent school including city training colleges (CTCs) | 172,740 | 6.92 | 1.79 | 62.25 | 96.32 | 43.49 | 58.95 | 58.72 | 15.77 |
| Centre Type: Other | 35,980 | 4.02 | 2.24 | 15.22 | 56.16 | 79.1 | 45.16 | 44.85 | 16.68 |
| Centre Type: Secondary comprehensive or middle school | 1,201,685 | 5.13 | 2.03 | 26.24 | 78.67 | 89.77 | 50.64 | 50.53 | 15.74 |
| Centre Type: Secondary modern school/high school | 55,490 | 4.7 | 1.94 | 18.49 | 72.59 | 90.44 | 47.19 | 46.9 | 14.51 |
| Centre Type: Secondary selective school | 87,875 | 7.15 | 1.48 | 67.92 | 98.84 | 89.98 | 70.28 | 70.53 | 11.67 |
| Centre Type: Sixth form college | 1,775 | 4.5 | 2.27 | 21.01 | 66.2 | 87.32 | 53.48 | 51.78 | 14.32 |
| Centre Type: Tertiary college | 1,825 | 4.48 | 2.12 | 17.65 | 67.98 | 72.37 | 46.59 | 46.81 | 16.38 |
| Region: East Midlands | 319,275 | 5.15 | 2.04 | 26.33 | 78.53 | 89.72 | 50.61 | 50.39 | 16.14 |
| Region: East of England | 431,200 | 5.35 | 2.07 | 30.32 | 80.95 | 89.06 | 51.61 | 51.6 | 16.63 |
| Region: London | 576,370 | 5.61 | 2.13 | 36.26 | 83 | 82.32 | 53.39 | 53.7 | 16.41 |
| Region: North East | 158,535 | 5.12 | 2.03 | 25.68 | 78.98 | 92.76 | 52.56 | 52.48 | 15.72 |
| Region: North West | 513,960 | 5.17 | 2.08 | 27.49 | 78.56 | 88.94 | 51.39 | 51.32 | 15.93 |
| Region: South East | 624,085 | 5.48 | 2.09 | 33.36 | 82.28 | 87.27 | 53.16 | 52.9 | 16.56 |
| Region: South West | 360,900 | 5.36 | 2.05 | 30.31 | 81.41 | 89.06 | 51.88 | 51.83 | 16.44 |
| Region: West Midlands | 393,740 | 5.14 | 2.07 | 27.09 | 77.93 | 88.64 | 50.41 | 50.53 | 16.44 |
| Region: Yorkshire and the Humber | 358,095 | 5.1 | 2.07 | 26.22 | 77.88 | 90.09 | 49.75 | 49.78 | 16.35 |
| Gender: F | 1,887,990 | 5.56 | 2.07 | 34.41 | 83.57 | 88.43 | 52.05 | 52.08 | 16.28 |
| Gender: M | 1,847,985 | 5.07 | 2.08 | 25.66 | 76.97 | 87.51 | 51.45 | 51.4 | 16.49 |
| Gender: Unknown/Neither | * | * | * | * | * | * | * | * | * |
| Prior attainment: Very low | 591,025 | 3.37 | 1.5 | 2.57 | 45.54 | 100 | 29.68 | 27.79 | 7.39 |
| Prior attainment: Low | 629,370 | 4.45 | 1.55 | 9.25 | 74.91 | 100 | 41.89 | 41.77 | 2.77 |
| Prior attainment: Medium | 653,080 | 5.18 | 1.62 | 20.03 | 86.83 | 100 | 50.53 | 50.53 | 2.4 |
| Prior attainment: High | 685,225 | 5.99 | 1.63 | 38.37 | 94 | 100 | 59.22 | 59.33 | 2.79 |
| Prior attainment: Very high | 728,155 | 7.19 | 1.52 | 69.77 | 98.42 | 100 | 71.88 | 73.74 | 7.62 |
| Prior attainment: Unknown | 449,300 | 5.21 | 2.41 | 33.09 | 73.84 | 0 | 0 | 0 | 0 |
| Ethnicity: ABAN | 59,790 | 5.6 | 2.02 | 34.93 | 84.1 | 81.86 | 51.02 | 51.42 | 15.73 |
| Ethnicity: AIND | 113,305 | 6.27 | 2.05 | 49.41 | 89.49 | 83.97 | 57.38 | 57.04 | 17.04 |
| Ethnicity: AOTH | 70,545 | 6.01 | 2.07 | 44.32 | 87.52 | 81.82 | 55.91 | 55.63 | 16.51 |
| Ethnicity: APKN | 152,155 | 5.15 | 2.08 | 27.43 | 77.45 | 86.09 | 48.1 | 48.45 | 16.15 |
| Ethnicity: BAFR | 144,825 | 5.32 | 1.98 | 28.84 | 81.62 | 79.82 | 50.26 | 50.44 | 15.5 |
| Ethnicity: BCRB | 40,875 | 4.53 | 1.91 | 16.1 | 69.7 | 89.76 | 45.76 | 45.94 | 15.16 |
| Ethnicity: BOTH | 27,675 | 4.94 | 1.98 | 22.42 | 76.17 | 79.79 | 48.19 | 48.01 | 15.35 |
| Ethnicity: CHNE | 14,245 | 6.86 | 1.82 | 62.11 | 95.26 | 83.91 | 62.69 | 62.2 | 16.85 |
| Ethnicity: MOTH | 73,670 | 5.46 | 2.1 | 33.13 | 81.83 | 85.15 | 53.07 | 53.22 | 16.51 |
| Ethnicity: MWAS | 48,225 | 5.75 | 2.1 | 38.84 | 84.83 | 90.05 | 55.91 | 55.57 | 16.75 |
| Ethnicity: MWBA | 25,285 | 5.19 | 2.02 | 27.13 | 79.27 | 85.9 | 51.17 | 51.19 | 15.8 |
| Ethnicity: MWBC | 49,690 | 4.66 | 1.98 | 18.41 | 71.62 | 92.62 | 48.36 | 48.47 | 15.36 |
| Ethnicity: OOTH | 66,970 | 5.33 | 2.16 | 31.53 | 79.38 | 73.36 | 50.61 | 50.75 | 16.18 |
| Ethnicity: WBRI | 2,384,035 | 5.17 | 2.03 | 26.83 | 79.21 | 94.91 | 51.77 | 51.66 | 16.24 |
| Ethnicity: WIRI | 11,170 | 5.73 | 2.02 | 37.46 | 86.27 | 91.15 | 56.03 | 55.93 | 16.4 |
| Ethnicity: WIRT | 815 | 3.77 | 2.02 | 11.02 | 52.75 | 83.48 | 45.88 | 43.69 | 16.91 |
| Ethnicity: WOTH | 196,765 | 5.3 | 2.15 | 30.77 | 79.35 | 73.92 | 50.61 | 50.53 | 16.96 |
| Ethnicity: WROM | 6,875 | 2.6 | 1.89 | 3.49 | 29.93 | 57.16 | 33.06 | 33.95 | 16.13 |
| Ethnicity: Unknown | 249,230 | 6.28 | 2.15 | 50.46 | 88.67 | 48.86 | 55.19 | 54.99 | 16.95 |
| Major language: English | 2,941,855 | 5.23 | 2.05 | 28.09 | 79.76 | 93.65 | 51.92 | 51.86 | 16.29 |
| Major language: Not English | 588,480 | 5.32 | 2.15 | 31.24 | 79.23 | 75.93 | 49.84 | 50.05 | 16.67 |
| Major language: Unknown | 205,820 | 6.52 | 2.08 | 55.22 | 91.12 | 41.31 | 57.22 | 56.82 | 16.72 |
| SEND: No SEND | 3,110,705 | 5.45 | 1.99 | 31.17 | 83.55 | 91.32 | 52.94 | 53.22 | 15.5 |
| SEND: SEND | 428,890 | 3.75 | 1.98 | 9.95 | 51.34 | 85.83 | 37.98 | 39.08 | 17.37 |
| SEND: Unknown | 196,555 | 6.59 | 2.04 | 56.7 | 92.03 | 39.71 | 57.96 | 57.51 | 16.57 |
| FSM: Not FSM | 2,955,425 | 5.45 | 2.01 | 31.57 | 83.12 | 91.28 | 52.98 | 52.94 | 16.13 |
| FSM: FSM | 584,165 | 4.19 | 2.01 | 13.62 | 62.08 | 87.5 | 44.7 | 44.53 | 15.72 |
| FSM: Unknown | 196,555 | 6.59 | 2.04 | 56.7 | 92.03 | 39.71 | 57.96 | 57.51 | 16.57 |
| Deprivation: Very low | 746,905 | 5.89 | 1.94 | 39.45 | 88.86 | 93.06 | 56.31 | 56.01 | 16.1 |
| Deprivation: Low | 727,755 | 5.52 | 1.99 | 32.55 | 84.34 | 92.72 | 53.61 | 53.5 | 16.06 |
| Deprivation: Medium | 715,915 | 5.22 | 2.04 | 27.91 | 79.71 | 90.46 | 51.26 | 51.31 | 16.21 |
| Deprivation: High | 686,880 | 4.92 | 2.06 | 23.32 | 74.88 | 88.68 | 49.11 | 49.19 | 16.03 |
| Deprivation: Very high | 656,935 | 4.56 | 2.05 | 18.21 | 68.93 | 88.11 | 47.08 | 46.98 | 15.81 |
| Deprivation: Unknown | 201,760 | 6.55 | 2.06 | 55.86 | 91.62 | 40.37 | 57.55 | 57.17 | 16.64 |
Values have been rounded to the nearest 5. * indicates that results are withheld for very small groups out of concern for disclosure.
Table C1.10 2022 entries in GCSE equalities dataset: results and prior attainment information broken down by centre type, region, prior attainment category, ethnicity, major language, SEND status, FSM eligibility status, deprivation
| Group | N | MeanGrade | GradeSD | %GradeA | %GradeC | %PA | PAMedian | PAMean | PASD |
|---|---|---|---|---|---|---|---|---|---|
| Centre Type: Academies | 2,129,005 | 5.1 | 2.1 | 26.24 | 76.7 | 90.53 | 51.75 | 51.74 | 16.31 |
| Centre Type: Free schools | 42,805 | 5 | 2.12 | 25.22 | 74.93 | 87.06 | 49.41 | 49.33 | 15.85 |
| Centre Type: Further education establishment | 4,350 | 3.36 | 1.92 | 6.49 | 43.12 | 75.53 | 44.64 | 44.43 | 13.77 |
| Centre Type: Independent school including city training colleges (CTCs) | 173,235 | 6.56 | 1.9 | 53.84 | 93.76 | 41.9 | 58.95 | 58.69 | 15.9 |
| Centre Type: Other | 34,855 | 3.73 | 2.24 | 12.98 | 49.04 | 79.02 | 45.06 | 44.92 | 16.98 |
| Centre Type: Secondary comprehensive or middle school | 1,201,295 | 4.96 | 2.05 | 23.3 | 75.09 | 89.95 | 50.74 | 50.64 | 15.74 |
| Centre Type: Secondary modern school/high school | 56,800 | 4.49 | 1.92 | 15.18 | 68.61 | 90.47 | 46.99 | 46.82 | 14.63 |
| Centre Type: Secondary selective school | 88,545 | 7.09 | 1.6 | 65.84 | 98.05 | 89.76 | 70.32 | 70.5 | 11.83 |
| Centre Type: Sixth form college | 1,730 | 4.1 | 2.2 | 14.35 | 59.95 | 82.29 | 51.45 | 50.88 | 16.85 |
| Centre Type: Tertiary college | 1,995 | 4.34 | 2.25 | 18.49 | 61.22 | 69.44 | 46.38 | 46.03 | 14.53 |
| Region: East Midlands | 321,675 | 4.97 | 2.05 | 23.36 | 75.29 | 89.88 | 50.46 | 50.33 | 16.1 |
| Region: East of England | 429,195 | 5.17 | 2.1 | 27.28 | 77.69 | 89.03 | 51.57 | 51.7 | 16.42 |
| Region: London | 572,485 | 5.49 | 2.17 | 34.16 | 80.54 | 82.53 | 53.79 | 53.82 | 16.38 |
| Region: North East | 159,985 | 4.94 | 2.05 | 23.16 | 74.96 | 92.29 | 52.56 | 52.52 | 15.87 |
| Region: North West | 514,805 | 4.97 | 2.11 | 24.32 | 74.48 | 88.53 | 51.34 | 51.32 | 15.89 |
| Region: South East | 627,800 | 5.31 | 2.13 | 30.19 | 79.2 | 87.06 | 53 | 52.84 | 16.49 |
| Region: South West | 358,865 | 5.14 | 2.07 | 26.32 | 77.78 | 88.72 | 51.79 | 51.79 | 16.22 |
| Region: West Midlands | 390,535 | 4.99 | 2.1 | 24.47 | 74.68 | 88.6 | 50.59 | 50.73 | 16.51 |
| Region: Yorkshire and the Humber | 359,265 | 4.95 | 2.09 | 23.75 | 74.75 | 90.27 | 50.21 | 50.17 | 16.37 |
| Gender: F | 1,880,335 | 5.36 | 2.09 | 30.71 | 80.26 | 88.23 | 52.03 | 52.1 | 16.26 |
| Gender: M | 1,854,125 | 4.92 | 2.12 | 23.6 | 73.74 | 87.54 | 51.63 | 51.52 | 16.4 |
| Gender: Unknown/Neither | * | * | * | * | * | * | * | * | * |
| Prior attainment: Very low | 591,490 | 3.22 | 1.56 | 2.38 | 39.88 | 100 | 29.88 | 27.99 | 7.34 |
| Prior attainment: Low | 627,165 | 4.29 | 1.6 | 8.1 | 69.55 | 100 | 42.01 | 41.88 | 2.75 |
| Prior attainment: Medium | 655,605 | 5 | 1.67 | 17.56 | 82.88 | 100 | 50.65 | 50.62 | 2.41 |
| Prior attainment: High | 684,365 | 5.79 | 1.69 | 33.77 | 91.76 | 100 | 59.31 | 59.41 | 2.78 |
| Prior attainment: Very high | 723,675 | 7.01 | 1.6 | 64.48 | 97.66 | 100 | 71.94 | 73.8 | 7.58 |
| Prior attainment: Unknown | 452,315 | 5.09 | 2.39 | 30.33 | 72.15 | 0 | 0 | 0 | 0 |
| Ethnicity: ABAN | 61,510 | 5.53 | 2.05 | 33.74 | 82.61 | 82.73 | 51.7 | 51.87 | 16.09 |
| Ethnicity: AIND | 119,780 | 6.22 | 2.05 | 47.88 | 89.01 | 84.29 | 57.57 | 57.1 | 16.82 |
| Ethnicity: AOTH | 72,190 | 5.86 | 2.1 | 40.88 | 85.73 | 81.97 | 55.94 | 55.4 | 16.42 |
| Ethnicity: APKN | 153,025 | 5.04 | 2.11 | 25.76 | 75.11 | 85.77 | 48.41 | 48.63 | 16.17 |
| Ethnicity: BAFR | 149,890 | 5.21 | 2.02 | 27.09 | 79.23 | 79.37 | 50.68 | 50.84 | 15.63 |
| Ethnicity: BCRB | 39,410 | 4.35 | 1.98 | 14.31 | 64.41 | 89.32 | 46.72 | 46.67 | 15.13 |
| Ethnicity: BOTH | 27,050 | 4.85 | 2.03 | 21.54 | 73.35 | 80.54 | 48.69 | 48.62 | 15.36 |
| Ethnicity: CHNE | 15,675 | 6.67 | 1.93 | 57.53 | 93.22 | 76.69 | 62.78 | 61.6 | 16.72 |
| Ethnicity: MOTH | 75,065 | 5.33 | 2.17 | 31.01 | 78.75 | 85.5 | 53.26 | 53.42 | 16.79 |
| Ethnicity: MWAS | 51,545 | 5.67 | 2.13 | 37.17 | 83.34 | 89.66 | 55.78 | 55.48 | 16.85 |
| Ethnicity: MWBA | 27,780 | 5.03 | 2.05 | 24.39 | 76.31 | 86.87 | 51.05 | 50.96 | 15.21 |
| Ethnicity: MWBC | 50,410 | 4.46 | 2.01 | 16.1 | 66.76 | 93.62 | 48.56 | 48.44 | 15.58 |
| Ethnicity: OOTH | 69,000 | 5.2 | 2.22 | 29.85 | 76.6 | 73.44 | 50.95 | 50.85 | 16.35 |
| Ethnicity: WBRI | 2,341,940 | 4.98 | 2.06 | 23.69 | 75.33 | 95.06 | 51.75 | 51.71 | 16.14 |
| Ethnicity: WIRI | 10,370 | 5.67 | 2.1 | 36.84 | 83.68 | 91.52 | 57.46 | 57.05 | 15.95 |
| Ethnicity: WIRT | 900 | 3.69 | 1.92 | 8.46 | 50.67 | 85.52 | 42.99 | 42.98 | 16.04 |
| Ethnicity: WOTH | 206,160 | 5.17 | 2.17 | 28.39 | 77.07 | 77.13 | 50.4 | 50.25 | 16.99 |
| Ethnicity: WROM | 6,490 | 2.6 | 1.9 | 2.97 | 30.12 | 65.93 | 33.17 | 33.21 | 17 |
| Ethnicity: Unknown | 256,425 | 5.96 | 2.19 | 43.49 | 85.67 | 46.79 | 55.45 | 55.17 | 16.73 |
| Major language: English | 2,928,885 | 5.06 | 2.08 | 25.29 | 76.2 | 93.79 | 51.99 | 51.97 | 16.22 |
| Major language: Not English | 593,615 | 5.21 | 2.18 | 29.26 | 77.1 | 76.34 | 49.84 | 49.89 | 16.66 |
| Major language: Unknown | 212,110 | 6.17 | 2.14 | 47.45 | 88.15 | 38.8 | 57.42 | 57.07 | 16.65 |
| SEND: No SEND | 3,095,880 | 5.28 | 2.03 | 28.23 | 80.3 | 91.35 | 53.09 | 53.35 | 15.39 |
| SEND: SEND | 437,655 | 3.67 | 2.03 | 9.79 | 48.32 | 86.94 | 38.18 | 39.2 | 17.43 |
| SEND: Unknown | 201,080 | 6.24 | 2.11 | 48.72 | 89.07 | 36.61 | 58.29 | 57.93 | 16.4 |
| FSM: Not FSM | 2,893,895 | 5.31 | 2.05 | 28.98 | 80.4 | 91.49 | 53.2 | 53.15 | 16.05 |
| FSM: FSM | 639,640 | 4.05 | 2.03 | 12.24 | 57.97 | 87.71 | 44.75 | 44.69 | 15.63 |
| FSM: Unknown | 201,080 | 6.24 | 2.11 | 48.72 | 89.07 | 36.61 | 58.29 | 57.93 | 16.4 |
| Deprivation: Very low | 742,575 | 5.75 | 1.98 | 36.46 | 86.64 | 92.93 | 56.26 | 56.14 | 15.89 |
| Deprivation: Low | 735,380 | 5.36 | 2.03 | 29.39 | 81.32 | 92.7 | 53.61 | 53.53 | 16.04 |
| Deprivation: Medium | 700,745 | 5.06 | 2.08 | 25.18 | 76.31 | 90.85 | 51.31 | 51.31 | 16.14 |
| Deprivation: High | 692,355 | 4.75 | 2.09 | 20.93 | 71.05 | 88.89 | 49.16 | 49.21 | 16.06 |
| Deprivation: Very high | 658,055 | 4.4 | 2.07 | 16.36 | 64.78 | 88.44 | 47.33 | 47.21 | 15.83 |
| Deprivation: Unknown | 205,500 | 6.21 | 2.12 | 48.16 | 88.7 | 37.18 | 58.02 | 57.69 | 16.45 |
Values have been rounded to the nearest 5. * indicates that results are withheld for very small groups out of concern for disclosure.
Appendix C.2 - VTQ
Table C2.1 Counts of learners included in the equalities analysis per qualification group – Level 1/2
| Qualification group | 2018 | 2019 | 2020 | 2021 | 2022 |
|---|---|---|---|---|---|
| Technical Award | 156,940 | 251,345 | 368,285 | 413,130 | 401,725 |
| Technical Certificates | 8,100 | 16,320 | 13,115 | 14,375 | 18,100 |
| Total | 165,035 | 267,670 | 381,400 | 427,505 | 419,825 |
Values have been rounded to the nearest 5.
Table C2.2 Counts of learners included in the equalities analysis per qualification group – Level 3
| Qualification group | 2018 | 2019 | 2020 | 2021 | 2022 |
|---|---|---|---|---|---|
| Applied General qualifications | 76,105 | 96,065 | 140,775 | 197,250 | 234,060 |
| Tech Levels | 21,845 | 23,745 | 25,905 | 41,990 | 51,830 |
| Total | 97,955 | 119,810 | 166,680 | 239,245 | 285,890 |
Values have been rounded to the nearest 5.
Table and figure C2.3. Proportions of learners and top grades achieved each year for breakdowns by Ethnicity – Level 1/2, Technical Award qualifications
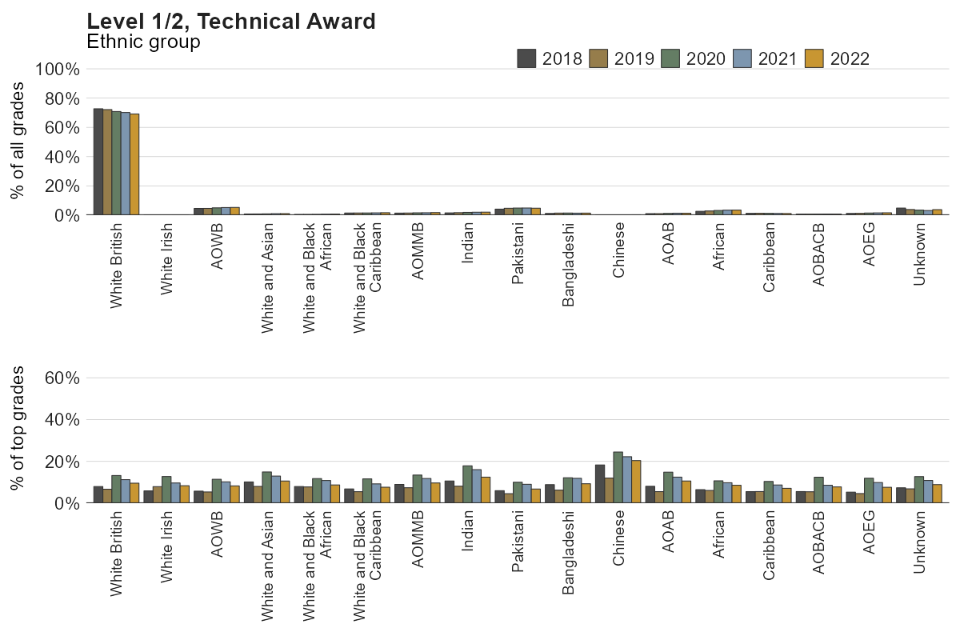
| Category | Percentage of awards in 2018 | Percentage of awards in 2019 | Percentage of awards in 2020 | Percentage of awards in 2021 | Percentage of awards in 2022 | Percentage of top grades awarded in 2018 | Percentage of top grades awarded in 2019 | Percentage of top grades awarded in 2020 | Percentage of top grades awarded in 2021 | Percentage of top grades awarded in 2022 |
|---|---|---|---|---|---|---|---|---|---|---|
| White British | 72.7 | 72.1 | 70.8 | 70.1 | 69.1 | 8 | 6.7 | 13.2 | 11.3 | 9.6 |
| White Irish | <1 | <1 | <1 | <1 | <1 | 5.9 | 7.9 | 12.7 | 9.7 | 8.4 |
| Any other White background (AOWB) | 4.6 | 4.6 | 5 | 5.2 | 5.3 | 5.8 | 5.4 | 11.4 | 10.2 | 8.3 |
| White and Asian | <1 | <1 | <1 | 1 | 1 | 10.2 | 8 | 14.9 | 13 | 10.6 |
| White and Black African | <1 | <1 | <1 | <1 | <1 | 8 | 7.8 | 11.8 | 10.9 | 8.7 |
| White and Black Caribbean | 1.4 | 1.5 | 1.5 | 1.5 | 1.6 | 6.8 | 5.5 | 11.6 | 9.2 | 7.6 |
| Any other Mixed or Multiple background (AOMMB) | 1.4 | 1.4 | 1.6 | 1.6 | 1.7 | 9 | 7.4 | 13.5 | 11.8 | 9.7 |
| Indian | 1.5 | 1.7 | 1.9 | 2 | 2 | 10.6 | 8.1 | 17.9 | 16 | 12.5 |
| Pakistani | 4.1 | 4.7 | 4.8 | 4.9 | 4.7 | 6 | 4.6 | 10 | 9 | 6.8 |
| Bangladeshi | 1.2 | 1.4 | 1.4 | 1.4 | 1.4 | 8.9 | 6.3 | 12.2 | 11.9 | 9.3 |
| Chinese | <1 | <1 | <1 | <1 | <1 | 18.3 | 12 | 24.5 | 22.2 | 20.4 |
| Any other Asian background (AOAB) | 1 | 1 | 1.2 | 1.3 | 1.3 | 8.1 | 5.5 | 14.8 | 12.5 | 10.6 |
| African | 2.6 | 2.8 | 3.2 | 3.4 | 3.5 | 6.5 | 6.1 | 10.7 | 9.8 | 8.6 |
| Caribbean | 1.2 | 1.3 | 1.2 | 1.2 | 1.1 | 5.5 | 5.6 | 10.4 | 8.7 | 7.1 |
| Any other Black, African or Caribbean background (AOBACB) | <1 | <1 | <1 | <1 | <1 | 5.6 | 5.5 | 12.4 | 8.6 | 7.8 |
| Any other ethnic group (AOEG) | 1.2 | 1.2 | 1.4 | 1.5 | 1.6 | 5.3 | 4.6 | 11.9 | 9.9 | 7.6 |
| Unknown | 4.8 | 3.8 | 3.4 | 3.1 | 3.8 | 7.4 | 6.9 | 12.7 | 10.9 | 8.9 |
Table and figure C2.4. Proportions of learners and top grades achieved each year for breakdowns by FSM – Level 1/2, Technical Award qualifications

| Category | Percentage of awards in 2018 | Percentage of awards in 2019 | Percentage of awards in 2020 | Percentage of awards in 2021 | Percentage of awards in 2022 | Percentage of top grades awarded in 2018 | Percentage of top grades awarded in 2019 | Percentage of top grades awarded in 2020 | Percentage of top grades awarded in 2021 | Percentage of top grades awarded in 2022 |
|---|---|---|---|---|---|---|---|---|---|---|
| No FSM | 82.1 | 80.8 | 79.3 | 97.3 | 73.4 | 8.2 | 7.0 | 13.9 | 11.1 | 10.6 |
| FSM | 14.9 | 17.2 | 19 | 1.7 | 24.4 | 4.7 | 3.7 | 8.6 | 7.9 | 5.4 |
| Unknown | 3 | 2 | 1.6 | 1 | 2.2 | 8.6 | 9.4 | 15.1 | 13.7 | 9.5 |
Table and figure C2.5. Proportions of learners and top grades achieved each year for breakdowns by gender – Level 1/2, Technical Award qualifications
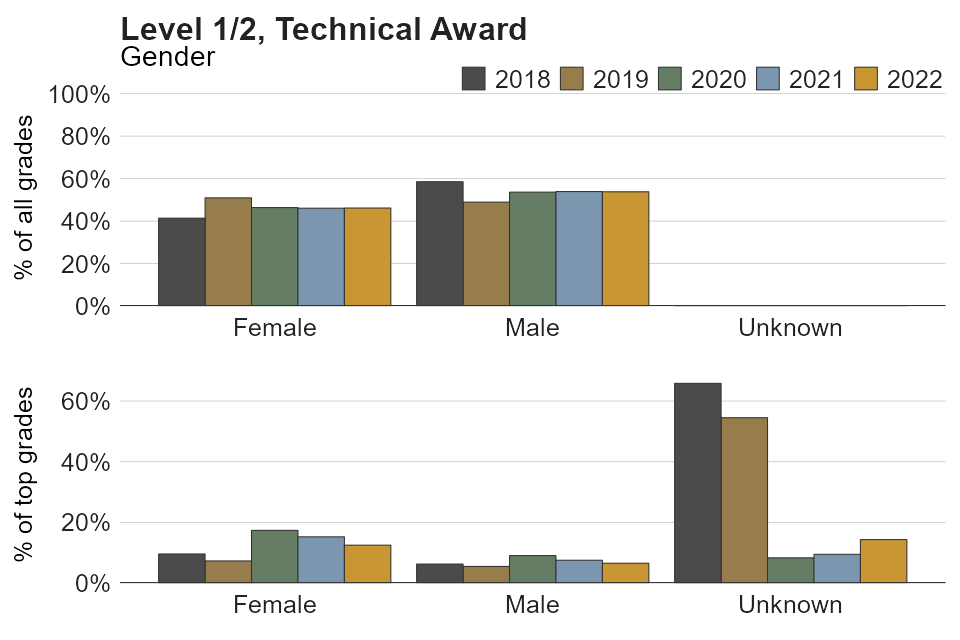
| Category | Percentage of awards in 2018 | Percentage of awards in 2019 | Percentage of awards in 2020 | Percentage of awards in 2021 | Percentage of awards in 2022 | Percentage of top grades awarded in 2018 | Percentage of top grades awarded in 2019 | Percentage of top grades awarded in 2020 | Percentage of top grades awarded in 2021 | Percentage of top grades awarded in 2022 |
|---|---|---|---|---|---|---|---|---|---|---|
| Female | 41.4 | 50.9 | 46.4 | 46.1 | 46.1 | 9.6 | 7.3 | 17.4 | 15.3 | 12.5 |
| Male | 58.5 | 48.9 | 53.6 | 53.9 | 53.8 | 6.3 | 5.5 | 9.1 | 7.5 | 6.5 |
| Unknown | <1 | <1 | <1 | <1 | <1 | 65.8 | 54.5 | 8.3 | 9.5 | 14.3 |
Table and figure C2.6. Proportions of learners and top grades achieved each year for breakdowns by IDACI – Level 1/2, Technical Award qualifications
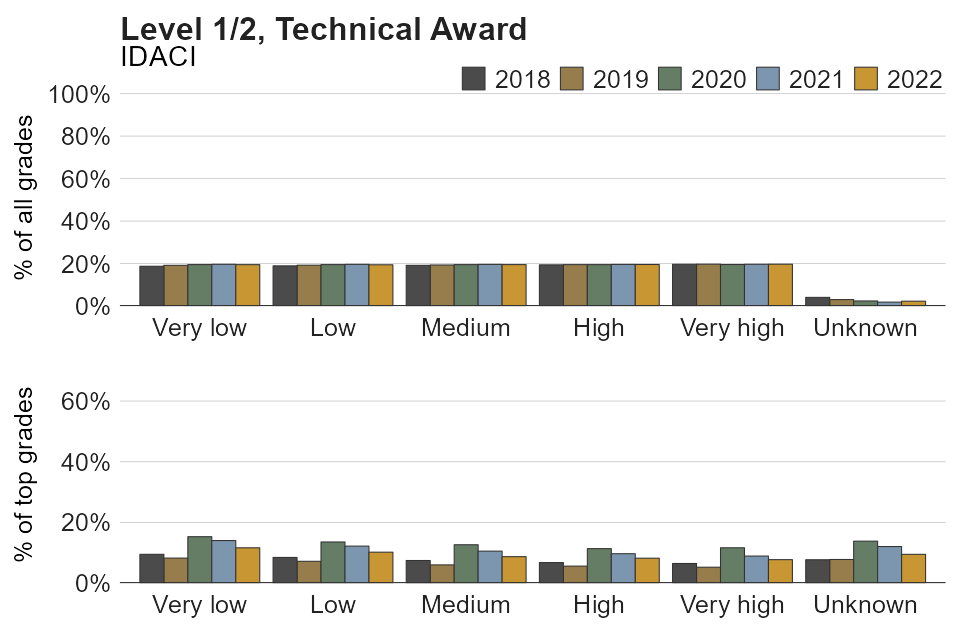
| Category | Percentage of awards in 2018 | Percentage of awards in 2019 | Percentage of awards in 2020 | Percentage of awards in 2021 | Percentage of awards in 2022 | Percentage of top grades awarded in 2018 | Percentage of top grades awarded in 2019 | Percentage of top grades awarded in 2020 | Percentage of top grades awarded in 2021 | Percentage of top grades awarded in 2022 |
|---|---|---|---|---|---|---|---|---|---|---|
| Very low | 18.7 | 19.2 | 19.5 | 19.7 | 19.5 | 9.5 | 8.3 | 15.3 | 14.0 | 11.6 |
| Low | 18.9 | 19.2 | 19.5 | 19.6 | 19.4 | 8.5 | 7.2 | 13.6 | 12.2 | 10.2 |
| Medium | 19.2 | 19.3 | 19.5 | 19.6 | 19.5 | 7.5 | 6.0 | 12.6 | 10.5 | 8.7 |
| High | 19.4 | 19.5 | 19.5 | 19.6 | 19.6 | 6.8 | 5.6 | 11.4 | 9.7 | 8.2 |
| Very high | 19.7 | 19.7 | 19.5 | 19.7 | 19.7 | 6.5 | 5.2 | 11.6 | 8.9 | 7.7 |
| Unknown | 4.1 | 3 | 2.4 | 1.9 | 2.3 | 7.7 | 7.8 | 13.8 | 12.0 | 9.5 |
Table and figure C2.7. Proportions of learners and top grades achieved each year for breakdowns by prior attainment – Level 1/2, Technical Award qualifications
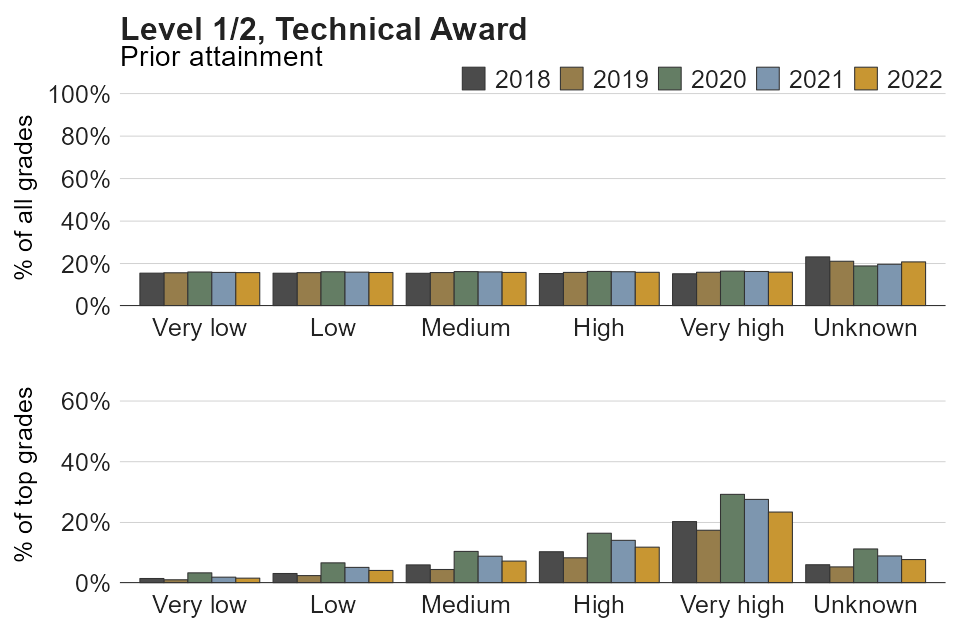
| Category | Percentage of awards in 2018 | Percentage of awards in 2019 | Percentage of awards in 2020 | Percentage of awards in 2021 | Percentage of awards in 2022 | Percentage of top grades awarded in 2018 | Percentage of top grades awarded in 2019 | Percentage of top grades awarded in 2020 | Percentage of top grades awarded in 2021 | Percentage of top grades awarded in 2022 |
|---|---|---|---|---|---|---|---|---|---|---|
| Very low | 15.5 | 15.7 | 16 | 15.8 | 15.7 | 1.5 | 1.1 | 3.4 | 2 | 1.6 |
| Low | 15.5 | 15.7 | 16.1 | 16 | 15.8 | 3.2 | 2.5 | 6.7 | 5.2 | 4.2 |
| Medium | 15.4 | 15.8 | 16.2 | 16.1 | 15.8 | 6 | 4.5 | 10.4 | 8.9 | 7.3 |
| High | 15.3 | 15.8 | 16.3 | 16.2 | 15.9 | 10.3 | 8.3 | 16.4 | 14.1 | 11.8 |
| Very high | 15.2 | 15.9 | 16.4 | 16.3 | 16 | 20.3 | 17.4 | 29.2 | 27.6 | 23.4 |
| Unknown | 23.1 | 21.1 | 18.9 | 19.7 | 20.8 | 6.1 | 5.3 | 11.3 | 9 | 7.8 |
Table and figure C2.8. Proportions of learners and top grades achieved each year for breakdowns by SEND status – Level 1/2, Technical Award qualifications

| Category | Percentage of awards in 2018 | Percentage of awards in 2019 | Percentage of awards in 2020 | Percentage of awards in 2021 | Percentage of awards in 2022 | Percentage of top grades awarded in 2018 | Percentage of top grades awarded in 2019 | Percentage of top grades awarded in 2020 | Percentage of top grades awarded in 2021 | Percentage of top grades awarded in 2022 |
|---|---|---|---|---|---|---|---|---|---|---|
| No SEN | 80.6 | 82.2 | 82.1 | 82.1 | 81.6 | 8.7 | 7.2 | 14.4 | 12.5 | 10.5 |
| SEN | 15.3 | 14.7 | 15.6 | 16.1 | 16.2 | 2.7 | 2.1 | 5.0 | 3.7 | 3.4 |
| Unknown | 4.2 | 3.1 | 2.3 | 1.8 | 2.2 | 7.8 | 8.3 | 14.1 | 12.1 | 9.5 |
Table and figure C2.9. Proportions of learners and top grades achieved each year for breakdowns by ethnicity – Level 1/2, Technical Certificates qualifications
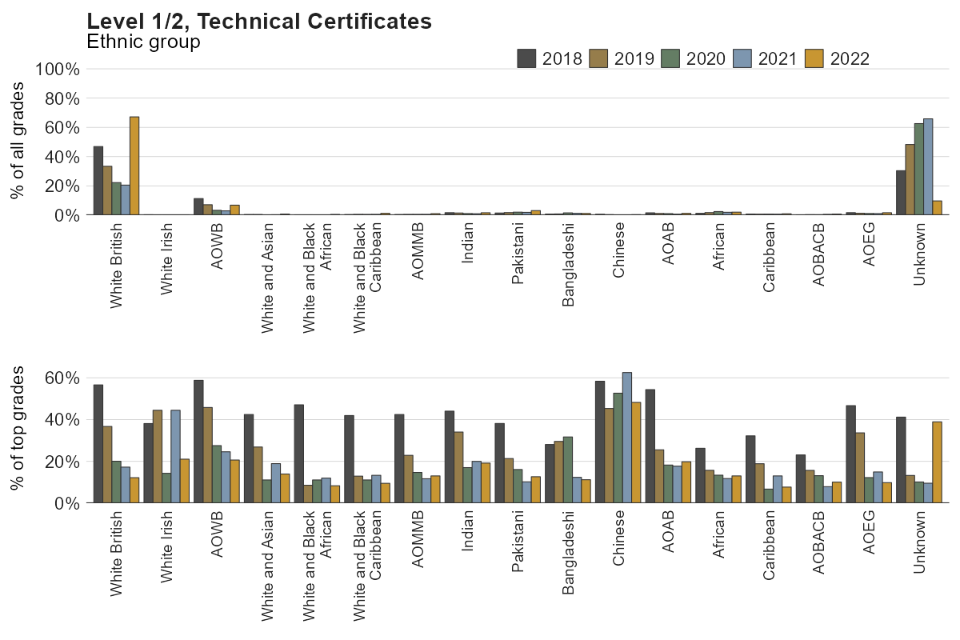
| Category | Percentage of awards in 2018 | Percentage of awards in 2019 | Percentage of awards in 2020 | Percentage of awards in 2021 | Percentage of awards in 2022 | Percentage of top grades awarded in 2018 | Percentage of top grades awarded in 2019 | Percentage of top grades awarded in 2020 | Percentage of top grades awarded in 2021 | Percentage of top grades awarded in 2022 |
|---|---|---|---|---|---|---|---|---|---|---|
| White British | 46.9 | 33.4 | 22.2 | 20.5 | 67.2 | 56.6 | 36.7 | 20.1 | 17.2 | 12.2 |
| White Irish | <1 | <1 | <1 | <1 | <1 | 38.1 | 44.4 | 14.3 | 44.4 | 21.1 |
| Any other White background (AOWB) | 11.3 | 7.1 | 3.3 | 2.9 | 6.8 | 58.8 | 45.8 | 27.5 | 24.6 | 20.6 |
| White and Asian | <1 | <1 | <1 | <1 | <1 | 42.4 | 26.9 | 11.1 | 18.9 | 14.0 |
| White and Black African | <1 | <1 | <1 | <1 | <1 | 47.1 | 8.6 | 11.1 | 12.0 | 8.3 |
| White and Black Caribbean | <1 | <1 | <1 | <1 | 1.2 | 41.9 | 12.9 | 11.1 | 13.3 | 9.5 |
| Any other Mixed or Multiple background (AOMMB) | <1 | <1 | <1 | <1 | 1 | 42.4 | 22.9 | 14.7 | 11.7 | 13.0 |
| Indian | 1.7 | 1.5 | 1.1 | 1 | 1.6 | 44.0 | 34.0 | 17.0 | 20.0 | 19.2 |
| Pakistani | 1.5 | 1.7 | 2 | 1.9 | 3.1 | 38.1 | 21.4 | 16.1 | 10.2 | 12.7 |
| Bangladeshi | <1 | <1 | 1.5 | 1.2 | 1.1 | 28.1 | 29.5 | 31.7 | 12.4 | 11.2 |
| Chinese | <1 | <1 | <1 | <1 | <1 | 58.3 | 45.3 | 52.6 | 62.5 | 48.2 |
| Any other Asian background (AOAB) | 1.6 | 1.2 | 1 | <1 | 1.2 | 54.3 | 25.5 | 18.2 | 17.7 | 19.8 |
| African | 1.2 | 1.7 | 2.4 | 1.9 | 2 | 26.3 | 15.7 | 13.4 | 11.8 | 13.0 |
| Caribbean | <1 | <1 | <1 | <1 | <1 | 32.2 | 18.9 | 6.7 | 13.0 | 7.7 |
| Any other Black, African or Caribbean background (AOBACB) | <1 | <1 | <1 | <1 | <1 | 23.1 | 15.7 | 13.2 | 7.9 | 10.1 |
| Any other ethnic group (AOEG) | 1.7 | 1.3 | 1.1 | 1.1 | 1.6 | 46.7 | 33.6 | 12.2 | 14.9 | 9.8 |
| Unknown | 30.4 | 48.3 | 62.6 | 65.8 | 9.7 | 41.2 | 13.3 | 10.2 | 9.6 | 38.9 |
Table and figure C2.10. Proportions of learners and top grades achieved each year for breakdowns by FSM – Level 1/2, Technical Certificates qualifications
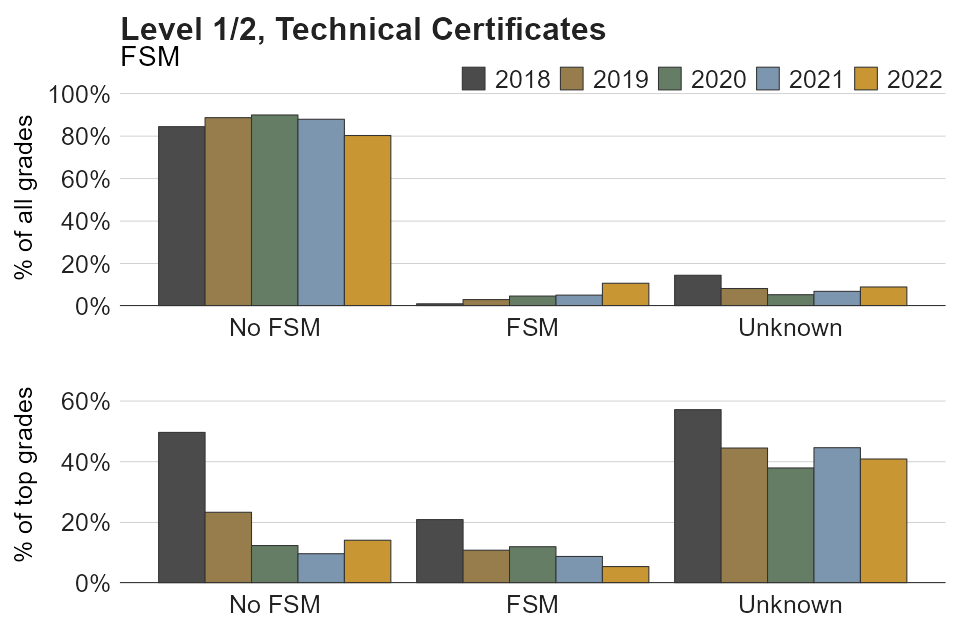
| Category | Percentage of awards in 2018 | Percentage of awards in 2019 | Percentage of awards in 2020 | Percentage of awards in 2021 | Percentage of awards in 2022 | Percentage of top grades awarded in 2018 | Percentage of top grades awarded in 2019 | Percentage of top grades awarded in 2020 | Percentage of top grades awarded in 2021 | Percentage of top grades awarded in 2022 |
|---|---|---|---|---|---|---|---|---|---|---|
| No FSM | 84.4 | 88.7 | 89.9 | 87.9 | 80.3 | 49.7 | 23.3 | 12.4 | 9.7 | 14.1 |
| FSM | 1.1 | 3.1 | 4.7 | 5.1 | 10.7 | 20.9 | 10.8 | 12 | 8.8 | 5.5 |
| Unknown | 14.5 | 8.3 | 5.3 | 6.9 | 9 | 57.2 | 44.5 | 37.9 | 44.6 | 40.9 |
Table and figure C2.11. Proportions of learners and top grades achieved each year for breakdowns by gender – Level 1/2, Technical Certificates qualifications
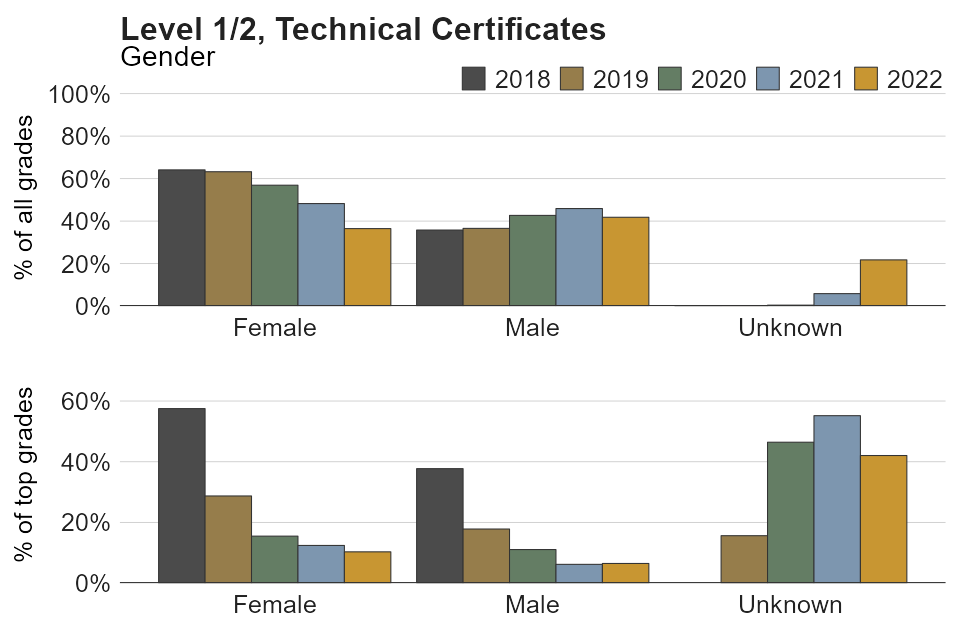
| Category | Percentage of awards in 2018 | Percentage of awards in 2019 | Percentage of awards in 2020 | Percentage of awards in 2021 | Percentage of awards in 2022 | Percentage of top grades awarded in 2018 | Percentage of top grades awarded in 2019 | Percentage of top grades awarded in 2020 | Percentage of top grades awarded in 2021 | Percentage of top grades awarded in 2022 |
|---|---|---|---|---|---|---|---|---|---|---|
| Female | 64.1 | 63.2 | 56.9 | 48.2 | 36.5 | 57.5 | 28.7 | 15.5 | 12.4 | 10.3 |
| Male | 35.8 | 36.6 | 42.7 | 45.9 | 41.8 | 37.7 | 17.8 | 11.1 | 6.2 | 6.5 |
| Unknown | <1 | <1 | <1 | 5.9 | 21.7 | 77.8 | 15.6 | 46.4 | 55.2 | 42.0 |
Table and figure C2.12. Proportions of learners and top grades achieved each year for breakdowns by IDACI – Level 1/2, Technical Certificates qualifications
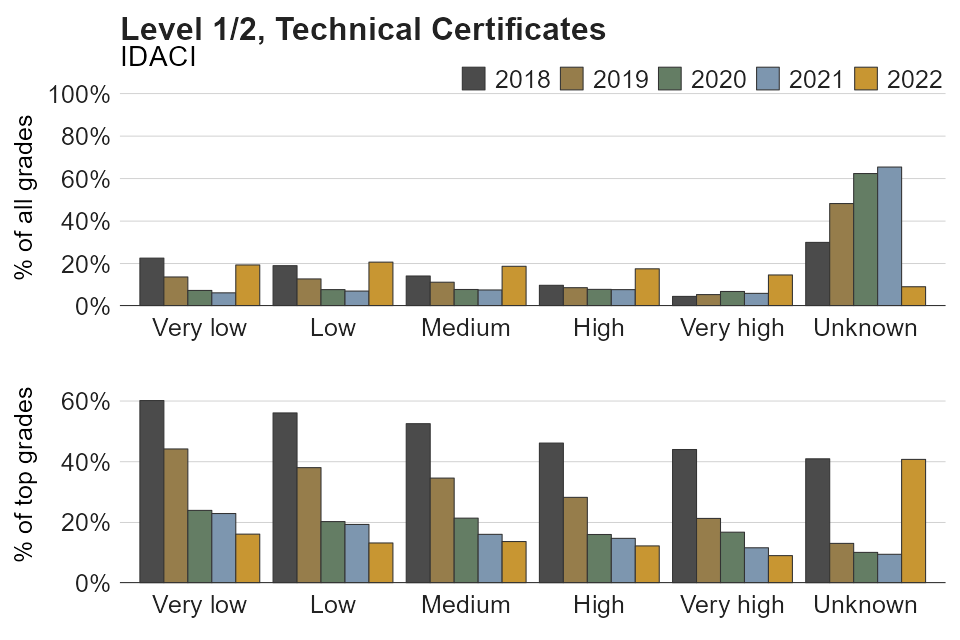
| Category | Percentage of awards in 2018 | Percentage of awards in 2019 | Percentage of awards in 2020 | Percentage of awards in 2021 | Percentage of awards in 2022 | Percentage of top grades awarded in 2018 | Percentage of top grades awarded in 2019 | Percentage of top grades awarded in 2020 | Percentage of top grades awarded in 2021 | Percentage of top grades awarded in 2022 |
|---|---|---|---|---|---|---|---|---|---|---|
| Very low | 22.6 | 13.7 | 7.4 | 6.2 | 19.3 | 60.2 | 44.2 | 24 | 22.9 | 16.1 |
| Low | 19 | 12.8 | 7.7 | 7.1 | 20.7 | 56.1 | 38.1 | 20.3 | 19.3 | 13.2 |
| Medium | 14.2 | 11.2 | 7.8 | 7.6 | 18.7 | 52.5 | 34.6 | 21.4 | 16.1 | 13.7 |
| High | 9.8 | 8.7 | 7.9 | 7.7 | 17.5 | 46.1 | 28.3 | 16 | 14.7 | 12.3 |
| Very high | 4.5 | 5.4 | 6.9 | 6 | 14.6 | 44 | 21.3 | 16.8 | 11.6 | 9.1 |
| Unknown | 30 | 48.3 | 62.4 | 65.4 | 9.1 | 41 | 13.1 | 10.1 | 9.5 | 40.8 |
Table and figure C2.13. Proportions of learners and top grades achieved each year for breakdowns by prior attainment – Level 1/2, Technical Certificates qualifications

| Category | Percentage of awards in 2018 | Percentage of awards in 2019 | Percentage of awards in 2020 | Percentage of awards in 2021 | Percentage of awards in 2022 | Percentage of top grades awarded in 2018 | Percentage of top grades awarded in 2019 | Percentage of top grades awarded in 2020 | Percentage of top grades awarded in 2021 | Percentage of top grades awarded in 2022 |
|---|---|---|---|---|---|---|---|---|---|---|
| Very low | 2 | 10.6 | 17.2 | 19.1 | 8.3 | 9.4 | 4.9 | 7.0 | 4.5 | 4.7 |
| Low | 2.6 | 9.6 | 14.2 | 15.5 | 7.2 | 11.4 | 5.0 | 7.9 | 5.0 | 3.8 |
| Medium | 3.2 | 9.1 | 12 | 12.1 | 6.5 | 25.6 | 6.7 | 9.7 | 7.0 | 4.5 |
| High | 5.3 | 8.1 | 9.7 | 9.9 | 5.1 | 29.6 | 11.8 | 10.8 | 8.0 | 6.2 |
| Very high | 7.6 | 6.9 | 6.3 | 6.6 | 3.5 | 45.5 | 26.9 | 19.0 | 16.8 | 9.7 |
| Unknown | 79.3 | 55.7 | 40.7 | 36.8 | 69.4 | 55.6 | 36.4 | 19.7 | 20.8 | 20.2 |
Table and figure C2.14. Proportions of learners and top grades achieved each year for breakdowns by SEND status – Level 1/2, Technical Certificates qualifications
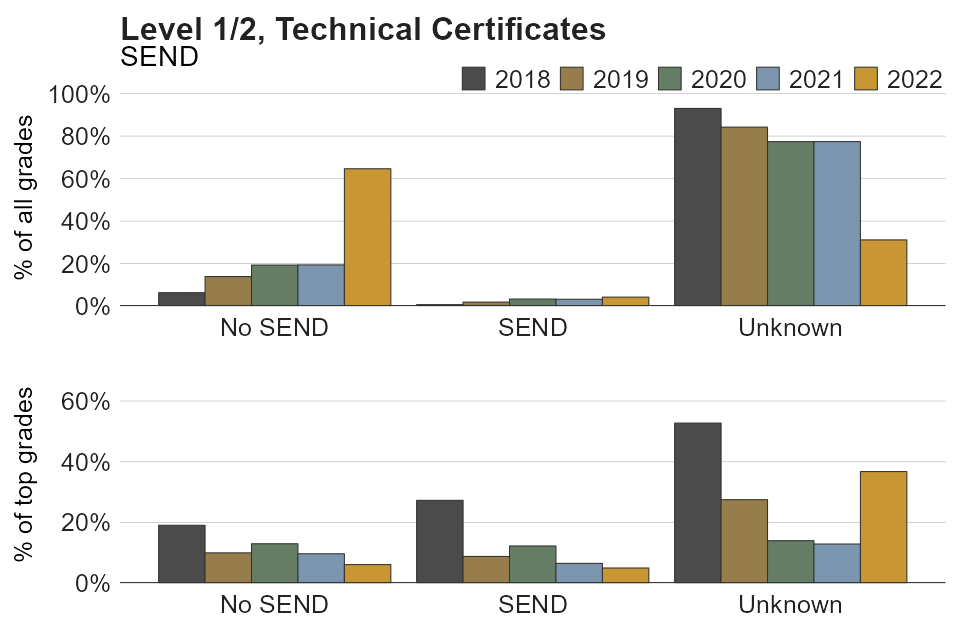
| Category | Percentage of awards in 2018 | Percentage of awards in 2019 | Percentage of awards in 2020 | Percentage of awards in 2021 | Percentage of awards in 2022 | Percentage of top grades awarded in 2018 | Percentage of top grades awarded in 2019 | Percentage of top grades awarded in 2020 | Percentage of top grades awarded in 2021 | Percentage of top grades awarded in 2022 |
|---|---|---|---|---|---|---|---|---|---|---|
| No SEN | 6.3 | 13.9 | 19.3 | 19.4 | 64.6 | 19.1 | 10.0 | 13.0 | 9.7 | 6.1 |
| SEN | <1 | 1.9 | 3.3 | 3.2 | 4.2 | 27.3 | 8.8 | 12.2 | 6.5 | 5.0 |
| Unknown | 93 | 84.2 | 77.4 | 77.4 | 31.1 | 52.7 | 27.5 | 14.0 | 12.9 | 36.8 |
Table and figure C2.15. Proportions of learners and top grades achieved each year for breakdowns by ethnicity – Level 3, Applied General qualifications
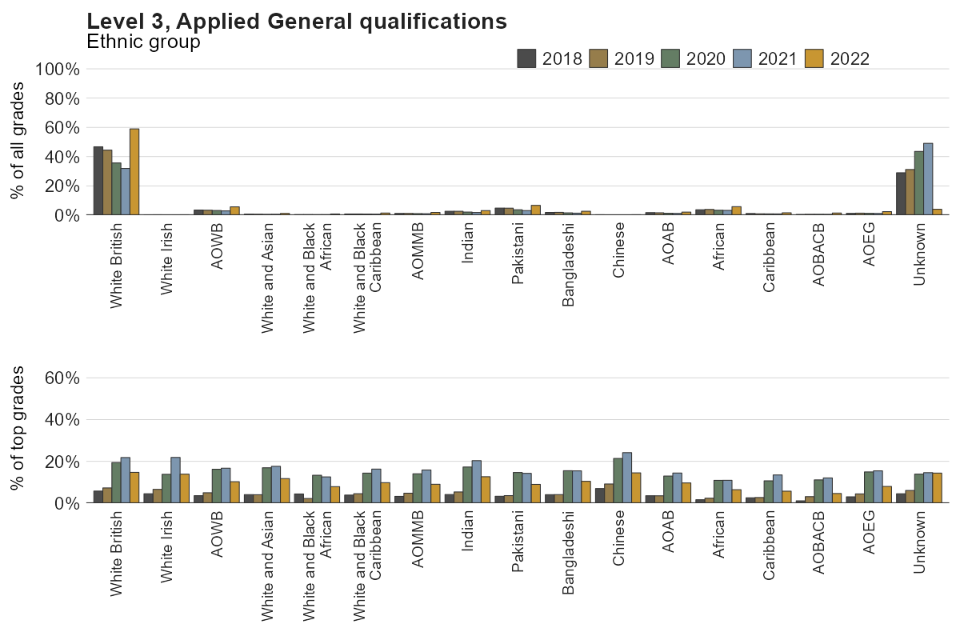
| Category | Percentage of awards in 2018 | Percentage of awards in 2019 | Percentage of awards in 2020 | Percentage of awards in 2021 | Percentage of awards in 2022 | Percentage of top grades awarded in 2018 | Percentage of top grades awarded in 2019 | Percentage of top grades awarded in 2020 | Percentage of top grades awarded in 2021 | Percentage of top grades awarded in 2022 |
|---|---|---|---|---|---|---|---|---|---|---|
| White British | 46.7 | 44.4 | 35.7 | 31.9 | 58.9 | 5.8 | 7.3 | 19.4 | 21.8 | 14.7 |
| White Irish | <1 | <1 | <1 | <1 | <1 | 4.5 | 6.6 | 13.8 | 21.9 | 13.9 |
| Any other White background (AOWB) | 3.5 | 3.4 | 3.2 | 2.9 | 5.7 | 3.6 | 5 | 16.2 | 16.7 | 10.3 |
| White and Asian | <1 | <1 | <1 | <1 | 1.2 | 4.1 | 4 | 16.9 | 17.6 | 11.8 |
| White and Black African | <1 | <1 | <1 | <1 | <1 | 4.4 | 2.2 | 13.4 | 12.6 | 7.9 |
| White and Black Caribbean | <1 | <1 | <1 | <1 | 1.4 | 3.9 | 4.5 | 14.4 | 16.3 | 9.8 |
| Any other Mixed or Multiple background (AOMMB) | 1.2 | 1.2 | 1.1 | 1 | 1.8 | 3.3 | 4.8 | 14.1 | 15.9 | 9 |
| Indian | 2.6 | 2.6 | 2.1 | 1.8 | 3.1 | 4.1 | 5.4 | 17.3 | 20.3 | 12.7 |
| Pakistani | 4.8 | 4.8 | 3.7 | 3.1 | 6.7 | 3.3 | 3.6 | 14.7 | 14.3 | 9 |
| Bangladeshi | 1.8 | 1.9 | 1.5 | 1.4 | 2.6 | 4.1 | 4.1 | 15.5 | 15.5 | 10.5 |
| Chinese | <1 | <1 | <1 | <1 | <1 | 7 | 9.2 | 21.4 | 24.2 | 14.5 |
| Any other Asian background (AOAB) | 1.7 | 1.6 | 1.3 | 1.2 | 2.1 | 3.5 | 3.5 | 13 | 14.4 | 9.7 |
| African | 3.7 | 3.9 | 3.3 | 3.2 | 5.8 | 1.6 | 2.4 | 10.9 | 10.9 | 6.5 |
| Caribbean | 1.1 | <1 | <1 | <1 | 1.6 | 2.6 | 2.7 | 10.7 | 13.5 | 5.7 |
| Any other Black, African or Caribbean background (AOBACB) | <1 | <1 | <1 | <1 | 1.4 | 1.1 | 3.1 | 11.1 | 12.1 | 4.6 |
| Any other ethnic group (AOEG) | 1.2 | 1.4 | 1.2 | 1.2 | 2.4 | 3 | 4.4 | 15 | 15.5 | 8 |
| Unknown | 29 | 31.2 | 43.5 | 49.1 | 4 | 4.5 | 6.1 | 13.9 | 14.6 | 14.4 |
Table and figure C2.16. Proportions of learners and top grades achieved each year for breakdowns by FSM – Level 3, Applied General qualifications
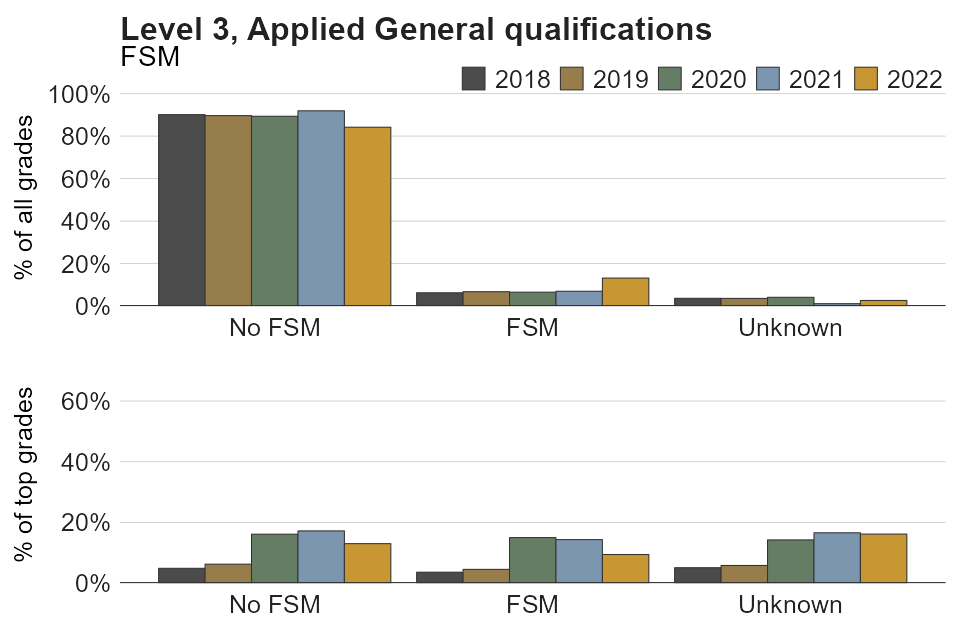
| Category | Percentage of awards in 2018 | Percentage of awards in 2019 | Percentage of awards in 2020 | Percentage of awards in 2021 | Percentage of awards in 2022 | Percentage of top grades awarded in 2018 | Percentage of top grades awarded in 2019 | Percentage of top grades awarded in 2020 | Percentage of top grades awarded in 2021 | Percentage of top grades awarded in 2022 |
|---|---|---|---|---|---|---|---|---|---|---|
| No FSM | 90.1 | 89.6 | 89.3 | 91.9 | 84.2 | 4.9 | 6.2 | 16.1 | 17.2 | 13 |
| FSM | 6.2 | 6.8 | 6.5 | 7 | 13.2 | 3.6 | 4.5 | 15 | 14.3 | 9.4 |
| Unknown | 3.7 | 3.6 | 4.1 | 1.1 | 2.6 | 5.1 | 5.8 | 14.2 | 16.6 | 16.2 |
Table and figure C2.17. Proportions of learners and top grades achieved each year for breakdowns by gender – Level 3, Applied General qualifications
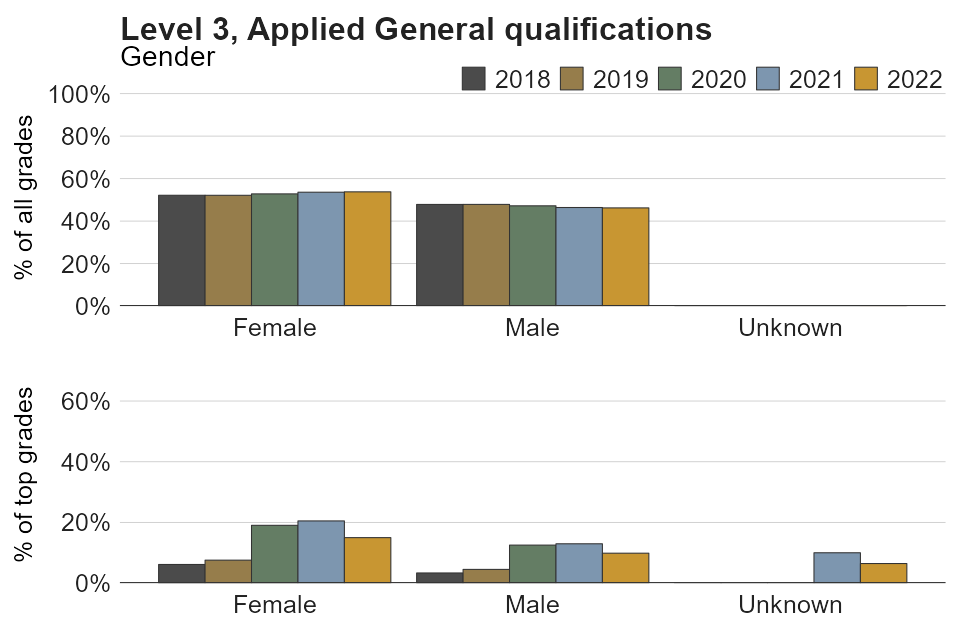
| Category | Percentage of awards in 2018 | Percentage of awards in 2019 | Percentage of awards in 2020 | Percentage of awards in 2021 | Percentage of awards in 2022 | Percentage of top grades awarded in 2018 | Percentage of top grades awarded in 2019 | Percentage of top grades awarded in 2020 | Percentage of top grades awarded in 2021 | Percentage of top grades awarded in 2022 |
|---|---|---|---|---|---|---|---|---|---|---|
| Female | 52.2 | 52.1 | 52.8 | 53.6 | 53.8 | 6.1 | 7.6 | 19 | 20.5 | 15 |
| Male | 47.8 | 47.9 | 47.2 | 46.4 | 46.2 | 3.3 | 4.5 | 12.5 | 13 | 9.9 |
| Unknown | <1 | <1 | <1 | <1 | <1 | 0 | 0 | 0 | 10 | 6.5 |
Table and figure C2.18. Proportions of learners and top grades achieved each year for breakdowns by IDACI – Level 3, Applied General qualifications
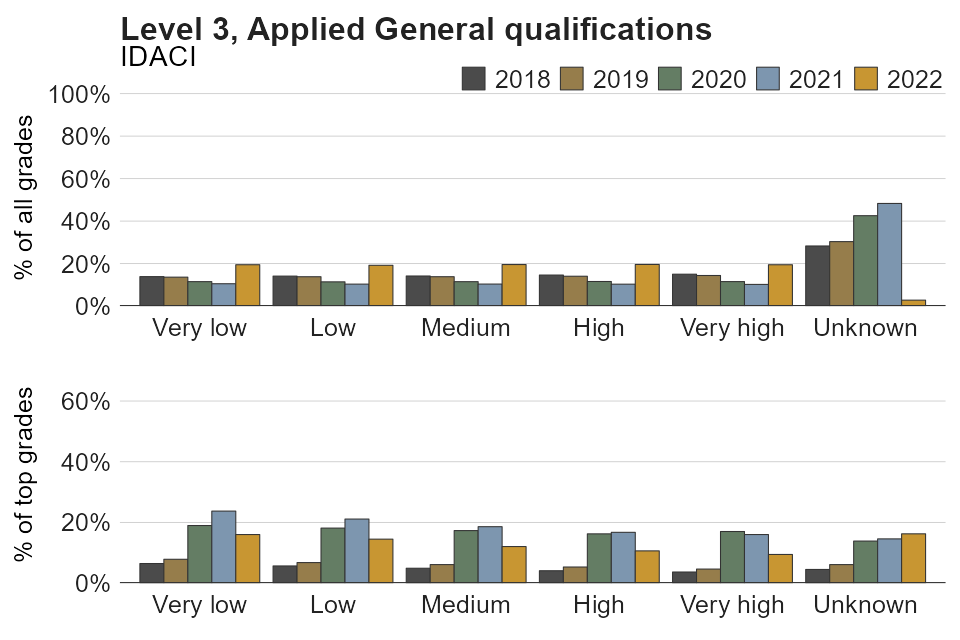
| Category | Percentage of awards in 2018 | Percentage of awards in 2019 | Percentage of awards in 2020 | Percentage of awards in 2021 | Percentage of awards in 2022 | Percentage of top grades awarded in 2018 | Percentage of top grades awarded in 2019 | Percentage of top grades awarded in 2020 | Percentage of top grades awarded in 2021 | Percentage of top grades awarded in 2022 |
|---|---|---|---|---|---|---|---|---|---|---|
| Very low | 13.9 | 13.6 | 11.5 | 10.5 | 19.5 | 6.5 | 7.9 | 19.0 | 23.7 | 16.0 |
| Low | 14.1 | 13.8 | 11.4 | 10.3 | 19.2 | 5.7 | 6.8 | 18.1 | 21.1 | 14.5 |
| Medium | 14.2 | 13.8 | 11.5 | 10.4 | 19.5 | 4.9 | 6.1 | 17.3 | 18.6 | 12.0 |
| High | 14.6 | 14 | 11.6 | 10.3 | 19.6 | 4.1 | 5.3 | 16.2 | 16.7 | 10.6 |
| Very high | 15 | 14.4 | 11.5 | 10.2 | 19.4 | 3.7 | 4.6 | 17.0 | 16.0 | 9.4 |
| Unknown | 28.3 | 30.3 | 42.5 | 48.3 | 2.8 | 4.5 | 6.1 | 13.9 | 14.6 | 16.2 |
Table and figure C2.19. Proportions of learners and top grades achieved each year for breakdowns by prior attainment – Level 3, Applied General qualifications
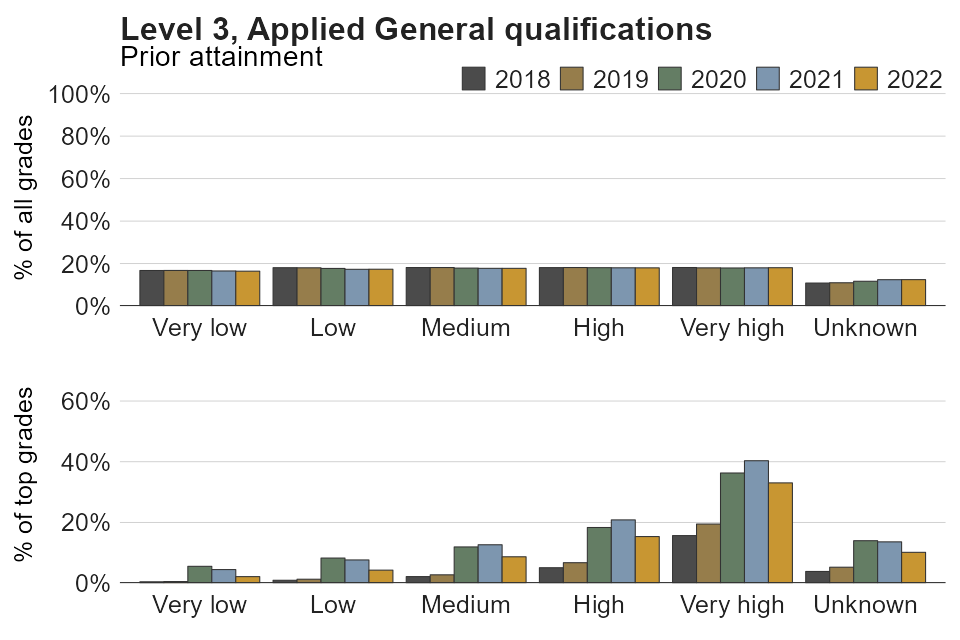
| Category | Percentage of awards in 2018 | Percentage of awards in 2019 | Percentage of awards in 2020 | Percentage of awards in 2021 | Percentage of awards in 2022 | Percentage of top grades awarded in 2018 | Percentage of top grades awarded in 2019 | Percentage of top grades awarded in 2020 | Percentage of top grades awarded in 2021 | Percentage of top grades awarded in 2022 |
|---|---|---|---|---|---|---|---|---|---|---|
| Very low | 16.7 | 16.8 | 16.8 | 16.5 | 16.4 | 0.4 | 0.5 | 5.5 | 4.5 | 2.1 |
| Low | 18.1 | 18 | 17.7 | 17.3 | 17.3 | 0.9 | 1.3 | 8.3 | 7.6 | 4.3 |
| Medium | 18.1 | 18.1 | 17.9 | 17.8 | 17.8 | 2.1 | 2.7 | 11.9 | 12.6 | 8.7 |
| High | 18.1 | 18.1 | 18.1 | 18 | 18 | 5.1 | 6.7 | 18.3 | 20.8 | 15.3 |
| Very high | 18.1 | 18 | 17.9 | 18 | 18.1 | 15.7 | 19.5 | 36.3 | 40.3 | 33 |
| Unknown | 10.8 | 11 | 11.7 | 12.4 | 12.4 | 3.8 | 5.2 | 14 | 13.6 | 10.1 |
Table and figure C2.20. Proportions of learners and top grades achieved each year for breakdowns by SEND status – Level 3, Applied General qualifications
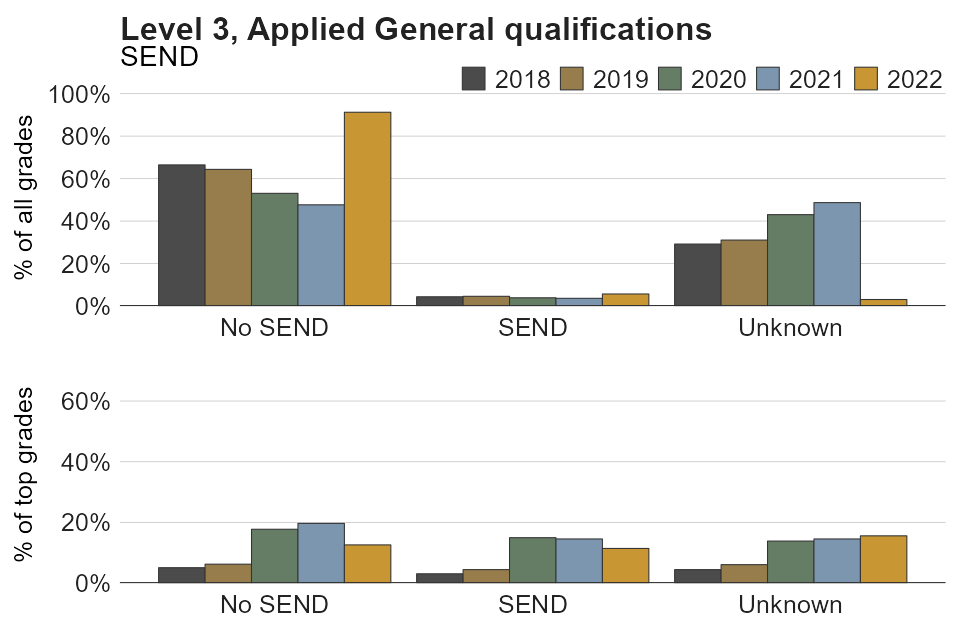
| Category | Percentage of awards in 2018 | Percentage of awards in 2019 | Percentage of awards in 2020 | Percentage of awards in 2021 | Percentage of awards in 2022 | Percentage of top grades awarded in 2018 | Percentage of top grades awarded in 2019 | Percentage of top grades awarded in 2020 | Percentage of top grades awarded in 2021 | Percentage of top grades awarded in 2022 |
|---|---|---|---|---|---|---|---|---|---|---|
| No SEN | 66.4 | 64.3 | 53.1 | 47.7 | 91.2 | 5.1 | 6.2 | 17.8 | 19.7 | 12.6 |
| SEN | 4.4 | 4.6 | 3.9 | 3.6 | 5.7 | 3.1 | 4.4 | 15.0 | 14.6 | 11.4 |
| Unknown | 29.2 | 31.1 | 43 | 48.7 | 3.1 | 4.4 | 6.1 | 13.9 | 14.6 | 15.6 |
Table and figure C2.21. Proportions of learners and top grades achieved each year for breakdowns by ethnicity status – Level 3, Tech Levels qualifications
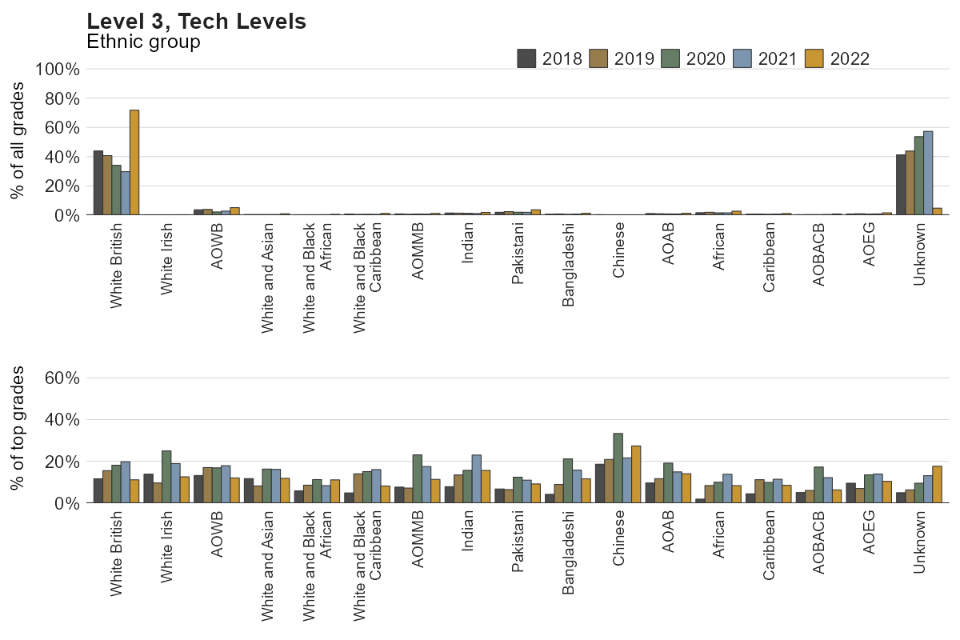
| Category | Percentage of awards in 2018 | Percentage of awards in 2019 | Percentage of awards in 2020 | Percentage of awards in 2021 | Percentage of awards in 2022 | Percentage of top grades awarded in 2018 | Percentage of top grades awarded in 2019 | Percentage of top grades awarded in 2020 | Percentage of top grades awarded in 2021 | Percentage of top grades awarded in 2022 |
|---|---|---|---|---|---|---|---|---|---|---|
| White British | 43.9 | 40.7 | 34 | 29.7 | 71.7 | 11.7 | 15.6 | 18.2 | 19.8 | 11.2 |
| White Irish | <1 | <1 | <1 | <1 | <1 | 13.9 | 9.7 | 25 | 19 | 12.6 |
| Any other White background (AOWB) | 3.7 | 3.9 | 2.2 | 2.7 | 5.1 | 13.2 | 17 | 16.9 | 17.9 | 12.1 |
| White and Asian | <1 | <1 | <1 | <1 | <1 | 11.8 | 8.2 | 16.3 | 16.2 | 11.9 |
| White and Black African | <1 | <1 | <1 | <1 | <1 | 5.9 | 8.6 | 11.3 | 8.4 | 11.2 |
| White and Black Caribbean | <1 | <1 | <1 | <1 | 1.2 | 4.9 | 14 | 15.1 | 16.1 | 8.2 |
| Any other Mixed or Multiple background (AOMMB) | <1 | <1 | <1 | <1 | 1.2 | 7.7 | 7.2 | 23.1 | 17.5 | 11.4 |
| Indian | 1.5 | 1.4 | 1.3 | 1.1 | 1.8 | 7.9 | 13.5 | 15.7 | 23 | 15.7 |
| Pakistani | 2 | 2.4 | 2 | 1.9 | 3.7 | 6.8 | 6.5 | 12.4 | 11 | 9.2 |
| Bangladeshi | <1 | <1 | <1 | <1 | 1.3 | 4.2 | 8.9 | 21.2 | 15.8 | 11.7 |
| Chinese | <1 | <1 | <1 | <1 | <1 | 18.6 | 20.9 | 33.3 | 21.7 | 27.4 |
| Any other Asian background (AOAB) | 1.1 | 1 | <1 | <1 | 1.3 | 9.7 | 11.7 | 19.2 | 15 | 14.1 |
| African | 1.7 | 1.9 | 1.6 | 1.6 | 2.7 | 1.9 | 8.4 | 10 | 13.8 | 8.4 |
| Caribbean | <1 | <1 | <1 | <1 | 1.1 | 4.5 | 11.2 | 9.9 | 11.4 | 8.6 |
| Any other Black, African or Caribbean background (AOBACB) | <1 | <1 | <1 | <1 | <1 | 5.1 | 6.1 | 17.3 | 12.2 | 6.3 |
| Any other ethnic group (AOEG) | <1 | 1 | <1 | <1 | 1.6 | 9.6 | 7 | 13.5 | 14 | 10.5 |
| Unknown | 41.2 | 43.8 | 53.6 | 57.3 | 4.8 | 5 | 6.4 | 9.6 | 13.1 | 17.7 |
Table and figure C2.22. Proportions of learners and top grades achieved each year for breakdowns by FSM – Level 3, Tech Levels qualifications
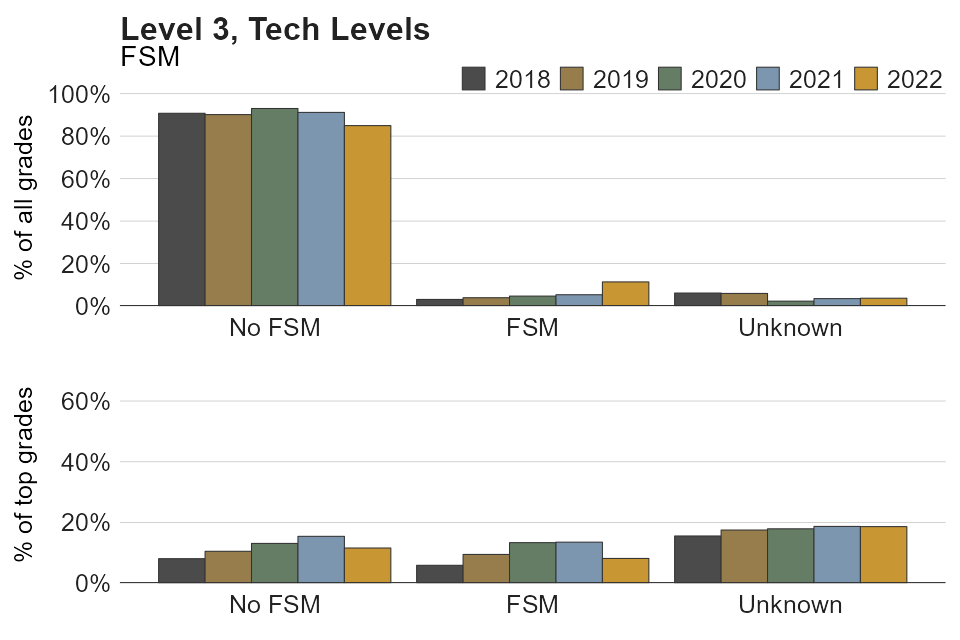
| Category | Percentage of awards in 2018 | Percentage of awards in 2019 | Percentage of awards in 2020 | Percentage of awards in 2021 | Percentage of awards in 2022 | Percentage of top grades awarded in 2018 | Percentage of top grades awarded in 2019 | Percentage of top grades awarded in 2020 | Percentage of top grades awarded in 2021 | Percentage of top grades awarded in 2022 |
|---|---|---|---|---|---|---|---|---|---|---|
| No FSM | 90.7 | 90.1 | 93 | 91.2 | 84.9 | 8.1 | 10.5 | 13.1 | 15.4 | 11.6 |
| FSM | 3.1 | 3.9 | 4.7 | 5.3 | 11.4 | 5.9 | 9.5 | 13.3 | 13.5 | 8.1 |
| Unknown | 6.1 | 5.9 | 2.3 | 3.5 | 3.7 | 15.5 | 17.5 | 17.9 | 18.7 | 18.6 |
Table and figure C2.23. Proportions of learners and top grades achieved each year for breakdowns by gender – Level 3, Tech Levels qualifications
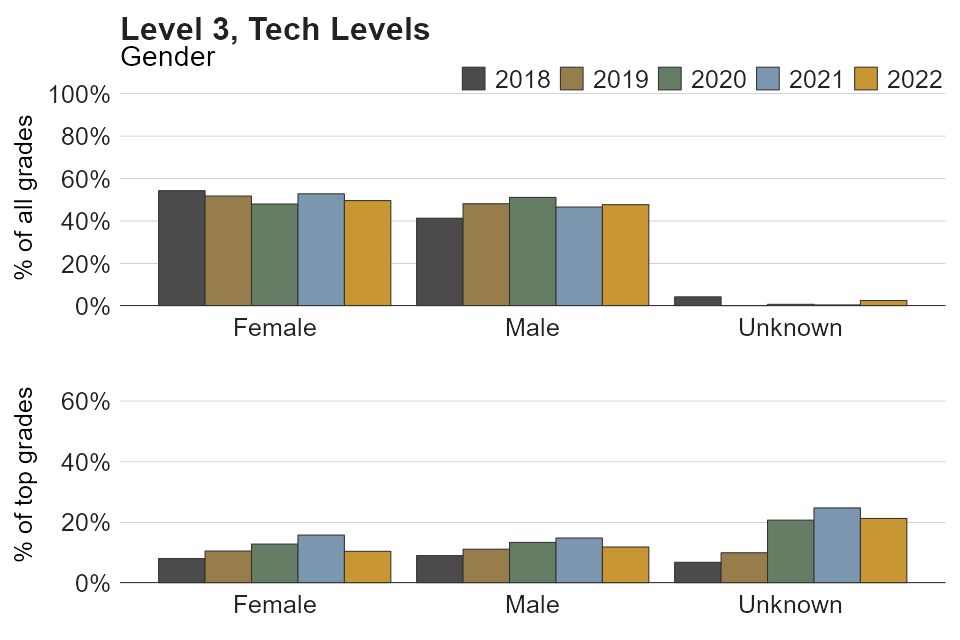
| Category | Percentage of awards in 2018 | Percentage of awards in 2019 | Percentage of awards in 2020 | Percentage of awards in 2021 | Percentage of awards in 2022 | Percentage of top grades awarded in 2018 | Percentage of top grades awarded in 2019 | Percentage of top grades awarded in 2020 | Percentage of top grades awarded in 2021 | Percentage of top grades awarded in 2022 |
|---|---|---|---|---|---|---|---|---|---|---|
| Female | 54.3 | 51.8 | 48 | 52.8 | 49.7 | 8.1 | 10.6 | 12.9 | 15.8 | 10.5 |
| Male | 41.4 | 48.2 | 51.1 | 46.6 | 47.7 | 9.1 | 11.2 | 13.4 | 14.9 | 11.9 |
| Unknown | 4.3 | <1 | <1 | <1 | 2.6 | 6.9 | 10 | 20.8 | 24.8 | 21.3 |
Table and figure C2.24. Proportions of learners and top grades achieved each year for breakdowns by IDACI – Level 3, Tech Levels qualifications
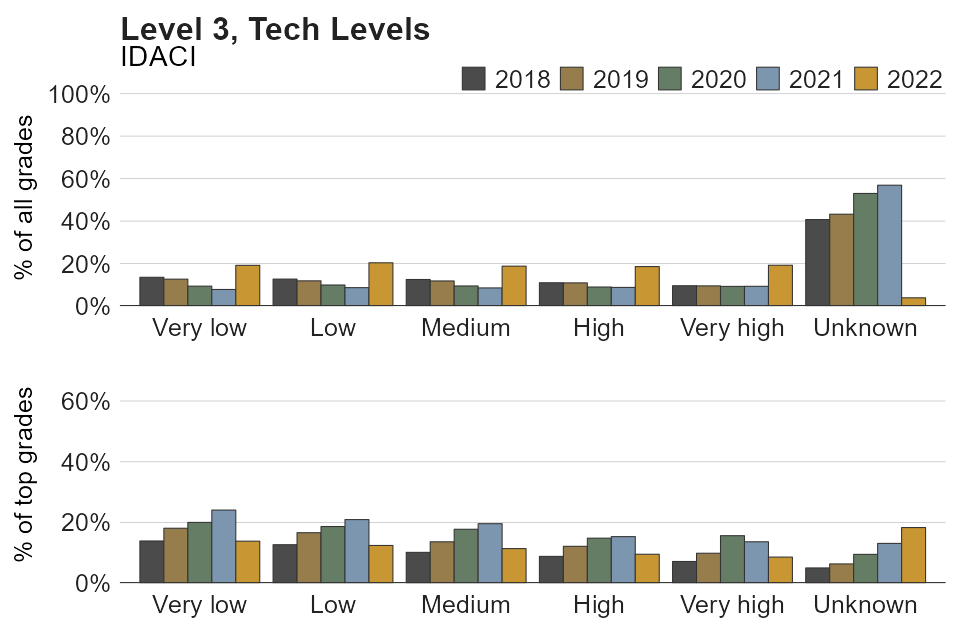
| Category | Percentage of awards in 2018 | Percentage of awards in 2019 | Percentage of awards in 2020 | Percentage of awards in 2021 | Percentage of awards in 2022 | Percentage of top grades awarded in 2018 | Percentage of top grades awarded in 2019 | Percentage of top grades awarded in 2020 | Percentage of top grades awarded in 2021 | Percentage of top grades awarded in 2022 |
|---|---|---|---|---|---|---|---|---|---|---|
| Very low | 13.5 | 12.7 | 9.4 | 7.8 | 19.2 | 13.9 | 18.1 | 20.0 | 24.1 | 13.8 |
| Low | 12.7 | 11.9 | 9.9 | 8.7 | 20.4 | 12.7 | 16.6 | 18.7 | 20.9 | 12.4 |
| Medium | 12.5 | 11.8 | 9.5 | 8.5 | 18.8 | 10.1 | 13.6 | 17.7 | 19.6 | 11.4 |
| High | 11 | 10.9 | 9 | 8.8 | 18.6 | 8.8 | 12.1 | 14.8 | 15.3 | 9.5 |
| Very high | 9.6 | 9.5 | 9.3 | 9.3 | 19.2 | 7.1 | 9.8 | 15.6 | 13.6 | 8.6 |
| Unknown | 40.7 | 43.2 | 53 | 56.9 | 3.9 | 5.0 | 6.3 | 9.5 | 13.1 | 18.3 |
Table and figure C2.25. Proportions of learners and top grades achieved each year for breakdowns by prior attainment – Level 3, Tech Levels qualifications
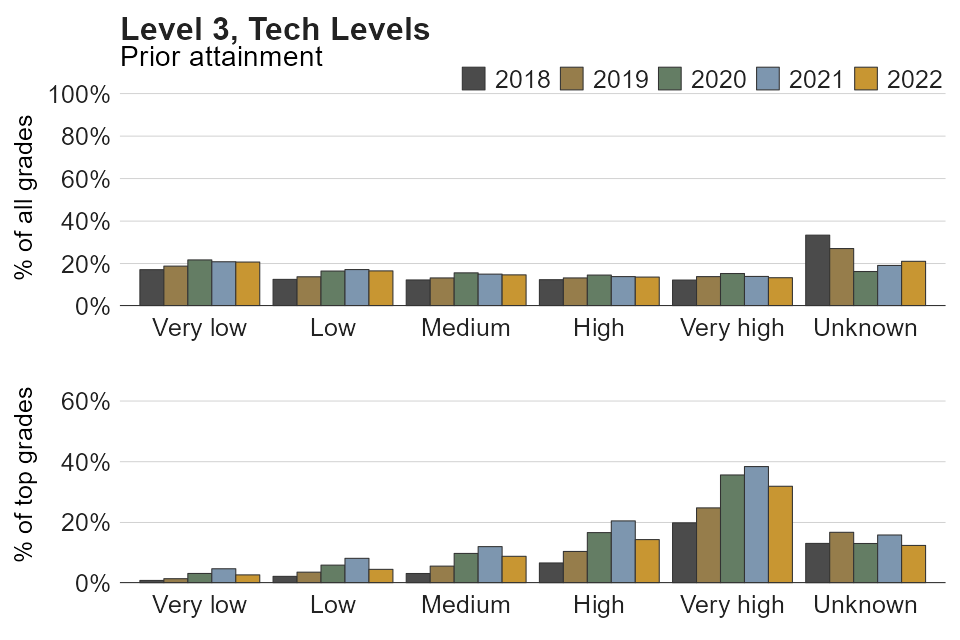
| Category | Percentage of awards in 2018 | Percentage of awards in 2019 | Percentage of awards in 2020 | Percentage of awards in 2021 | Percentage of awards in 2022 | Percentage of top grades awarded in 2018 | Percentage of top grades awarded in 2019 | Percentage of top grades awarded in 2020 | Percentage of top grades awarded in 2021 | Percentage of top grades awarded in 2022 |
|---|---|---|---|---|---|---|---|---|---|---|
| Very low | 17.1 | 18.8 | 21.7 | 20.9 | 20.7 | 0.9 | 1.5 | 3.2 | 4.7 | 2.7 |
| Low | 12.6 | 13.8 | 16.5 | 17.2 | 16.6 | 2.2 | 3.6 | 5.9 | 8.2 | 4.5 |
| Medium | 12.3 | 13.2 | 15.6 | 15 | 14.7 | 3.2 | 5.6 | 9.8 | 12 | 8.8 |
| High | 12.4 | 13.2 | 14.6 | 13.9 | 13.6 | 6.6 | 10.4 | 16.6 | 20.5 | 14.3 |
| Very high | 12.2 | 13.9 | 15.3 | 13.9 | 13.3 | 19.9 | 24.8 | 35.6 | 38.4 | 31.9 |
| Unknown | 33.4 | 27.1 | 16.3 | 19.1 | 21.1 | 13.1 | 16.7 | 13.1 | 15.9 | 12.4 |
Table and figure C2.26. Proportions of learners and top grades achieved each year for breakdowns by SEND status – Level 3, Tech Levels qualifications
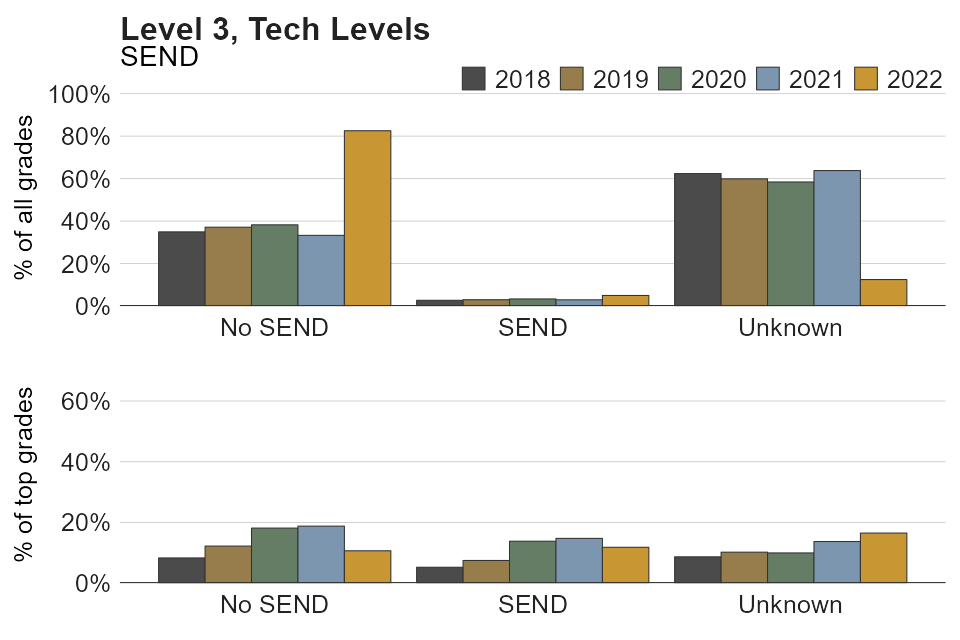
| Category | Percentage of awards in 2018 | Percentage of awards in 2019 | Percentage of awards in 2020 | Percentage of awards in 2021 | Percentage of awards in 2022 | Percentage of top grades awarded in 2018 | Percentage of top grades awarded in 2019 | Percentage of top grades awarded in 2020 | Percentage of top grades awarded in 2021 | Percentage of top grades awarded in 2022 |
|---|---|---|---|---|---|---|---|---|---|---|
| No SEN | 34.9 | 37.1 | 38.2 | 33.3 | 82.5 | 8.3 | 12.2 | 18.1 | 18.8 | 10.7 |
| SEN | 2.7 | 3 | 3.4 | 2.9 | 5 | 5.2 | 7.5 | 13.8 | 14.7 | 11.8 |
| Unknown | 62.4 | 59.9 | 58.4 | 63.8 | 12.5 | 8.7 | 10.2 | 9.9 | 13.7 | 16.5 |
Appendix D - Model specifications
Appendix D.1 - GQ Model Specification
All models fitted can be expressed mathematically as:
yijk = α + β xijk + ui + uj + eijk
where:
yijk = [in numeric grade analysis] numeric grade awarded for exam entry by candidate i in centre j in subject k; [in grade probability analysis] exam entry by candidate i in centre j in subject k being awarded the target grade or not (1 or 0);
xijk = a set of background variables about candidate i in centre j taking the exam entry in subject k;
ui = random intercept of candidate i;
uj = random intercept of centre j;
uj= random intercept of subject k;
eijk = entry level residual.
All analyses included student, centre and subject as random effects, to take account of students taking multiple subjects and students clustering within centres. The subject random effects had the following categories:
- A level: Art & Design: 3D Studies, Art & Design: Art, Craft and Design, Art & Design: Critical and Contextual Studies, Art & Design: Fine Art, Art & Design: Graphics, Art & Design: Photography, Art & Design: Textiles, Biology, Business Studies, Chemistry, Classical Greek, Computing, Dance, Drama & Theatre Studies, Economics, English Language, English Language & Literature, English Literature, French, Geography, German, History, Latin, Music, Physical Education, Physics, Psychology, Religious Studies, Sociology, Spanish
- GCSE: Art & Design: 3D Studies, Art & Design: Art, Craft and Design, Art & Design: Critical and Contextual Studies, Art & Design: Fine Art, Art & Design: Graphics, Art & Design: Photography, Art & Design: Textiles, Biology, Chemistry, Citizenship Studies, Classical Greek, Combined Science, Computing, Dance, Drama, English Language, English Literature, Food Prep and Nutrition, French, Geography, German, History, Latin, Mathematics, Music, Physical Education, Physics, Religious Studies, Spanish
The fixed effects of the models were: (please refer to Appendix A above for keys to the acronyms and abbreviations)
- gender: male, female (reference category) (the unknown/neither category was omitted in the modelling because of the extremely small number of entries belonging to the category)
- ethnicity: ABAN, AIND, AOTH, APKN, BAFR, BCRB, BOTH, CHNE, MOTH, MWAS, MWBA, MWBC, WBRI (reference category), WIRI, WIRT (only in GCSE analyses), WOTH (subsuming WIRT and WROM in A level analyses), WROM (only in GCSE analyses), unknown
- major language: English (reference category), NotEnglish, unknown
- SEND status: NoSEND (reference category), SEND, unknown
- FSM eligibility: NoFSM (reference category), FSM, unknown
- deprivation: very low, low, medium (reference category), high, very high, unknown
- prior attainment: very low, low, medium (reference category), high, very high, unknown
- centre type: Acad (reference category), Free, FurE, Indp, Other, SecComp, SecMod, SecSel, Sixth, Tert
- region: EM, EA, LD, NE, NW, SE (reference category), SW, WM, Y&H
For the grade probability measures, we also ran logistic regressions in which the dependent variable yijk was the natural logarithm of the odds of the exam entry by candidate i in centre j in subject k being awarded the target grade. The exponentials of the β coefficients of a fitted logistic regression model are the odds ratios between groups which can be interpreted as estimates of the likelihood of entries by students of a particular group being awarded the target grade relative to entries by students of the reference group after controlling for other variables. For the between-group comparisons examined in our modelling, the pattern of changes in odds ratio across the years in the logistic models was consistent with the pattern of changes in relative outcome difference across the years in the linear probability models. We present results of the linear models for the grade probability measures in this report, as probabilities are more intuitive to interpret than odds ratios.
Appendix D.2 - VTQ model specification
A mixed effect modelling approach was also adopted for VTQ analysis, whereby the learner characteristics (including their prior attainment) were treated as fixed effects, and the learner’s centre was treated as a random effect. This is because there may be factors affecting results that only learners from the same centre have in common, such as teaching materials used at their school or college.
The logistic regression specification (available separately in an accessible document) takes the form:

where:
- P(Yij = 1) is the dependant variable. It determines the probability of achieving a top grade for candidate i at centre j
- Xi is a set of independent fixed effect variables summarising the demographic and socio-economic characteristics of the candidate (see list of variables described above)
- Zi is an independent fixed effect variable determining the highest level of prior attainment of candidate i. It is an additional variable that is controlled for in the logistic regression analysis
- cj is a random effect determined by centre-level characteristics. It is also an additional variable that is controlled for in the logistic regression analysis
- α, β, γ are the regression coefficients
Appendix D.3 – Confidence intervals
All β coefficients had associated standard errors (SEs), which quantified how precisely β coefficients had been estimated. The SEs were used to compute the 95% confidence intervals (CIs) of the β coefficients, using the formula: 95% CI = β ± 1.96*SE. βs (taken as estimates of relative outcome differences after controlling for other background variables). The same calculation was used for both GQ and VTQ analyses.
Appendix E - Full results tables
Appendix E.1 - GQ
Table E1.1 Full model results of analyses on numeric grade in A level
| Model term | 2018 estimate | 2018 SE | 2018 p | 2019 estimate | 2019 SE | 2019 p | 2020 estimate | 2020 SE | 2020 p | 2021 estimate | 2021 SE | 2021 p | 2022 estimate | 2022 SE | 2022 p |
|---|---|---|---|---|---|---|---|---|---|---|---|---|---|---|---|
| Intercept α | 3.427 | 0.093 | 0 | 3.445 | 0.094 | 0 | 4.104 | 0.081 | 0 | 4.314 | 0.074 | 0 | 3.851 | 0.089 | 0 |
| Centre Type: Free | -0.168 | 0.076 | 0.028 | -0.002 | 0.076 | 0.978 | -0.044 | 0.052 | 0.403 | -0.029 | 0.061 | 0.643 | 0.025 | 0.08 | 0.754 |
| Centre Type: FurE | -0.074 | 0.055 | 0.179 | -0.154 | 0.053 | 0.004 | -0.109 | 0.04 | 0.006 | -0.215 | 0.043 | 0 | -0.531 | 0.054 | 0 |
| Centre Type: Indp | 0.454 | 0.038 | 0 | 0.467 | 0.036 | 0 | 0.346 | 0.029 | 0 | 0.482 | 0.029 | 0 | 0.391 | 0.034 | 0 |
| Centre Type: Other | -0.213 | 0.078 | 0.007 | -0.088 | 0.075 | 0.241 | 0.128 | 0.057 | 0.025 | 0.255 | 0.063 | 0 | -0.264 | 0.08 | 0.001 |
| Centre Type: SecComp | -0.05 | 0.019 | 0.008 | -0.064 | 0.019 | 0.001 | -0.003 | 0.013 | 0.802 | 0.014 | 0.016 | 0.385 | -0.029 | 0.021 | 0.155 |
| Centre Type: SecMod | -0.239 | 0.075 | 0.001 | -0.23 | 0.074 | 0.002 | -0.055 | 0.052 | 0.298 | -0.081 | 0.062 | 0.191 | -0.208 | 0.08 | 0.009 |
| Centre Type: SecSel | 0.121 | 0.041 | 0.003 | 0.137 | 0.04 | 0.001 | -0.052 | 0.027 | 0.056 | -0.028 | 0.033 | 0.393 | 0.224 | 0.044 | 0 |
| Centre Type: Sixth | 0.031 | 0.046 | 0.503 | 0.034 | 0.044 | 0.448 | -0.114 | 0.033 | 0.001 | -0.188 | 0.036 | 0 | -0.131 | 0.045 | 0.004 |
| Centre Type: Tert | 0.121 | 0.073 | 0.097 | 0.051 | 0.072 | 0.472 | -0.103 | 0.051 | 0.043 | -0.214 | 0.058 | 0 | -0.157 | 0.076 | 0.039 |
| Ethnicity: ABAN | -0.106 | 0.025 | 0 | -0.114 | 0.022 | 0 | -0.13 | 0.019 | 0 | -0.092 | 0.02 | 0 | -0.071 | 0.021 | 0.001 |
| Ethnicity: AIND | 0.034 | 0.015 | 0.025 | 0.035 | 0.014 | 0.014 | 0.048 | 0.012 | 0 | 0.099 | 0.013 | 0 | 0.095 | 0.013 | 0 |
| Ethnicity: AOTH | -0.103 | 0.019 | 0 | -0.088 | 0.018 | 0 | -0.088 | 0.015 | 0 | -0.004 | 0.016 | 0.808 | -0.026 | 0.016 | 0.12 |
| Ethnicity: APKN | -0.071 | 0.017 | 0 | -0.063 | 0.016 | 0 | -0.092 | 0.014 | 0 | -0.083 | 0.014 | 0 | -0.034 | 0.015 | 0.024 |
| Ethnicity: BAFR | -0.066 | 0.016 | 0 | -0.056 | 0.015 | 0 | -0.089 | 0.013 | 0 | -0.116 | 0.013 | 0 | -0.007 | 0.014 | 0.615 |
| Ethnicity: BCRB | -0.176 | 0.028 | 0 | -0.164 | 0.027 | 0 | -0.093 | 0.026 | 0 | -0.165 | 0.027 | 0 | -0.112 | 0.028 | 0 |
| Ethnicity: BOTH | -0.097 | 0.036 | 0.007 | -0.094 | 0.033 | 0.005 | -0.084 | 0.029 | 0.004 | -0.124 | 0.029 | 0 | -0.055 | 0.031 | 0.076 |
| Ethnicity: CHNE | 0.062 | 0.032 | 0.055 | 0.165 | 0.031 | 0 | 0.165 | 0.028 | 0 | 0.121 | 0.029 | 0 | 0.195 | 0.032 | 0 |
| Ethnicity: MOTH | -0.028 | 0.02 | 0.164 | -0.015 | 0.019 | 0.418 | -0.055 | 0.016 | 0.001 | -0.039 | 0.017 | 0.019 | -0.014 | 0.017 | 0.408 |
| Ethnicity: MWAS | -0.003 | 0.022 | 0.899 | 0.047 | 0.022 | 0.03 | 0.005 | 0.018 | 0.771 | 0.004 | 0.019 | 0.853 | 0.044 | 0.02 | 0.025 |
| Ethnicity: MWBA | -0.101 | 0.036 | 0.006 | -0.049 | 0.035 | 0.161 | -0.059 | 0.03 | 0.048 | -0.068 | 0.03 | 0.023 | 0.032 | 0.031 | 0.301 |
| Ethnicity: MWBC | -0.086 | 0.027 | 0.002 | -0.053 | 0.026 | 0.041 | -0.09 | 0.023 | 0 | -0.105 | 0.025 | 0 | -0.068 | 0.026 | 0.008 |
| Ethnicity: OOTH | -0.003 | 0.022 | 0.894 | 0.004 | 0.021 | 0.853 | 0.023 | 0.018 | 0.214 | 0.008 | 0.019 | 0.652 | 0.044 | 0.019 | 0.022 |
| Ethnicity: WIRI | 0.035 | 0.037 | 0.34 | 0.064 | 0.036 | 0.075 | 0.049 | 0.032 | 0.13 | 0.047 | 0.034 | 0.168 | 0.121 | 0.037 | 0.001 |
| Ethnicity: WOTH | 0.028 | 0.015 | 0.057 | 0.018 | 0.014 | 0.19 | 0.046 | 0.012 | 0 | 0.01 | 0.013 | 0.443 | 0.007 | 0.013 | 0.574 |
| Ethnicity: Unknown | -0.057 | 0.027 | 0.033 | -0.046 | 0.024 | 0.06 | -0.066 | 0.021 | 0.001 | -0.062 | 0.021 | 0.003 | -0.041 | 0.021 | 0.051 |
| FSM: FSM | -0.083 | 0.014 | 0 | -0.04 | 0.012 | 0.001 | -0.058 | 0.01 | 0 | -0.099 | 0.01 | 0 | -0.096 | 0.01 | 0 |
| FSM: Unknown | 0.101 | 0.084 | 0.231 | 0.059 | 0.083 | 0.479 | 0.106 | 0.073 | 0.142 | 0.166 | 0.076 | 0.028 | 0.183 | 0.083 | 0.028 |
| Gender: Male | 0.145 | 0.005 | 0 | 0.104 | 0.005 | 0 | -0.023 | 0.004 | 0 | -0.093 | 0.004 | 0 | 0.025 | 0.005 | 0 |
| Deprivation: Very low | 0.069 | 0.009 | 0 | 0.068 | 0.009 | 0 | 0.044 | 0.008 | 0 | 0.065 | 0.008 | 0 | 0.085 | 0.009 | 0 |
| Deprivation: Low | 0.025 | 0.009 | 0.004 | 0.021 | 0.008 | 0.011 | 0.019 | 0.007 | 0.008 | 0.032 | 0.008 | 0 | 0.039 | 0.008 | 0 |
| Deprivation: High | -0.028 | 0.009 | 0.001 | -0.037 | 0.008 | 0 | -0.01 | 0.007 | 0.183 | -0.05 | 0.008 | 0 | -0.057 | 0.008 | 0 |
| Deprivation: Very high | -0.06 | 0.01 | 0 | -0.078 | 0.009 | 0 | -0.04 | 0.008 | 0 | -0.101 | 0.009 | 0 | -0.13 | 0.009 | 0 |
| Deprivation: Unknown | -0.056 | 0.059 | 0.343 | -0.074 | 0.061 | 0.228 | -0.081 | 0.059 | 0.169 | -0.099 | 0.062 | 0.108 | -0.112 | 0.068 | 0.102 |
| Major language: NotEnglish | -0.029 | 0.011 | 0.007 | 0.003 | 0.01 | 0.77 | 0.007 | 0.009 | 0.405 | 0.013 | 0.009 | 0.156 | 0.035 | 0.009 | 0 |
| Major language: Unknown | -0.127 | 0.048 | 0.009 | -0.075 | 0.046 | 0.1 | 0.007 | 0.033 | 0.832 | -0.055 | 0.037 | 0.135 | -0.092 | 0.039 | 0.018 |
| Prior attainment: Very low | -1.066 | 0.007 | 0 | -1.104 | 0.007 | 0 | -1.136 | 0.006 | 0 | -1.191 | 0.007 | 0 | -1.132 | 0.007 | 0 |
| Prior attainment: Low | -0.501 | 0.007 | 0 | -0.511 | 0.007 | 0 | -0.52 | 0.006 | 0 | -0.536 | 0.006 | 0 | -0.494 | 0.007 | 0 |
| Prior attainment: High | 0.552 | 0.007 | 0 | 0.582 | 0.007 | 0 | 0.627 | 0.006 | 0 | 0.619 | 0.006 | 0 | 0.587 | 0.007 | 0 |
| Prior attainment: Very high | 1.412 | 0.007 | 0 | 1.454 | 0.007 | 0 | 1.526 | 0.006 | 0 | 1.423 | 0.007 | 0 | 1.435 | 0.007 | 0 |
| Prior attainment: Unknown | 0.366 | 0.011 | 0 | 0.338 | 0.011 | 0 | 0.3 | 0.01 | 0 | 0.209 | 0.009 | 0 | 0.15 | 0.01 | 0 |
| Region: East Midlands | 0.005 | 0.029 | 0.873 | -0.031 | 0.029 | 0.293 | -0.045 | 0.02 | 0.027 | -0.045 | 0.024 | 0.063 | -0.029 | 0.032 | 0.36 |
| Region: East of England | 0.017 | 0.026 | 0.51 | 0.012 | 0.026 | 0.656 | -0.026 | 0.018 | 0.15 | 0.018 | 0.021 | 0.391 | 0.008 | 0.028 | 0.791 |
| Region: London | 0.122 | 0.024 | 0 | 0.118 | 0.024 | 0 | 0.062 | 0.016 | 0 | 0.089 | 0.019 | 0 | 0.145 | 0.026 | 0 |
| Region: north-east | 0.001 | 0.04 | 0.987 | 0.049 | 0.04 | 0.219 | -0.01 | 0.028 | 0.723 | -0.01 | 0.033 | 0.756 | -0.01 | 0.043 | 0.817 |
| Region: north-west | 0.013 | 0.028 | 0.641 | 0.019 | 0.028 | 0.489 | -0.021 | 0.02 | 0.276 | -0.006 | 0.023 | 0.805 | 0.001 | 0.03 | 0.965 |
| Region: south-west | -0.009 | 0.027 | 0.734 | 0 | 0.027 | 0.994 | -0.03 | 0.019 | 0.116 | -0.05 | 0.022 | 0.024 | -0.018 | 0.03 | 0.532 |
| Region: West Midlands | -0.059 | 0.028 | 0.032 | -0.036 | 0.027 | 0.193 | -0.046 | 0.019 | 0.016 | -0.044 | 0.023 | 0.051 | -0.036 | 0.03 | 0.225 |
| Region: Yorkshire and the Humber | -0.009 | 0.031 | 0.761 | -0.021 | 0.031 | 0.503 | -0.055 | 0.021 | 0.009 | -0.051 | 0.025 | 0.044 | -0.051 | 0.033 | 0.126 |
| SEND: SEND | 0.002 | 0.014 | 0.867 | 0.041 | 0.013 | 0.002 | -0.047 | 0.011 | 0 | -0.068 | 0.011 | 0 | 0.004 | 0.012 | 0.761 |
Table E1.2 Full model results of analyses on probability of attaining grade A and above in A level
| Model term | 2018 estimate | 2018 SE | 2018 p | 2019 estimate | 2019 SE | 2019 p | 2020 estimate | 2020 SE | 2020 p | 2021 estimate | 2021 SE | 2021 p | 2022 estimate | 2022 SE | 2022 p |
|---|---|---|---|---|---|---|---|---|---|---|---|---|---|---|---|
| Intercept α | 0.168 | 0.016 | 0 | 0.16 | 0.016 | 0 | 0.329 | 0.021 | 0 | 0.42 | 0.02 | 0 | 0.288 | 0.018 | 0 |
| Centre Type: Free | 0.018 | 0.018 | 0.328 | 0.03 | 0.018 | 0.102 | 0.014 | 0.016 | 0.399 | 0.001 | 0.019 | 0.966 | 0.02 | 0.021 | 0.331 |
| Centre Type: FurE | -0.034 | 0.014 | 0.018 | -0.038 | 0.014 | 0.005 | -0.027 | 0.013 | 0.031 | -0.056 | 0.014 | 0 | -0.129 | 0.015 | 0 |
| Centre Type: Indp | 0.104 | 0.011 | 0 | 0.114 | 0.01 | 0 | 0.106 | 0.01 | 0 | 0.155 | 0.01 | 0 | 0.101 | 0.01 | 0 |
| Centre Type: Other | -0.014 | 0.021 | 0.503 | 0.013 | 0.02 | 0.5 | 0.03 | 0.019 | 0.111 | 0.072 | 0.021 | 0.001 | -0.061 | 0.022 | 0.007 |
| Centre Type: SecComp | -0.011 | 0.005 | 0.019 | -0.013 | 0.004 | 0.003 | 0.004 | 0.004 | 0.349 | 0.006 | 0.005 | 0.245 | -0.009 | 0.005 | 0.106 |
| Centre Type: SecMod | -0.023 | 0.019 | 0.217 | -0.011 | 0.018 | 0.549 | -0.001 | 0.017 | 0.947 | -0.008 | 0.02 | 0.691 | -0.04 | 0.021 | 0.062 |
| Centre Type: SecSel | 0.025 | 0.009 | 0.008 | 0.028 | 0.009 | 0.003 | -0.022 | 0.008 | 0.005 | -0.009 | 0.01 | 0.353 | 0.056 | 0.011 | 0 |
| Centre Type: Sixth | -0.005 | 0.012 | 0.649 | 0.001 | 0.011 | 0.901 | -0.036 | 0.01 | 0.001 | -0.06 | 0.011 | 0 | -0.043 | 0.012 | 0 |
| Centre Type: Tert | 0.01 | 0.018 | 0.588 | -0.002 | 0.017 | 0.924 | -0.034 | 0.015 | 0.026 | -0.062 | 0.018 | 0.001 | -0.062 | 0.02 | 0.002 |
| Ethnicity: ABAN | -0.03 | 0.008 | 0 | -0.04 | 0.007 | 0 | -0.045 | 0.007 | 0 | -0.032 | 0.007 | 0 | -0.027 | 0.007 | 0 |
| Ethnicity: AIND | -0.003 | 0.005 | 0.6 | -0.003 | 0.005 | 0.55 | 0.007 | 0.005 | 0.127 | 0.023 | 0.005 | 0 | 0.018 | 0.005 | 0 |
| Ethnicity: AOTH | -0.032 | 0.006 | 0 | -0.031 | 0.006 | 0 | -0.028 | 0.006 | 0 | -0.003 | 0.006 | 0.605 | -0.01 | 0.006 | 0.061 |
| Ethnicity: APKN | -0.016 | 0.006 | 0.003 | -0.02 | 0.005 | 0 | -0.027 | 0.005 | 0 | -0.022 | 0.005 | 0 | -0.015 | 0.005 | 0.003 |
| Ethnicity: BAFR | -0.029 | 0.005 | 0 | -0.025 | 0.005 | 0 | -0.03 | 0.005 | 0 | -0.042 | 0.005 | 0 | -0.016 | 0.005 | 0 |
| Ethnicity: BCRB | -0.059 | 0.009 | 0 | -0.043 | 0.009 | 0 | -0.037 | 0.01 | 0 | -0.059 | 0.01 | 0 | -0.036 | 0.009 | 0 |
| Ethnicity: BOTH | -0.036 | 0.012 | 0.002 | -0.029 | 0.011 | 0.006 | -0.034 | 0.011 | 0.002 | -0.032 | 0.011 | 0.003 | -0.027 | 0.011 | 0.01 |
| Ethnicity: CHNE | 0.006 | 0.01 | 0.541 | 0.026 | 0.01 | 0.011 | 0.054 | 0.011 | 0 | 0.026 | 0.011 | 0.018 | 0.045 | 0.011 | 0 |
| Ethnicity: MOTH | -0.008 | 0.006 | 0.245 | -0.001 | 0.006 | 0.85 | -0.02 | 0.006 | 0.001 | -0.017 | 0.006 | 0.006 | -0.009 | 0.006 | 0.132 |
| Ethnicity: MWAS | -0.007 | 0.007 | 0.331 | 0.005 | 0.007 | 0.447 | 0.006 | 0.007 | 0.414 | 0.002 | 0.007 | 0.738 | 0.014 | 0.007 | 0.03 |
| Ethnicity: MWBA | -0.019 | 0.012 | 0.106 | -0.02 | 0.011 | 0.075 | -0.023 | 0.011 | 0.042 | -0.027 | 0.011 | 0.016 | 0.006 | 0.01 | 0.569 |
| Ethnicity: MWBC | -0.021 | 0.009 | 0.02 | -0.022 | 0.008 | 0.009 | -0.021 | 0.009 | 0.019 | -0.038 | 0.009 | 0 | -0.027 | 0.009 | 0.002 |
| Ethnicity: OOTH | -0.006 | 0.007 | 0.412 | -0.009 | 0.007 | 0.166 | 0.004 | 0.007 | 0.572 | 0.002 | 0.007 | 0.801 | 0.006 | 0.006 | 0.332 |
| Ethnicity: WIRI | 0.003 | 0.012 | 0.817 | 0.023 | 0.012 | 0.05 | -0.004 | 0.012 | 0.721 | 0.01 | 0.013 | 0.447 | 0.039 | 0.013 | 0.002 |
| Ethnicity: WOTH | 0.004 | 0.005 | 0.426 | 0.007 | 0.005 | 0.121 | 0.017 | 0.005 | 0 | 0.006 | 0.005 | 0.218 | 0.002 | 0.004 | 0.655 |
| Ethnicity: Unknown | -0.015 | 0.009 | 0.082 | -0.016 | 0.008 | 0.039 | -0.021 | 0.008 | 0.008 | -0.016 | 0.008 | 0.034 | -0.012 | 0.007 | 0.106 |
| FSM: FSM | -0.014 | 0.004 | 0.001 | -0.006 | 0.004 | 0.132 | -0.011 | 0.004 | 0.005 | -0.019 | 0.004 | 0 | -0.02 | 0.003 | 0 |
| FSM: Unknown | 0.042 | 0.027 | 0.122 | 0.042 | 0.026 | 0.108 | 0.034 | 0.027 | 0.214 | 0.063 | 0.028 | 0.024 | 0.078 | 0.028 | 0.005 |
| Gender: Male | 0.034 | 0.002 | 0 | 0.025 | 0.001 | 0 | 0 | 0.002 | 0.947 | -0.019 | 0.002 | 0 | 0.005 | 0.002 | 0.001 |
| Deprivation: Very low | 0.018 | 0.003 | 0 | 0.02 | 0.003 | 0 | 0.013 | 0.003 | 0 | 0.022 | 0.003 | 0 | 0.028 | 0.003 | 0 |
| Deprivation: Low | 0.007 | 0.003 | 0.013 | 0.007 | 0.003 | 0.008 | 0.007 | 0.003 | 0.016 | 0.012 | 0.003 | 0 | 0.014 | 0.003 | 0 |
| Deprivation: High | -0.007 | 0.003 | 0.012 | -0.005 | 0.003 | 0.049 | -0.003 | 0.003 | 0.357 | -0.011 | 0.003 | 0 | -0.014 | 0.003 | 0 |
| Deprivation: Very high | -0.017 | 0.003 | 0 | -0.014 | 0.003 | 0 | -0.01 | 0.003 | 0.002 | -0.027 | 0.003 | 0 | -0.029 | 0.003 | 0 |
| Deprivation: Unknown | -0.016 | 0.019 | 0.414 | -0.02 | 0.02 | 0.301 | -0.027 | 0.022 | 0.23 | -0.03 | 0.023 | 0.186 | -0.05 | 0.023 | 0.031 |
| Major language: NotEnglish | -0.008 | 0.003 | 0.026 | 0.002 | 0.003 | 0.58 | -0.001 | 0.003 | 0.679 | 0.004 | 0.003 | 0.19 | 0.009 | 0.003 | 0.006 |
| Major language: Unknown | -0.028 | 0.016 | 0.072 | -0.025 | 0.014 | 0.084 | 0.009 | 0.013 | 0.487 | -0.027 | 0.014 | 0.049 | -0.014 | 0.013 | 0.274 |
| Prior attainment: Very low | -0.133 | 0.002 | 0 | -0.131 | 0.002 | 0 | -0.251 | 0.002 | 0 | -0.295 | 0.002 | 0 | -0.208 | 0.002 | 0 |
| Prior attainment: Low | -0.08 | 0.002 | 0 | -0.078 | 0.002 | 0 | -0.148 | 0.002 | 0 | -0.165 | 0.002 | 0 | -0.118 | 0.002 | 0 |
| Prior attainment: High | 0.141 | 0.002 | 0 | 0.144 | 0.002 | 0 | 0.245 | 0.002 | 0 | 0.243 | 0.002 | 0 | 0.19 | 0.002 | 0 |
| Prior attainment: Very high | 0.464 | 0.002 | 0 | 0.477 | 0.002 | 0 | 0.609 | 0.002 | 0 | 0.54 | 0.002 | 0 | 0.501 | 0.002 | 0 |
| Prior attainment: Unknown | 0.171 | 0.003 | 0 | 0.162 | 0.003 | 0 | 0.177 | 0.004 | 0 | 0.124 | 0.003 | 0 | 0.107 | 0.003 | 0 |
| Region: East Midlands | -0.01 | 0.007 | 0.167 | -0.021 | 0.007 | 0.003 | -0.011 | 0.006 | 0.06 | -0.014 | 0.007 | 0.062 | -0.014 | 0.008 | 0.091 |
| Region: East of England | -0.003 | 0.006 | 0.673 | 0.002 | 0.006 | 0.696 | -0.009 | 0.005 | 0.112 | 0.001 | 0.007 | 0.926 | -0.001 | 0.007 | 0.85 |
| Region: London | 0.026 | 0.006 | 0 | 0.022 | 0.006 | 0 | 0.013 | 0.005 | 0.007 | 0.022 | 0.006 | 0 | 0.037 | 0.007 | 0 |
| Region: north-east | -0.016 | 0.009 | 0.085 | -0.005 | 0.009 | 0.59 | -0.012 | 0.008 | 0.141 | -0.018 | 0.01 | 0.078 | -0.019 | 0.011 | 0.083 |
| Region: north-west | -0.005 | 0.007 | 0.496 | -0.005 | 0.007 | 0.478 | -0.011 | 0.006 | 0.053 | -0.007 | 0.007 | 0.295 | -0.012 | 0.008 | 0.114 |
| Region: south-west | -0.01 | 0.006 | 0.119 | -0.002 | 0.006 | 0.758 | -0.011 | 0.006 | 0.049 | -0.017 | 0.007 | 0.016 | -0.008 | 0.008 | 0.299 |
| Region: West Midlands | -0.018 | 0.007 | 0.006 | -0.017 | 0.006 | 0.008 | -0.02 | 0.006 | 0.001 | -0.021 | 0.007 | 0.003 | -0.017 | 0.008 | 0.032 |
| Region: Yorkshire and the Humber | -0.01 | 0.007 | 0.163 | -0.012 | 0.007 | 0.094 | -0.019 | 0.006 | 0.003 | -0.017 | 0.008 | 0.031 | -0.017 | 0.009 | 0.049 |
| SEND: SEND | 0.004 | 0.005 | 0.354 | 0.013 | 0.004 | 0.002 | -0.011 | 0.004 | 0.01 | -0.008 | 0.004 | 0.065 | 0.005 | 0.004 | 0.196 |
Table E1.3 Full model results of analyses on probability of attaining grade C and above in A level
| Model term | 2018 estimate | 2018 SE | 2018 p | 2019 estimate | 2019 SE | 2019 p | 2020 estimate | 2020 SE | 2020 p | 2021 estimate | 2021 SE | 2021 p | 2022 estimate | 2022 SE | 2022 p |
|---|---|---|---|---|---|---|---|---|---|---|---|---|---|---|---|
| Intercept α | 0.806 | 0.024 | 0 | 0.812 | 0.024 | 0 | 0.955 | 0.015 | 0 | 0.964 | 0.013 | 0 | 0.877 | 0.02 | 0 |
| Centre Type: Free | -0.028 | 0.02 | 0.165 | -0.01 | 0.02 | 0.629 | -0.025 | 0.013 | 0.057 | -0.017 | 0.013 | 0.191 | 0.002 | 0.019 | 0.913 |
| Centre Type: FurE | -0.022 | 0.015 | 0.152 | -0.062 | 0.015 | 0 | -0.025 | 0.01 | 0.014 | -0.035 | 0.009 | 0 | -0.121 | 0.013 | 0 |
| Centre Type: Indp | 0.088 | 0.011 | 0 | 0.081 | 0.01 | 0 | 0.051 | 0.008 | 0 | 0.054 | 0.007 | 0 | 0.067 | 0.009 | 0 |
| Centre Type: Other | -0.062 | 0.022 | 0.005 | -0.043 | 0.021 | 0.046 | 0.012 | 0.015 | 0.428 | 0.029 | 0.014 | 0.041 | -0.046 | 0.02 | 0.022 |
| Centre Type: SecComp | -0.012 | 0.005 | 0.015 | -0.015 | 0.005 | 0.003 | -0.004 | 0.003 | 0.234 | 0 | 0.003 | 0.984 | -0.007 | 0.005 | 0.129 |
| Centre Type: SecMod | -0.065 | 0.02 | 0.001 | -0.085 | 0.02 | 0 | -0.029 | 0.013 | 0.03 | -0.018 | 0.013 | 0.165 | -0.045 | 0.019 | 0.019 |
| Centre Type: SecSel | 0.021 | 0.01 | 0.042 | 0.029 | 0.01 | 0.006 | -0.007 | 0.007 | 0.307 | -0.005 | 0.006 | 0.443 | 0.038 | 0.01 | 0 |
| Centre Type: Sixth | 0.002 | 0.013 | 0.884 | -0.008 | 0.012 | 0.493 | -0.023 | 0.008 | 0.006 | -0.031 | 0.008 | 0 | -0.026 | 0.011 | 0.02 |
| Centre Type: Tert | 0.031 | 0.019 | 0.105 | 0.006 | 0.019 | 0.771 | -0.021 | 0.013 | 0.09 | -0.035 | 0.012 | 0.003 | -0.024 | 0.018 | 0.185 |
| Ethnicity: ABAN | -0.018 | 0.008 | 0.017 | -0.016 | 0.007 | 0.022 | -0.018 | 0.006 | 0.001 | -0.011 | 0.005 | 0.034 | 0.002 | 0.006 | 0.696 |
| Ethnicity: AIND | 0.009 | 0.005 | 0.071 | 0.012 | 0.005 | 0.008 | 0.014 | 0.004 | 0 | 0.021 | 0.003 | 0 | 0.019 | 0.004 | 0 |
| Ethnicity: AOTH | -0.018 | 0.006 | 0.002 | -0.013 | 0.006 | 0.025 | -0.014 | 0.004 | 0.001 | -0.002 | 0.004 | 0.585 | -0.001 | 0.005 | 0.876 |
| Ethnicity: APKN | -0.015 | 0.005 | 0.005 | -0.011 | 0.005 | 0.027 | -0.02 | 0.004 | 0 | -0.016 | 0.004 | 0 | -0.002 | 0.004 | 0.579 |
| Ethnicity: BAFR | -0.003 | 0.005 | 0.537 | -0.01 | 0.005 | 0.03 | -0.013 | 0.004 | 0 | -0.012 | 0.004 | 0.001 | 0.006 | 0.004 | 0.097 |
| Ethnicity: BCRB | -0.031 | 0.009 | 0.001 | -0.033 | 0.009 | 0 | -0.011 | 0.007 | 0.158 | -0.014 | 0.007 | 0.046 | -0.017 | 0.008 | 0.029 |
| Ethnicity: BOTH | -0.014 | 0.011 | 0.224 | -0.02 | 0.011 | 0.054 | -0.017 | 0.008 | 0.047 | -0.022 | 0.008 | 0.006 | -0.007 | 0.009 | 0.426 |
| Ethnicity: CHNE | 0.024 | 0.01 | 0.02 | 0.04 | 0.01 | 0 | 0.021 | 0.008 | 0.009 | 0.022 | 0.008 | 0.006 | 0.043 | 0.009 | 0 |
| Ethnicity: MOTH | -0.009 | 0.006 | 0.147 | -0.006 | 0.006 | 0.29 | -0.007 | 0.005 | 0.154 | -0.004 | 0.004 | 0.431 | 0.001 | 0.005 | 0.883 |
| Ethnicity: MWAS | 0.006 | 0.007 | 0.363 | 0.013 | 0.007 | 0.062 | -0.006 | 0.005 | 0.272 | -0.003 | 0.005 | 0.587 | 0.012 | 0.006 | 0.034 |
| Ethnicity: MWBA | -0.035 | 0.011 | 0.002 | -0.017 | 0.011 | 0.124 | -0.012 | 0.009 | 0.185 | -0.014 | 0.008 | 0.092 | 0.008 | 0.009 | 0.335 |
| Ethnicity: MWBC | -0.016 | 0.009 | 0.062 | -0.01 | 0.008 | 0.231 | -0.016 | 0.007 | 0.018 | -0.012 | 0.007 | 0.082 | -0.013 | 0.007 | 0.066 |
| Ethnicity: OOTH | 0.006 | 0.007 | 0.389 | 0.006 | 0.007 | 0.338 | 0 | 0.005 | 0.958 | 0.003 | 0.005 | 0.532 | 0.012 | 0.005 | 0.031 |
| Ethnicity: WIRI | 0.019 | 0.012 | 0.104 | 0.016 | 0.012 | 0.164 | 0.019 | 0.009 | 0.041 | 0.013 | 0.009 | 0.152 | 0.019 | 0.011 | 0.072 |
| Ethnicity: WOTH | 0.009 | 0.005 | 0.066 | 0.001 | 0.005 | 0.847 | 0.004 | 0.004 | 0.221 | 0.003 | 0.003 | 0.442 | 0.004 | 0.004 | 0.241 |
| Ethnicity: Unknown | -0.012 | 0.008 | 0.152 | -0.007 | 0.008 | 0.37 | -0.019 | 0.006 | 0.002 | -0.013 | 0.006 | 0.016 | -0.005 | 0.006 | 0.427 |
| FSM: FSM | -0.022 | 0.004 | 0 | -0.014 | 0.004 | 0 | -0.014 | 0.003 | 0 | -0.025 | 0.003 | 0 | -0.019 | 0.003 | 0 |
| FSM: Unknown | 0.023 | 0.026 | 0.386 | 0.004 | 0.026 | 0.886 | 0.023 | 0.021 | 0.266 | 0.014 | 0.02 | 0.48 | 0.016 | 0.024 | 0.488 |
| Gender: Male | 0.028 | 0.002 | 0 | 0.02 | 0.001 | 0 | -0.018 | 0.001 | 0 | -0.027 | 0.001 | 0 | 0.003 | 0.001 | 0.03 |
| Deprivation: Very low | 0.016 | 0.003 | 0 | 0.014 | 0.003 | 0 | 0.008 | 0.002 | 0 | 0.009 | 0.002 | 0 | 0.015 | 0.002 | 0 |
| Deprivation: Low | 0.006 | 0.003 | 0.025 | 0.004 | 0.003 | 0.098 | 0.004 | 0.002 | 0.038 | 0.006 | 0.002 | 0.002 | 0.006 | 0.002 | 0.015 |
| Deprivation: High | -0.008 | 0.003 | 0.004 | -0.011 | 0.003 | 0 | -0.002 | 0.002 | 0.263 | -0.011 | 0.002 | 0 | -0.013 | 0.002 | 0 |
| Deprivation: Very high | -0.013 | 0.003 | 0 | -0.023 | 0.003 | 0 | -0.01 | 0.002 | 0 | -0.018 | 0.002 | 0 | -0.034 | 0.003 | 0 |
| Deprivation: Unknown | -0.02 | 0.019 | 0.281 | -0.009 | 0.02 | 0.647 | -0.014 | 0.017 | 0.41 | -0.013 | 0.017 | 0.45 | -0.011 | 0.02 | 0.59 |
| Major language: NotEnglish | -0.009 | 0.003 | 0.011 | 0 | 0.003 | 0.987 | 0.003 | 0.003 | 0.171 | -0.001 | 0.002 | 0.765 | 0.006 | 0.003 | 0.018 |
| Major language: Unknown | -0.02 | 0.015 | 0.198 | -0.005 | 0.015 | 0.71 | 0.003 | 0.01 | 0.781 | 0.001 | 0.01 | 0.901 | -0.019 | 0.011 | 0.084 |
| Prior attainment: Very low | -0.334 | 0.002 | 0 | -0.348 | 0.002 | 0 | -0.266 | 0.002 | 0 | -0.253 | 0.002 | 0 | -0.293 | 0.002 | 0 |
| Prior attainment: Low | -0.143 | 0.002 | 0 | -0.146 | 0.002 | 0 | -0.091 | 0.002 | 0 | -0.088 | 0.002 | 0 | -0.106 | 0.002 | 0 |
| Prior attainment: High | 0.119 | 0.002 | 0 | 0.128 | 0.002 | 0 | 0.073 | 0.002 | 0 | 0.068 | 0.002 | 0 | 0.097 | 0.002 | 0 |
| Prior attainment: Very high | 0.218 | 0.002 | 0 | 0.227 | 0.002 | 0 | 0.12 | 0.002 | 0 | 0.11 | 0.002 | 0 | 0.174 | 0.002 | 0 |
| Prior attainment: Unknown | 0.031 | 0.003 | 0 | 0.021 | 0.003 | 0 | -0.011 | 0.003 | 0 | -0.015 | 0.003 | 0 | -0.017 | 0.003 | 0 |
| Region: East Midlands | 0.007 | 0.008 | 0.34 | 0 | 0.008 | 0.979 | -0.009 | 0.005 | 0.061 | -0.006 | 0.005 | 0.203 | -0.005 | 0.007 | 0.535 |
| Region: East of England | 0.007 | 0.007 | 0.34 | 0.005 | 0.007 | 0.47 | -0.004 | 0.004 | 0.369 | 0.005 | 0.004 | 0.279 | 0.002 | 0.007 | 0.724 |
| Region: London | 0.027 | 0.006 | 0 | 0.03 | 0.006 | 0 | 0.013 | 0.004 | 0.001 | 0.014 | 0.004 | 0.001 | 0.023 | 0.006 | 0 |
| Region: north-east | 0.013 | 0.01 | 0.2 | 0.024 | 0.011 | 0.024 | 0.008 | 0.007 | 0.269 | 0.007 | 0.007 | 0.297 | 0.008 | 0.01 | 0.406 |
| Region: north-west | 0.008 | 0.007 | 0.288 | 0.01 | 0.007 | 0.176 | 0.003 | 0.005 | 0.475 | 0.002 | 0.005 | 0.716 | 0.005 | 0.007 | 0.485 |
| Region: south-west | 0.002 | 0.007 | 0.732 | 0 | 0.007 | 0.97 | -0.002 | 0.005 | 0.685 | -0.008 | 0.005 | 0.085 | -0.003 | 0.007 | 0.679 |
| Region: West Midlands | -0.011 | 0.007 | 0.146 | -0.003 | 0.007 | 0.73 | -0.004 | 0.005 | 0.367 | -0.004 | 0.005 | 0.399 | -0.005 | 0.007 | 0.49 |
| Region: Yorkshire and the Humber | 0.005 | 0.008 | 0.54 | -0.002 | 0.008 | 0.761 | -0.009 | 0.005 | 0.081 | -0.005 | 0.005 | 0.316 | -0.008 | 0.008 | 0.311 |
| SEND: SEND | -0.006 | 0.004 | 0.184 | 0.003 | 0.004 | 0.527 | -0.014 | 0.003 | 0 | -0.021 | 0.003 | 0 | -0.005 | 0.003 | 0.118 |
Table E1.4 Full model results of analyses on numeric grade in GCSE
| Model term | 2018 estimate | 2018 SE | 2018 p | 2019 estimate | 2019 SE | 2019 p | 2020 estimate | 2020 SE | 2020 p | 2021 estimate | 2021 SE | 2021 p | 2022 estimate | 2022 SE | 2022 p |
|---|---|---|---|---|---|---|---|---|---|---|---|---|---|---|---|
| Intercept α | 4.945 | 0.087 | 0 | 4.948 | 0.085 | 0 | 5.519 | 0.079 | 0 | 5.527 | 0.071 | 0 | 5.319 | 0.086 | 0 |
| Centre Type: Free | -0.197 | 0.075 | 0.009 | -0.212 | 0.076 | 0.005 | -0.061 | 0.066 | 0.35 | -0.046 | 0.067 | 0.499 | -0.289 | 0.076 | 0 |
| Centre Type: FurE | -0.743 | 0.11 | 0 | -0.942 | 0.106 | 0 | -0.807 | 0.091 | 0 | -0.909 | 0.095 | 0 | -1.119 | 0.105 | 0 |
| Centre Type: Indp | 1.768 | 0.033 | 0 | 1.748 | 0.034 | 0 | 1.762 | 0.032 | 0 | 1.715 | 0.032 | 0 | 1.41 | 0.035 | 0 |
| Centre Type: Other | -1.002 | 0.039 | 0 | -0.961 | 0.039 | 0 | -0.688 | 0.034 | 0 | -0.726 | 0.035 | 0 | -1.034 | 0.039 | 0 |
| Centre Type: SecComp | -0.055 | 0.027 | 0.041 | -0.063 | 0.027 | 0.021 | -0.044 | 0.024 | 0.065 | -0.029 | 0.024 | 0.23 | -0.049 | 0.027 | 0.073 |
| Centre Type: SecMod | -0.251 | 0.091 | 0.006 | -0.216 | 0.091 | 0.018 | -0.161 | 0.079 | 0.043 | -0.159 | 0.081 | 0.049 | -0.213 | 0.091 | 0.02 |
| Centre Type: SecSel | 0.875 | 0.083 | 0 | 0.853 | 0.084 | 0 | 0.735 | 0.072 | 0 | 0.711 | 0.074 | 0 | 0.843 | 0.084 | 0 |
| Centre Type: Sixth | 0.082 | 0.252 | 0.744 | 0.375 | 0.265 | 0.157 | 0.55 | 0.24 | 0.022 | 0.276 | 0.247 | 0.263 | 0.04 | 0.272 | 0.884 |
| Centre Type: Tert | -0.554 | 0.187 | 0.003 | -0.58 | 0.179 | 0.001 | -0.427 | 0.156 | 0.006 | -0.485 | 0.158 | 0.002 | -0.831 | 0.178 | 0 |
| Ethnicity: ABAN | 0.606 | 0.017 | 0 | 0.66 | 0.016 | 0 | 0.626 | 0.016 | 0 | 0.69 | 0.016 | 0 | 0.707 | 0.016 | 0 |
| Ethnicity: AIND | 0.631 | 0.013 | 0 | 0.627 | 0.012 | 0 | 0.587 | 0.012 | 0 | 0.657 | 0.012 | 0 | 0.696 | 0.012 | 0 |
| Ethnicity: AOTH | 0.543 | 0.015 | 0 | 0.566 | 0.015 | 0 | 0.508 | 0.014 | 0 | 0.611 | 0.014 | 0 | 0.581 | 0.014 | 0 |
| Ethnicity: APKN | 0.373 | 0.012 | 0 | 0.377 | 0.011 | 0 | 0.337 | 0.011 | 0 | 0.383 | 0.011 | 0 | 0.409 | 0.011 | 0 |
| Ethnicity: BAFR | 0.384 | 0.011 | 0 | 0.373 | 0.011 | 0 | 0.318 | 0.01 | 0 | 0.385 | 0.01 | 0 | 0.434 | 0.01 | 0 |
| Ethnicity: BCRB | -0.115 | 0.016 | 0 | -0.12 | 0.016 | 0 | -0.065 | 0.016 | 0 | -0.065 | 0.017 | 0 | -0.083 | 0.017 | 0 |
| Ethnicity: BOTH | 0.2 | 0.022 | 0 | 0.178 | 0.021 | 0 | 0.177 | 0.02 | 0 | 0.215 | 0.02 | 0 | 0.269 | 0.021 | 0 |
| Ethnicity: CHNE | 0.951 | 0.031 | 0 | 0.892 | 0.029 | 0 | 0.947 | 0.028 | 0 | 0.934 | 0.029 | 0 | 1.004 | 0.028 | 0 |
| Ethnicity: MOTH | 0.24 | 0.014 | 0 | 0.257 | 0.013 | 0 | 0.187 | 0.012 | 0 | 0.229 | 0.013 | 0 | 0.256 | 0.013 | 0 |
| Ethnicity: MWAS | 0.27 | 0.017 | 0 | 0.304 | 0.017 | 0 | 0.298 | 0.016 | 0 | 0.282 | 0.015 | 0 | 0.36 | 0.015 | 0 |
| Ethnicity: MWBA | 0.131 | 0.024 | 0 | 0.217 | 0.023 | 0 | 0.168 | 0.021 | 0 | 0.171 | 0.021 | 0 | 0.215 | 0.02 | 0 |
| Ethnicity: MWBC | -0.108 | 0.016 | 0 | -0.104 | 0.015 | 0 | -0.11 | 0.014 | 0 | -0.126 | 0.015 | 0 | -0.125 | 0.015 | 0 |
| Ethnicity: OOTH | 0.336 | 0.016 | 0 | 0.312 | 0.015 | 0 | 0.282 | 0.014 | 0 | 0.361 | 0.014 | 0 | 0.377 | 0.014 | 0 |
| Ethnicity: WIRI | 0.134 | 0.032 | 0 | 0.118 | 0.031 | 0 | 0.091 | 0.031 | 0.003 | 0.153 | 0.032 | 0 | 0.156 | 0.034 | 0 |
| Ethnicity: WIRT | -0.531 | 0.13 | 0 | -0.371 | 0.111 | 0.001 | -0.485 | 0.099 | 0 | -0.552 | 0.108 | 0 | -0.432 | 0.105 | 0 |
| Ethnicity: WOTH | 0.235 | 0.01 | 0 | 0.221 | 0.01 | 0 | 0.209 | 0.009 | 0 | 0.264 | 0.01 | 0 | 0.306 | 0.01 | 0 |
| Ethnicity: WROM | -1.28 | 0.042 | 0 | -1.199 | 0.04 | 0 | -1.14 | 0.036 | 0 | -1.215 | 0.037 | 0 | -1.003 | 0.039 | 0 |
| Ethnicity: Unknown | 0.019 | 0.018 | 0.302 | -0.009 | 0.017 | 0.588 | -0.01 | 0.015 | 0.504 | 0.046 | 0.015 | 0.002 | 0.073 | 0.015 | 0 |
| FSM: FSM | -0.382 | 0.006 | 0 | -0.386 | 0.005 | 0 | -0.428 | 0.005 | 0 | -0.488 | 0.005 | 0 | -0.489 | 0.005 | 0 |
| FSM: Unknown | -0.337 | 0.066 | 0 | -0.364 | 0.062 | 0 | -0.095 | 0.063 | 0.129 | -0.025 | 0.06 | 0.685 | -0.069 | 0.064 | 0.281 |
| Gender: Male | -0.392 | 0.004 | 0 | -0.401 | 0.004 | 0 | -0.435 | 0.003 | 0 | -0.395 | 0.004 | 0 | -0.341 | 0.004 | 0 |
| Deprivation: Very low | 0.29 | 0.006 | 0 | 0.288 | 0.006 | 0 | 0.232 | 0.006 | 0 | 0.261 | 0.006 | 0 | 0.272 | 0.006 | 0 |
| Deprivation: Low | 0.137 | 0.006 | 0 | 0.142 | 0.006 | 0 | 0.117 | 0.005 | 0 | 0.132 | 0.006 | 0 | 0.134 | 0.006 | 0 |
| Deprivation: High | -0.138 | 0.006 | 0 | -0.138 | 0.006 | 0 | -0.114 | 0.006 | 0 | -0.115 | 0.006 | 0 | -0.117 | 0.006 | 0 |
| Deprivation: Very high | -0.247 | 0.006 | 0 | -0.24 | 0.006 | 0 | -0.202 | 0.006 | 0 | -0.224 | 0.006 | 0 | -0.215 | 0.006 | 0 |
| Deprivation: Unknown | -0.133 | 0.044 | 0.002 | -0.069 | 0.045 | 0.123 | -0.046 | 0.045 | 0.31 | -0.06 | 0.047 | 0.197 | -0.051 | 0.052 | 0.327 |
| Major language: NotEnglish | 0 | 0.008 | 0.963 | -0.003 | 0.008 | 0.651 | 0.004 | 0.007 | 0.603 | 0.017 | 0.007 | 0.019 | 0.04 | 0.007 | 0 |
| Major language: Unknown | 0.004 | 0.047 | 0.94 | -0.028 | 0.04 | 0.473 | -0.228 | 0.04 | 0 | -0.179 | 0.035 | 0 | -0.126 | 0.033 | 0 |
| Prior attainment: Very low | -1.375 | 0.006 | 0 | -1.376 | 0.006 | 0 | -1.402 | 0.006 | 0 | -1.458 | 0.006 | 0 | -1.44 | 0.006 | 0 |
| Prior attainment: Low | -0.626 | 0.006 | 0 | -0.635 | 0.006 | 0 | -0.646 | 0.005 | 0 | -0.627 | 0.006 | 0 | -0.6 | 0.006 | 0 |
| Prior attainment: High | 0.701 | 0.006 | 0 | 0.71 | 0.006 | 0 | 0.701 | 0.005 | 0 | 0.687 | 0.006 | 0 | 0.66 | 0.006 | 0 |
| Prior attainment: Very high | 1.637 | 0.006 | 0 | 1.663 | 0.006 | 0 | 1.626 | 0.006 | 0 | 1.61 | 0.006 | 0 | 1.581 | 0.006 | 0 |
| Prior attainment: Unknown | -0.297 | 0.006 | 0 | -0.317 | 0.006 | 0 | -0.356 | 0.006 | 0 | -0.411 | 0.007 | 0 | -0.35 | 0.007 | 0 |
| Region: East Midlands | -0.231 | 0.045 | 0 | -0.192 | 0.045 | 0 | -0.167 | 0.039 | 0 | -0.128 | 0.04 | 0.001 | -0.17 | 0.046 | 0 |
| Region: East of England | -0.078 | 0.041 | 0.057 | -0.098 | 0.041 | 0.018 | -0.085 | 0.036 | 0.018 | -0.036 | 0.037 | 0.321 | -0.092 | 0.042 | 0.028 |
| Region: London | 0.178 | 0.037 | 0 | 0.199 | 0.037 | 0 | 0.203 | 0.033 | 0 | 0.203 | 0.033 | 0 | 0.163 | 0.038 | 0 |
| Region: north-east | -0.2 | 0.057 | 0 | -0.21 | 0.057 | 0 | -0.165 | 0.05 | 0.001 | -0.15 | 0.051 | 0.003 | -0.17 | 0.057 | 0.003 |
| Region: north-west | -0.19 | 0.038 | 0 | -0.179 | 0.039 | 0 | -0.156 | 0.034 | 0 | -0.128 | 0.034 | 0 | -0.168 | 0.039 | 0 |
| Region: south-west | -0.062 | 0.042 | 0.144 | -0.058 | 0.042 | 0.172 | -0.031 | 0.037 | 0.396 | 0.018 | 0.038 | 0.63 | -0.059 | 0.043 | 0.168 |
| Region: West Midlands | -0.208 | 0.041 | 0 | -0.21 | 0.041 | 0 | -0.133 | 0.036 | 0 | -0.103 | 0.037 | 0.005 | -0.144 | 0.041 | 0.001 |
| Region: Yorkshire and the Humber | -0.184 | 0.043 | 0 | -0.133 | 0.044 | 0.002 | -0.134 | 0.038 | 0 | -0.118 | 0.039 | 0.002 | -0.157 | 0.044 | 0 |
| SEND: SEND | -0.757 | 0.006 | 0 | -0.719 | 0.006 | 0 | -0.732 | 0.005 | 0 | -0.755 | 0.005 | 0 | -0.682 | 0.006 | 0 |
Table E1.5 Full model results of analyses on probability of attaining grade 7 and above in GCSE
| Model term | 2018 estimate | 2018 SE | 2018 p | 2019 estimate | 2019 SE | 2019 p | 2020 estimate | 2020 SE | 2020 p | 2021 estimate | 2021 SE | 2021 p | 2022 estimate | 2022 SE | 2022 p |
|---|---|---|---|---|---|---|---|---|---|---|---|---|---|---|---|
| Intercept | 0.164 | 0.011 | 0 | 0.165 | 0.011 | 0 | 0.242 | 0.012 | 0 | 0.261 | 0.066 | 0 | 0.227 | 0.011 | 0 |
| Centre Type: Free | -0.011 | 0.012 | 0.364 | -0.015 | 0.012 | 0.19 | -0.002 | 0.011 | 0.846 | 0.01 | 0.011 | 0.386 | -0.014 | 0.012 | 0.235 |
| Centre Type: FurE | -0.074 | 0.019 | 0 | -0.081 | 0.018 | 0 | -0.1 | 0.017 | 0 | -0.092 | 0.017 | 0 | -0.107 | 0.018 | 0 |
| Centre Type: Indp | 0.258 | 0.005 | 0 | 0.254 | 0.005 | 0 | 0.291 | 0.006 | 0 | 0.31 | 0.006 | 0 | 0.242 | 0.006 | 0 |
| Centre Type: Other | -0.061 | 0.006 | 0 | -0.054 | 0.006 | 0 | -0.055 | 0.006 | 0 | -0.052 | 0.006 | 0 | -0.069 | 0.007 | 0 |
| Centre Type: SecComp | -0.016 | 0.004 | 0 | -0.017 | 0.004 | 0 | -0.014 | 0.004 | 0 | -0.01 | 0.004 | 0.008 | -0.018 | 0.004 | 0 |
| Centre Type: SecMod | -0.039 | 0.014 | 0.004 | -0.037 | 0.014 | 0.008 | -0.036 | 0.013 | 0.006 | -0.028 | 0.013 | 0.032 | -0.043 | 0.014 | 0.002 |
| Centre Type: SecSel | 0.16 | 0.013 | 0 | 0.166 | 0.013 | 0 | 0.153 | 0.012 | 0 | 0.141 | 0.012 | 0 | 0.169 | 0.013 | 0 |
| Centre Type: Sixth | -0.008 | 0.042 | 0.858 | 0.055 | 0.045 | 0.222 | 0.097 | 0.044 | 0.029 | 0.012 | 0.045 | 0.783 | -0.001 | 0.047 | 0.977 |
| Centre Type: Tert | -0.069 | 0.031 | 0.024 | -0.069 | 0.029 | 0.018 | -0.064 | 0.028 | 0.02 | -0.055 | 0.027 | 0.046 | -0.06 | 0.029 | 0.041 |
| Ethnicity: ABAN | 0.075 | 0.003 | 0 | 0.086 | 0.003 | 0 | 0.093 | 0.003 | 0 | 0.108 | 0.003 | 0 | 0.102 | 0.003 | 0 |
| Ethnicity: AIND | 0.099 | 0.002 | 0 | 0.102 | 0.002 | 0 | 0.11 | 0.003 | 0 | 0.127 | 0.003 | 0 | 0.125 | 0.002 | 0 |
| Ethnicity: AOTH | 0.079 | 0.003 | 0 | 0.087 | 0.003 | 0 | 0.09 | 0.003 | 0 | 0.115 | 0.003 | 0 | 0.097 | 0.003 | 0 |
| Ethnicity: APKN | 0.04 | 0.002 | 0 | 0.046 | 0.002 | 0 | 0.046 | 0.002 | 0 | 0.058 | 0.002 | 0 | 0.057 | 0.002 | 0 |
| Ethnicity: BAFR | 0.036 | 0.002 | 0 | 0.04 | 0.002 | 0 | 0.035 | 0.002 | 0 | 0.045 | 0.002 | 0 | 0.046 | 0.002 | 0 |
| Ethnicity: BCRB | -0.021 | 0.003 | 0 | -0.019 | 0.003 | 0 | -0.025 | 0.003 | 0 | -0.02 | 0.004 | 0 | -0.021 | 0.003 | 0 |
| Ethnicity: BOTH | 0.018 | 0.004 | 0 | 0.017 | 0.004 | 0 | 0.017 | 0.004 | 0 | 0.019 | 0.004 | 0 | 0.027 | 0.004 | 0 |
| Ethnicity: CHNE | 0.163 | 0.006 | 0 | 0.16 | 0.006 | 0 | 0.192 | 0.006 | 0 | 0.191 | 0.006 | 0 | 0.193 | 0.006 | 0 |
| Ethnicity: MOTH | 0.033 | 0.003 | 0 | 0.04 | 0.003 | 0 | 0.029 | 0.003 | 0 | 0.037 | 0.003 | 0 | 0.04 | 0.003 | 0 |
| Ethnicity: MWAS | 0.049 | 0.003 | 0 | 0.054 | 0.003 | 0 | 0.057 | 0.003 | 0 | 0.056 | 0.003 | 0 | 0.065 | 0.003 | 0 |
| Ethnicity: MWBA | 0.013 | 0.005 | 0.004 | 0.023 | 0.004 | 0 | 0.025 | 0.004 | 0 | 0.02 | 0.004 | 0 | 0.023 | 0.004 | 0 |
| Ethnicity: MWBC | -0.014 | 0.003 | 0 | -0.014 | 0.003 | 0 | -0.018 | 0.003 | 0 | -0.023 | 0.003 | 0 | -0.021 | 0.003 | 0 |
| Ethnicity: OOTH | 0.048 | 0.003 | 0 | 0.048 | 0.003 | 0 | 0.049 | 0.003 | 0 | 0.064 | 0.003 | 0 | 0.066 | 0.003 | 0 |
| Ethnicity: WIRI | 0.02 | 0.006 | 0.001 | 0.02 | 0.006 | 0.001 | 0.026 | 0.007 | 0 | 0.028 | 0.007 | 0 | 0.031 | 0.007 | 0 |
| Ethnicity: WIRT | -0.027 | 0.025 | 0.279 | -0.012 | 0.021 | 0.57 | -0.036 | 0.021 | 0.091 | -0.032 | 0.023 | 0.155 | -0.033 | 0.021 | 0.117 |
| Ethnicity: WOTH | 0.038 | 0.002 | 0 | 0.038 | 0.002 | 0 | 0.039 | 0.002 | 0 | 0.049 | 0.002 | 0 | 0.052 | 0.002 | 0 |
| Ethnicity: WROM | -0.039 | 0.008 | 0 | -0.038 | 0.008 | 0 | -0.058 | 0.008 | 0 | -0.05 | 0.008 | 0 | -0.03 | 0.008 | 0 |
| Ethnicity: Unknown | 0.004 | 0.003 | 0.213 | 0.006 | 0.003 | 0.051 | 0.002 | 0.003 | 0.547 | 0.014 | 0.003 | 0 | 0.015 | 0.003 | 0 |
| FSM: FSM | -0.028 | 0.001 | 0 | -0.029 | 0.001 | 0 | -0.04 | 0.001 | 0 | -0.05 | 0.001 | 0 | -0.045 | 0.001 | 0 |
| FSM: Unknown | -0.018 | 0.013 | 0.152 | -0.025 | 0.012 | 0.031 | 0.01 | 0.013 | 0.447 | 0.004 | 0.013 | 0.774 | -0.007 | 0.013 | 0.585 |
| Gender: Male | -0.05 | 0.001 | 0 | -0.054 | 0.001 | 0 | -0.073 | 0.001 | 0 | -0.073 | 0.001 | 0 | -0.057 | 0.001 | 0 |
| Deprivation: Very low | 0.042 | 0.001 | 0 | 0.042 | 0.001 | 0 | 0.039 | 0.001 | 0 | 0.045 | 0.001 | 0 | 0.043 | 0.001 | 0 |
| Deprivation: Low | 0.018 | 0.001 | 0 | 0.018 | 0.001 | 0 | 0.017 | 0.001 | 0 | 0.02 | 0.001 | 0 | 0.018 | 0.001 | 0 |
| Deprivation: High | -0.015 | 0.001 | 0 | -0.016 | 0.001 | 0 | -0.016 | 0.001 | 0 | -0.016 | 0.001 | 0 | -0.015 | 0.001 | 0 |
| Deprivation: Very high | -0.023 | 0.001 | 0 | -0.024 | 0.001 | 0 | -0.025 | 0.001 | 0 | -0.028 | 0.001 | 0 | -0.024 | 0.001 | 0 |
| Deprivation: Unknown | -0.011 | 0.008 | 0.174 | -0.003 | 0.009 | 0.75 | 0.003 | 0.01 | 0.753 | -0.012 | 0.01 | 0.2 | -0.005 | 0.01 | 0.6 |
| Major language: NotEnglish | 0.001 | 0.001 | 0.672 | 0.001 | 0.001 | 0.538 | 0.005 | 0.002 | 0.001 | 0.004 | 0.001 | 0.01 | 0.006 | 0.001 | 0 |
| Major language: Unknown | 0.007 | 0.009 | 0.429 | -0.001 | 0.008 | 0.94 | -0.025 | 0.008 | 0.003 | -0.017 | 0.007 | 0.018 | -0.01 | 0.006 | 0.129 |
| Prior attainment: Very low | -0.076 | 0.001 | 0 | -0.078 | 0.001 | 0 | -0.115 | 0.001 | 0 | -0.13 | 0.001 | 0 | -0.11 | 0.001 | 0 |
| Prior attainment: Low | -0.058 | 0.001 | 0 | -0.058 | 0.001 | 0 | -0.084 | 0.001 | 0 | -0.091 | 0.001 | 0 | -0.078 | 0.001 | 0 |
| Prior attainment: High | 0.125 | 0.001 | 0 | 0.126 | 0.001 | 0 | 0.16 | 0.001 | 0 | 0.161 | 0.001 | 0 | 0.137 | 0.001 | 0 |
| Prior attainment: Very high | 0.372 | 0.001 | 0 | 0.373 | 0.001 | 0 | 0.423 | 0.001 | 0 | 0.422 | 0.001 | 0 | 0.384 | 0.001 | 0 |
| Prior attainment: Unknown | 0.052 | 0.001 | 0 | 0.049 | 0.001 | 0 | 0.043 | 0.001 | 0 | 0.037 | 0.001 | 0 | 0.038 | 0.001 | 0 |
| Region: East Midlands | -0.036 | 0.007 | 0 | -0.03 | 0.007 | 0 | -0.032 | 0.007 | 0 | -0.026 | 0.007 | 0 | -0.03 | 0.007 | 0 |
| Region: East of England | -0.011 | 0.006 | 0.07 | -0.012 | 0.006 | 0.054 | -0.016 | 0.006 | 0.009 | -0.01 | 0.006 | 0.103 | -0.013 | 0.006 | 0.053 |
| Region: London | 0.033 | 0.006 | 0 | 0.037 | 0.006 | 0 | 0.038 | 0.005 | 0 | 0.036 | 0.006 | 0 | 0.039 | 0.006 | 0 |
| Region: north-east | -0.028 | 0.009 | 0.002 | -0.031 | 0.009 | 0 | -0.029 | 0.008 | 0.001 | -0.026 | 0.008 | 0.002 | -0.022 | 0.009 | 0.016 |
| Region: north-west | -0.026 | 0.006 | 0 | -0.024 | 0.006 | 0 | -0.024 | 0.006 | 0 | -0.018 | 0.006 | 0.001 | -0.022 | 0.006 | 0 |
| Region: south-west | -0.014 | 0.006 | 0.029 | -0.012 | 0.007 | 0.063 | -0.013 | 0.006 | 0.039 | -0.003 | 0.006 | 0.656 | -0.011 | 0.007 | 0.094 |
| Region: West Midlands | -0.033 | 0.006 | 0 | -0.031 | 0.006 | 0 | -0.027 | 0.006 | 0 | -0.023 | 0.006 | 0 | -0.024 | 0.006 | 0 |
| Region: Yorkshire and the Humber | -0.029 | 0.007 | 0 | -0.02 | 0.007 | 0.002 | -0.021 | 0.006 | 0.001 | -0.017 | 0.006 | 0.008 | -0.021 | 0.007 | 0.002 |
| SEND: SEND | -0.04 | 0.001 | 0 | -0.037 | 0.001 | 0 | -0.05 | 0.001 | 0 | -0.057 | 0.001 | 0 | -0.045 | 0.001 | 0 |
Table E1.6 Full model results of analyses on probability of attaining grade 4 and above in GCSE
| Model term | 2018 estimate | 2018 SE | 2018 p | 2019 estimate | 2019 SE | 2019 p | 2020 estimate | 2020 SE | 2020 p | 2021 estimate | 2021 SE | 2021 p | 2022 estimate | 2022 SE | 2022 p |
|---|---|---|---|---|---|---|---|---|---|---|---|---|---|---|---|
| Intercept α | 0.815 | 0.018 | 0 | 0.814 | 0.016 | 0 | 0.933 | 0.014 | 0 | 0.918 | 0.012 | 0 | 0.867 | 0.015 | 0 |
| Centre Type: Free | -0.031 | 0.012 | 0.01 | -0.036 | 0.012 | 0.004 | -0.015 | 0.01 | 0.145 | -0.02 | 0.01 | 0.045 | -0.056 | 0.012 | 0 |
| Centre Type: FurE | -0.162 | 0.02 | 0 | -0.216 | 0.019 | 0 | -0.205 | 0.016 | 0 | -0.178 | 0.015 | 0 | -0.264 | 0.018 | 0 |
| Centre Type: Indp | 0.315 | 0.006 | 0 | 0.314 | 0.006 | 0 | 0.248 | 0.006 | 0 | 0.208 | 0.005 | 0 | 0.199 | 0.006 | 0 |
| Centre Type: Other | -0.221 | 0.007 | 0 | -0.216 | 0.007 | 0 | -0.164 | 0.006 | 0 | -0.158 | 0.006 | 0 | -0.236 | 0.007 | 0 |
| Centre Type: SecComp | -0.004 | 0.004 | 0.341 | -0.005 | 0.004 | 0.275 | -0.001 | 0.004 | 0.889 | 0 | 0.003 | 0.995 | 0 | 0.004 | 0.984 |
| Centre Type: SecMod | -0.035 | 0.014 | 0.015 | -0.03 | 0.014 | 0.04 | -0.015 | 0.012 | 0.235 | -0.026 | 0.011 | 0.021 | -0.024 | 0.014 | 0.082 |
| Centre Type: SecSel | 0.098 | 0.013 | 0 | 0.091 | 0.013 | 0 | 0.067 | 0.011 | 0 | 0.062 | 0.01 | 0 | 0.074 | 0.013 | 0 |
| Centre Type: Sixth | 0.021 | 0.045 | 0.635 | 0.085 | 0.048 | 0.076 | 0.054 | 0.042 | 0.195 | 0.05 | 0.041 | 0.222 | 0.003 | 0.046 | 0.955 |
| Centre Type: Tert | -0.077 | 0.033 | 0.018 | -0.086 | 0.031 | 0.005 | -0.091 | 0.026 | 0.001 | -0.081 | 0.024 | 0.001 | -0.185 | 0.029 | 0 |
| Ethnicity: ABAN | 0.116 | 0.004 | 0 | 0.119 | 0.004 | 0 | 0.103 | 0.003 | 0 | 0.101 | 0.003 | 0 | 0.118 | 0.003 | 0 |
| Ethnicity: AIND | 0.097 | 0.003 | 0 | 0.092 | 0.003 | 0 | 0.07 | 0.002 | 0 | 0.07 | 0.002 | 0 | 0.088 | 0.002 | 0 |
| Ethnicity: AOTH | 0.095 | 0.003 | 0 | 0.092 | 0.003 | 0 | 0.07 | 0.003 | 0 | 0.076 | 0.003 | 0 | 0.087 | 0.003 | 0 |
| Ethnicity: APKN | 0.072 | 0.003 | 0 | 0.069 | 0.002 | 0 | 0.056 | 0.002 | 0 | 0.054 | 0.002 | 0 | 0.068 | 0.002 | 0 |
| Ethnicity: BAFR | 0.081 | 0.002 | 0 | 0.076 | 0.002 | 0 | 0.064 | 0.002 | 0 | 0.072 | 0.002 | 0 | 0.088 | 0.002 | 0 |
| Ethnicity: BCRB | -0.021 | 0.004 | 0 | -0.022 | 0.004 | 0 | -0.002 | 0.003 | 0.521 | -0.003 | 0.003 | 0.433 | -0.01 | 0.004 | 0.005 |
| Ethnicity: BOTH | 0.04 | 0.005 | 0 | 0.034 | 0.005 | 0 | 0.034 | 0.004 | 0 | 0.044 | 0.004 | 0 | 0.055 | 0.004 | 0 |
| Ethnicity: CHNE | 0.127 | 0.007 | 0 | 0.114 | 0.006 | 0 | 0.095 | 0.006 | 0 | 0.09 | 0.006 | 0 | 0.113 | 0.006 | 0 |
| Ethnicity: MOTH | 0.043 | 0.003 | 0 | 0.042 | 0.003 | 0 | 0.028 | 0.003 | 0 | 0.033 | 0.003 | 0 | 0.041 | 0.003 | 0 |
| Ethnicity: MWAS | 0.037 | 0.004 | 0 | 0.041 | 0.004 | 0 | 0.032 | 0.003 | 0 | 0.028 | 0.003 | 0 | 0.048 | 0.003 | 0 |
| Ethnicity: MWBA | 0.034 | 0.005 | 0 | 0.042 | 0.005 | 0 | 0.027 | 0.004 | 0 | 0.032 | 0.004 | 0 | 0.042 | 0.004 | 0 |
| Ethnicity: MWBC | -0.016 | 0.003 | 0 | -0.017 | 0.003 | 0 | -0.018 | 0.003 | 0 | -0.016 | 0.003 | 0 | -0.018 | 0.003 | 0 |
| Ethnicity: OOTH | 0.06 | 0.003 | 0 | 0.057 | 0.003 | 0 | 0.042 | 0.003 | 0 | 0.048 | 0.003 | 0 | 0.057 | 0.003 | 0 |
| Ethnicity: WIRI | 0.024 | 0.007 | 0.001 | 0.02 | 0.007 | 0.003 | 0.008 | 0.007 | 0.225 | 0.024 | 0.006 | 0 | 0.019 | 0.007 | 0.005 |
| Ethnicity: WIRT | -0.127 | 0.029 | 0 | -0.094 | 0.024 | 0 | -0.09 | 0.021 | 0 | -0.123 | 0.022 | 0 | -0.091 | 0.022 | 0 |
| Ethnicity: WOTH | 0.04 | 0.002 | 0 | 0.036 | 0.002 | 0 | 0.025 | 0.002 | 0 | 0.033 | 0.002 | 0 | 0.047 | 0.002 | 0 |
| Ethnicity: WROM | -0.238 | 0.009 | 0 | -0.229 | 0.009 | 0 | -0.244 | 0.008 | 0 | -0.252 | 0.008 | 0 | -0.193 | 0.008 | 0 |
| Ethnicity: Unknown | 0.001 | 0.004 | 0.85 | -0.006 | 0.004 | 0.084 | -0.007 | 0.003 | 0.033 | 0 | 0.003 | 0.972 | 0.008 | 0.003 | 0.006 |
| FSM: FSM | -0.085 | 0.001 | 0 | -0.086 | 0.001 | 0 | -0.094 | 0.001 | 0 | -0.099 | 0.001 | 0 | -0.103 | 0.001 | 0 |
| FSM: Unknown | -0.102 | 0.014 | 0 | -0.095 | 0.013 | 0 | -0.015 | 0.013 | 0.255 | 0.001 | 0.012 | 0.933 | 0.003 | 0.013 | 0.795 |
| Gender: Male | -0.072 | 0.001 | 0 | -0.073 | 0.001 | 0 | -0.066 | 0.001 | 0 | -0.05 | 0.001 | 0 | -0.049 | 0.001 | 0 |
| Deprivation: Very low | 0.051 | 0.001 | 0 | 0.051 | 0.001 | 0 | 0.035 | 0.001 | 0 | 0.038 | 0.001 | 0 | 0.043 | 0.001 | 0 |
| Deprivation: Low | 0.026 | 0.001 | 0 | 0.027 | 0.001 | 0 | 0.021 | 0.001 | 0 | 0.021 | 0.001 | 0 | 0.024 | 0.001 | 0 |
| Deprivation: High | -0.029 | 0.001 | 0 | -0.028 | 0.001 | 0 | -0.022 | 0.001 | 0 | -0.021 | 0.001 | 0 | -0.022 | 0.001 | 0 |
| Deprivation: Very high | -0.055 | 0.001 | 0 | -0.052 | 0.001 | 0 | -0.041 | 0.001 | 0 | -0.044 | 0.001 | 0 | -0.045 | 0.001 | 0 |
| Deprivation: Unknown | -0.02 | 0.01 | 0.039 | -0.016 | 0.01 | 0.091 | -0.017 | 0.01 | 0.074 | -0.006 | 0.009 | 0.545 | -0.016 | 0.011 | 0.139 |
| Major language: NotEnglish | 0.003 | 0.002 | 0.087 | 0.001 | 0.002 | 0.523 | -0.004 | 0.002 | 0.011 | 0.002 | 0.001 | 0.106 | 0.009 | 0.001 | 0 |
| Major language: Unknown | 0.002 | 0.01 | 0.811 | -0.008 | 0.009 | 0.383 | -0.045 | 0.008 | 0 | -0.035 | 0.007 | 0 | -0.027 | 0.007 | 0 |
| Prior attainment: Very low | -0.391 | 0.001 | 0 | -0.388 | 0.001 | 0 | -0.358 | 0.001 | 0 | -0.35 | 0.001 | 0 | -0.367 | 0.001 | 0 |
| Prior attainment: Low | -0.157 | 0.001 | 0 | -0.158 | 0.001 | 0 | -0.119 | 0.001 | 0 | -0.105 | 0.001 | 0 | -0.119 | 0.001 | 0 |
| Prior attainment: High | 0.103 | 0.001 | 0 | 0.103 | 0.001 | 0 | 0.059 | 0.001 | 0 | 0.056 | 0.001 | 0 | 0.073 | 0.001 | 0 |
| Prior attainment: Very high | 0.149 | 0.001 | 0 | 0.152 | 0.001 | 0 | 0.078 | 0.001 | 0 | 0.073 | 0.001 | 0 | 0.104 | 0.001 | 0 |
| Prior attainment: Unknown | -0.146 | 0.001 | 0 | -0.146 | 0.001 | 0 | -0.161 | 0.001 | 0 | -0.167 | 0.001 | 0 | -0.15 | 0.001 | 0 |
| Region: East Midlands | -0.031 | 0.007 | 0 | -0.027 | 0.007 | 0 | -0.018 | 0.006 | 0.004 | -0.014 | 0.006 | 0.013 | -0.015 | 0.007 | 0.037 |
| Region: East of England | -0.01 | 0.007 | 0.14 | -0.015 | 0.007 | 0.023 | -0.008 | 0.006 | 0.147 | -0.001 | 0.005 | 0.915 | -0.01 | 0.006 | 0.138 |
| Region: London | 0.022 | 0.006 | 0 | 0.024 | 0.006 | 0 | 0.025 | 0.005 | 0 | 0.02 | 0.005 | 0 | 0.012 | 0.006 | 0.047 |
| Region: north-east | -0.023 | 0.009 | 0.012 | -0.027 | 0.009 | 0.003 | -0.015 | 0.008 | 0.048 | -0.01 | 0.007 | 0.172 | -0.018 | 0.009 | 0.037 |
| Region: north-west | -0.025 | 0.006 | 0 | -0.026 | 0.006 | 0 | -0.019 | 0.005 | 0 | -0.014 | 0.005 | 0.004 | -0.021 | 0.006 | 0.001 |
| Region: south-west | -0.005 | 0.007 | 0.472 | -0.004 | 0.007 | 0.548 | 0.005 | 0.006 | 0.413 | 0.008 | 0.005 | 0.136 | -0.001 | 0.007 | 0.843 |
| Region: West Midlands | -0.028 | 0.007 | 0 | -0.027 | 0.007 | 0 | -0.009 | 0.006 | 0.094 | -0.005 | 0.005 | 0.33 | -0.014 | 0.006 | 0.031 |
| Region: Yorkshire and the Humber | -0.02 | 0.007 | 0.004 | -0.013 | 0.007 | 0.06 | -0.011 | 0.006 | 0.055 | -0.01 | 0.006 | 0.082 | -0.015 | 0.007 | 0.024 |
| SEND: SEND | -0.177 | 0.001 | 0 | -0.169 | 0.001 | 0 | -0.185 | 0.001 | 0 | -0.176 | 0.001 | 0 | -0.158 | 0.001 | 0 |
Appendix E.2 - VTQ
Table E2.1 Average marginal effects on the probability of achieving top grades for Level 1/2 Technical Awards
| Factor | 2018 AME | 2018 p | 2019 AME | 2019 p | 2020 AME | 2020 p | 2021 AME | 2021 p | 2022 AME | 2022 p |
|---|---|---|---|---|---|---|---|---|---|---|
| Ethnicity: White Irish | -0.012 (0.016) | 0.428 | 0.006 (0.011) | 0.565 | -0.01 (0.012) | 0.388 | -0.01 (0.01) | 0.329 | -0.013 (0.009) | 0.157 |
| Ethnicity: AOWB | -0.006 (0.003) | 0.066 | 0 (0.002) | 0.865 | 0.001 (0.002) | 0.807 | 0.008 (0.002) | 0.001 | 0.002 (0.002) | 0.406 |
| Ethnicity: White and Black Caribbean | 0.003 (0.006) | 0.559 | -0.004 (0.004) | 0.325 | -0.004 (0.004) | 0.295 | -0.008 (0.004) | 0.026 | -0.005 (0.004) | 0.129 |
| Ethnicity: White and Black African | 0.004 (0.009) | 0.697 | 0.017 (0.007) | 0.023 | 0 (0.007) | 0.994 | 0.005 (0.006) | 0.354 | 0.004 (0.005) | 0.487 |
| Ethnicity: White and Asian | 0.024 (0.008) | 0.003 | 0.016 (0.006) | 0.005 | 0.019 (0.006) | 0.001 | 0.017 (0.005) | <0.001 | 0.014 (0.004) | 0.002 |
| Ethnicity: AOMMB | 0.022 (0.006) | <0.001 | 0.015 (0.004) | 0.001 | 0.009 (0.004) | 0.037 | 0.013 (0.004) | <0.001 | 0.011 (0.004) | 0.002 |
| Ethnicity: Indian | 0.032 (0.006) | <0.001 | 0.015 (0.004) | <0.001 | 0.042 (0.004) | <0.001 | 0.05 (0.004) | <0.001 | 0.029 (0.003) | <0.001 |
| Ethnicity: Pakistani | 0.011 (0.004) | 0.008 | 0.001 (0.003) | 0.621 | 0 (0.003) | 0.877 | 0.007 (0.002) | 0.006 | -0.005 (0.002) | 0.024 |
| Ethnicity: Bangladeshi | 0.035 (0.008) | <0.001 | 0.022 (0.005) | <0.001 | 0.021 (0.005) | <0.001 | 0.031 (0.005) | <0.001 | 0.018 (0.004) | <0.001 |
| Ethnicity: Chinese | 0.085 (0.02) | <0.001 | 0.039 (0.013) | 0.003 | 0.084 (0.014) | <0.001 | 0.084 (0.012) | <0.001 | 0.083 (0.011) | <0.001 |
| Ethnicity: AOAB | 0.02 (0.007) | 0.007 | -0.003 (0.005) | 0.516 | 0.029 (0.005) | <0.001 | 0.023 (0.004) | <0.001 | 0.019 (0.004) | <0.001 |
| Ethnicity: African | 0.007 (0.005) | 0.14 | 0.009 (0.003) | 0.006 | -0.008 (0.003) | 0.007 | 0.002 (0.003) | 0.492 | 0.006 (0.003) | 0.015 |
| Ethnicity: Caribbean | -0.002 (0.006) | 0.778 | 0.008 (0.005) | 0.1 | -0.006 (0.005) | 0.203 | 0.004 (0.005) | 0.441 | 0.003 (0.005) | 0.527 |
| Ethnicity: AOBACB | -0.003 (0.008) | 0.745 | 0.006 (0.006) | 0.314 | 0.016 (0.007) | 0.017 | -0.002 (0.006) | 0.78 | 0.003 (0.006) | 0.645 |
| Ethnicity: AOEG | -0.001 (0.007) | 0.844 | -0.002 (0.005) | 0.678 | 0.014 (0.005) | 0.003 | 0.01 (0.004) | 0.018 | 0.002 (0.004) | 0.629 |
| Ethnicity: Unknown | -0.002 (0.007) | 0.723 | -0.016 (0.004) | <0.001 | -0.011 (0.005) | 0.013 | -0.008 (0.004) | 0.032 | -0.004 (0.004) | 0.311 |
| Gender: Male | -0.034 (0.002) | <0.001 | -0.014 (0.001) | <0.001 | -0.075 (0.001) | <0.001 | -0.067 (0.001) | <0.001 | -0.05 (0.001) | <0.001 |
| Gender: Unknown | 0.397 (0.03) | <0.001 | 0.296 (0.02) | <0.001 | -0.104 (0.034) | 0.002 | -0.079 (0.017) | <0.001 | -0.007 (0.017) | 0.662 |
| SEND: Yes | -0.033 (0.003) | <0.001 | -0.03 (0.002) | <0.001 | -0.051 (0.002) | <0.001 | -0.053 (0.002) | <0.001 | -0.04 (0.001) | <0.001 |
| SEND: Unknown | -0.015 (0.01) | 0.124 | 0.039 (0.011) | <0.001 | -0.002 (0.012) | 0.858 | -0.005 (0.011) | 0.659 | 0.021 (0.031) | 0.488 |
| FSM: Yes | -0.019 (0.002) | <0.001 | -0.02 (0.001) | <0.001 | -0.033 (0.001) | <0.001 | -0.015 (0.004) | <0.001 | -0.034 (0.001) | <0.001 |
| FSM: Unknown | 0.022 (0.01) | 0.031 | 0.022 (0.008) | 0.005 | 0.013 (0.008) | 0.119 | 0.062 (0.01) | <0.001 | -0.01 (0.028) | 0.711 |
| IDACI: Very low | 0.013 (0.002) | <0.001 | 0.013 (0.002) | <0.001 | 0.016 (0.002) | <0.001 | 0.026 (0.002) | <0.001 | 0.017 (0.001) | <0.001 |
| IDACI: Low | 0.004 (0.002) | 0.068 | 0.007 (0.002) | <0.001 | 0.003 (0.002) | 0.099 | 0.011 (0.001) | <0.001 | 0.008 (0.001) | <0.001 |
| IDACI: High | -0.002 (0.002) | 0.231 | -0.001 (0.002) | 0.471 | -0.009 (0.002) | <0.001 | -0.007 (0.001) | <0.001 | -0.001 (0.001) | 0.43 |
| IDACI: Very high | -0.005 (0.002) | 0.025 | -0.003 (0.002) | 0.076 | -0.004 (0.002) | 0.018 | -0.013 (0.001) | <0.001 | -0.001 (0.001) | 0.427 |
| IDACI: Unknown | -0.005 (0.011) | 0.657 | -0.015 (0.007) | 0.029 | -0.009 (0.011) | 0.408 | 0.01 (0.011) | 0.372 | 0.003 (0.013) | 0.82 |
| Prior attainment: Very low | -0.043 (0.003) | <0.001 | -0.033 (0.002) | <0.001 | -0.065 (0.002) | <0.001 | -0.064 (0.002) | <0.001 | -0.051 (0.002) | <0.001 |
| Prior attainment: Low | -0.028 (0.003) | <0.001 | -0.02 (0.002) | <0.001 | -0.036 (0.002) | <0.001 | -0.034 (0.002) | <0.001 | -0.028 (0.001) | <0.001 |
| Prior attainment: High | 0.041 (0.003) | <0.001 | 0.037 (0.002) | <0.001 | 0.057 (0.002) | <0.001 | 0.049 (0.002) | <0.001 | 0.042 (0.002) | <0.001 |
| Prior attainment: Very high | 0.13 (0.007) | <0.001 | 0.117 (0.004) | <0.001 | 0.18 (0.003) | <0.001 | 0.173 (0.003) | <0.001 | 0.146 (0.003) | <0.001 |
| Prior attainment: Unknown | -0.003 (0.002) | 0.09 | 0.003 (0.001) | 0.027 | 0.003 (0.002) | 0.081 | 0.001 (0.001) | 0.39 | 0.006 (0.001) | <0.001 |
Table E2.2 Average marginal effects on the probability of achieving top grades for Level 1/2 Technical Certificates
| Factor | 2018 AME | 2018 p | 2019 AME | 2019 p | 2020 AME | 2020 p | 2021 AME | 2021 p | 2022 AME | 2022 p |
|---|---|---|---|---|---|---|---|---|---|---|
| Ethnicity: White Irish | -0.188 (0.099) | 0.056 | 0.037 (0.076) | 0.628 | -0.046 (0.072) | 0.521 | 0.136 (0.08) | 0.089 | 0.029 (0.054) | 0.584 |
| Ethnicity: AOWB | -0.014 (0.018) | 0.427 | -0.013 (0.01) | 0.181 | -0.004 (0.014) | 0.796 | -0.01 (0.011) | 0.372 | -0.032 (0.008) | <0.001 |
| Ethnicity: White and Black Caribbean | -0.093 (0.087) | 0.282 | -0.147 (0.033) | <0.001 | -0.035 (0.04) | 0.38 | -0.034 (0.025) | 0.18 | -0.024 (0.024) | 0.328 |
| Ethnicity: White and Black African | -0.101 (0.111) | 0.362 | -0.193 (0.041) | <0.001 | -0.04 (0.059) | 0.498 | -0.045 (0.041) | 0.279 | -0.042 (0.038) | 0.266 |
| Ethnicity: White and Asian | -0.123 (0.082) | 0.132 | -0.078 (0.036) | 0.031 | -0.074 (0.047) | 0.118 | 0.001 (0.039) | 0.981 | 0.016 (0.032) | 0.609 |
| Ethnicity: AOMMB | -0.083 (0.085) | 0.327 | -0.071 (0.036) | 0.048 | -0.027 (0.038) | 0.469 | -0.03 (0.026) | 0.259 | -0.038 (0.022) | 0.088 |
| Ethnicity: Indian | -0.11 (0.042) | 0.008 | -0.033 (0.02) | 0.112 | -0.049 (0.022) | 0.025 | 0.003 (0.022) | 0.872 | -0.012 (0.018) | 0.485 |
| Ethnicity: Pakistani | -0.11 (0.046) | 0.017 | -0.083 (0.021) | <0.001 | -0.033 (0.02) | 0.096 | -0.044 (0.015) | 0.003 | -0.023 (0.015) | 0.118 |
| Ethnicity: Bangladeshi | -0.141 (0.071) | 0.046 | 0.008 (0.035) | 0.828 | 0.035 (0.029) | 0.228 | -0.005 (0.022) | 0.804 | -0.045 (0.023) | 0.048 |
| Ethnicity: Chinese | 0.016 (0.068) | 0.819 | -0.029 (0.038) | 0.454 | 0.075 (0.071) | 0.288 | 0.157 (0.091) | 0.084 | 0.061 (0.036) | 0.095 |
| Ethnicity: AOAB | -0.026 (0.043) | 0.547 | -0.082 (0.022) | <0.001 | -0.031 (0.024) | 0.202 | -0.019 (0.022) | 0.4 | -0.028 (0.018) | 0.117 |
| Ethnicity: African | -0.237 (0.052) | <0.001 | -0.1 (0.022) | <0.001 | -0.049 (0.018) | 0.006 | -0.004 (0.017) | 0.801 | -0.027 (0.017) | 0.119 |
| Ethnicity: Caribbean | -0.179 (0.063) | 0.005 | -0.124 (0.029) | <0.001 | -0.111 (0.025) | <0.001 | -0.022 (0.025) | 0.385 | -0.075 (0.023) | 0.001 |
| Ethnicity: AOBACB | -0.25 (0.135) | 0.064 | -0.132 (0.041) | 0.001 | -0.049 (0.045) | 0.275 | -0.061 (0.024) | 0.011 | -0.049 (0.028) | 0.079 |
| Ethnicity: AOEG | -0.082 (0.042) | 0.048 | -0.032 (0.022) | 0.137 | -0.083 (0.021) | <0.001 | -0.038 (0.017) | 0.023 | -0.094 (0.014) | <0.001 |
| Ethnicity: Unknown | -0.081 (0.068) | 0.236 | -0.02 (0.039) | 0.603 | -0.031 (0.037) | 0.392 | 0.001 (0.031) | 0.973 | -0.032 (0.026) | 0.217 |
| Gender: Male | -0.088 (0.012) | <0.001 | -0.056 (0.007) | <0.001 | -0.032 (0.006) | <0.001 | -0.032 (0.006) | <0.001 | -0.015 (0.006) | 0.014 |
| Gender: Unknown | 0.256 (0.14) | 0.069 | -0.098 (0.059) | 0.095 | 0.062 (0.038) | 0.106 | 0.12 (0.015) | <0.001 | 0.099 (0.009) | <0.001 |
| SEND: Yes | 0.152 (0.084) | 0.068 | -0.018 (0.016) | 0.266 | -0.015 (0.01) | 0.141 | -0.015 (0.01) | 0.129 | -0.026 (0.011) | 0.017 |
| SEND: Unknown | 0.269 (0.046) | <0.001 | 0.176 (0.015) | <0.001 | 0.087 (0.01) | <0.001 | 0.072 (0.008) | <0.001 | 0.151 (0.012) | <0.001 |
| FSM: Yes | -0.042 (0.067) | 0.531 | -0.024 (0.021) | 0.244 | -0.019 (0.013) | 0.15 | 0 (0.012) | 0.986 | -0.02 (0.011) | 0.064 |
| FSM: Unknown | 0.206 (0.032) | <0.001 | 0.229 (0.013) | <0.001 | 0.204 (0.021) | <0.001 | 0.263 (0.022) | <0.001 | 0.003 (0.062) | 0.957 |
| IDACI: Very low | 0.043 (0.018) | 0.021 | 0.027 (0.012) | 0.02 | -0.012 (0.018) | 0.511 | 0.027 (0.019) | 0.14 | 0.014 (0.008) | 0.083 |
| IDACI: Low | 0.012 (0.018) | 0.521 | 0.014 (0.012) | 0.248 | -0.025 (0.018) | 0.154 | 0.016 (0.017) | 0.349 | -0.007 (0.008) | 0.4 |
| IDACI: High | -0.047 (0.022) | 0.032 | -0.017 (0.014) | 0.222 | -0.058 (0.019) | 0.002 | -0.004 (0.017) | 0.802 | -0.002 (0.008) | 0.795 |
| IDACI: Very high | -0.043 (0.029) | 0.143 | -0.068 (0.017) | <0.001 | -0.054 (0.019) | 0.004 | -0.04 (0.019) | 0.037 | -0.031 (0.009) | <0.001 |
| IDACI: Unknown | -0.162 (0.068) | 0.017 | -0.213 (0.036) | <0.001 | -0.155 (0.045) | 0.001 | -0.139 (0.043) | 0.001 | 0.038 (0.062) | 0.538 |
| Prior attainment: Very low | -0.174 (0.072) | 0.017 | -0.053 (0.019) | 0.005 | -0.042 (0.012) | 0.001 | -0.044 (0.011) | <0.001 | -0.005 (0.016) | 0.753 |
| Prior attainment: Low | -0.187 (0.069) | 0.006 | -0.044 (0.02) | 0.026 | -0.025 (0.013) | 0.045 | -0.035 (0.011) | 0.002 | -0.011 (0.016) | 0.512 |
| Prior attainment: High | 0.032 (0.042) | 0.451 | 0.064 (0.02) | 0.001 | 0.024 (0.015) | 0.102 | 0.008 (0.013) | 0.533 | 0.025 (0.018) | 0.164 |
| Prior attainment: Very high | 0.162 (0.039) | <0.001 | 0.148 (0.019) | <0.001 | 0.11 (0.018) | <0.001 | 0.059 (0.015) | <0.001 | 0.063 (0.02) | 0.002 |
| Prior attainment: Unknown | 0.099 (0.036) | 0.006 | 0.057 (0.016) | <0.001 | -0.008 (0.011) | 0.462 | -0.001 (0.01) | 0.909 | 0.054 (0.013) | <0.001 |
Table E2.3 Average marginal effects on the probability of achieving top grades for Level 3 Applied Generals
| Factor | 2018 AME | 2018 p | 2019 AME | 2019 p | 2020 AME | 2020 p | 2021 AME | 2021 p | 2022 AME | 2022 p |
|---|---|---|---|---|---|---|---|---|---|---|
| Ethnicity: White Irish | -0.006 (0.017) | 0.731 | -0.003 (0.015) | 0.834 | -0.047 (0.02) | 0.018 | -0.015 (0.019) | 0.433 | -0.004 (0.013) | 0.766 |
| Ethnicity: AOWB | -0.009 (0.004) | 0.036 | -0.01 (0.004) | 0.015 | -0.02 (0.005) | <0.001 | -0.028 (0.005) | <0.001 | -0.015 (0.003) | <0.001 |
| Ethnicity: White and Black Caribbean | -0.01 (0.008) | 0.201 | -0.018 (0.008) | 0.023 | -0.037 (0.01) | <0.001 | -0.031 (0.009) | 0.001 | -0.022 (0.006) | <0.001 |
| Ethnicity: White and Black African | -0.004 (0.013) | 0.753 | -0.037 (0.01) | <0.001 | -0.041 (0.015) | 0.005 | -0.05 (0.013) | <0.001 | -0.039 (0.007) | <0.001 |
| Ethnicity: White and Asian | -0.008 (0.009) | 0.342 | -0.02 (0.009) | 0.02 | -0.016 (0.012) | 0.188 | -0.024 (0.01) | 0.015 | -0.011 (0.006) | 0.06 |
| Ethnicity: AOMMB | -0.018 (0.006) | 0.004 | -0.011 (0.007) | 0.127 | -0.034 (0.009) | <0.001 | -0.038 (0.008) | <0.001 | -0.032 (0.005) | <0.001 |
| Ethnicity: Indian | -0.005 (0.005) | 0.344 | -0.001 (0.005) | 0.778 | -0.006 (0.007) | 0.36 | -0.009 (0.006) | 0.127 | 0.002 (0.004) | 0.639 |
| Ethnicity: Pakistani | -0.007 (0.004) | 0.107 | -0.016 (0.004) | <0.001 | -0.02 (0.005) | <0.001 | -0.029 (0.005) | <0.001 | -0.015 (0.003) | <0.001 |
| Ethnicity: Bangladeshi | 0.001 (0.007) | 0.876 | -0.012 (0.006) | 0.04 | -0.022 (0.008) | 0.004 | -0.024 (0.007) | 0.001 | -0.011 (0.005) | 0.012 |
| Ethnicity: Chinese | 0.02 (0.018) | 0.27 | 0.009 (0.017) | 0.594 | 0 (0.021) | 0.993 | 0.018 (0.021) | 0.385 | 0.01 (0.013) | 0.429 |
| Ethnicity: AOAB | -0.011 (0.006) | 0.048 | -0.02 (0.006) | 0.001 | -0.046 (0.008) | <0.001 | -0.037 (0.007) | <0.001 | -0.016 (0.005) | 0.001 |
| Ethnicity: African | -0.027 (0.004) | <0.001 | -0.031 (0.004) | <0.001 | -0.061 (0.005) | <0.001 | -0.069 (0.005) | <0.001 | -0.044 (0.003) | <0.001 |
| Ethnicity: Caribbean | -0.019 (0.007) | 0.005 | -0.031 (0.007) | <0.001 | -0.061 (0.009) | <0.001 | -0.035 (0.009) | <0.001 | -0.054 (0.005) | <0.001 |
| Ethnicity: AOBACB | -0.037 (0.007) | <0.001 | -0.023 (0.01) | 0.015 | -0.059 (0.011) | <0.001 | -0.053 (0.011) | <0.001 | -0.064 (0.005) | <0.001 |
| Ethnicity: AOEG | -0.012 (0.007) | 0.081 | -0.01 (0.007) | 0.152 | -0.028 (0.008) | 0.001 | -0.027 (0.008) | <0.001 | -0.022 (0.005) | <0.001 |
| Ethnicity: Unknown | -0.005 (0.008) | 0.536 | -0.004 (0.007) | 0.589 | -0.017 (0.009) | 0.048 | -0.029 (0.008) | 0.001 | -0.018 (0.006) | 0.001 |
| Gender: Male | -0.018 (0.002) | <0.001 | -0.015 (0.002) | <0.001 | -0.055 (0.002) | <0.001 | -0.063 (0.002) | <0.001 | -0.04 (0.002) | <0.001 |
| Gender: Unknown | -0.056 (0.003) | <0.001 | -0.068 (0.004) | <0.001 | -0.185 (0.005) | <0.001 | -0.093 (0.063) | 0.141 | -0.067 (0.033) | 0.044 |
| SEND: Yes | -0.005 (0.004) | 0.226 | 0.001 (0.004) | 0.811 | 0.003 (0.005) | 0.618 | -0.014 (0.005) | 0.003 | 0.011 (0.003) | <0.001 |
| SEND: Unknown | -0.011 (0.008) | 0.203 | 0.003 (0.008) | 0.703 | -0.029 (0.012) | 0.014 | -0.039 (0.011) | 0.001 | 0.01 (0.01) | 0.298 |
| FSM: Yes | 0.001 (0.004) | 0.881 | -0.001 (0.003) | 0.698 | -0.007 (0.004) | 0.081 | -0.016 (0.003) | <0.001 | -0.004 (0.002) | 0.067 |
| FSM: Unknown | 0.016 (0.006) | 0.004 | 0.012 (0.005) | 0.029 | 0.016 (0.006) | 0.005 | 0.051 (0.011) | <0.001 | -0.018 (0.017) | 0.275 |
| IDACI: Very low | 0.005 (0.003) | 0.06 | 0.005 (0.003) | 0.12 | -0.008 (0.004) | 0.029 | 0.016 (0.003) | <0.001 | 0.014 (0.002) | <0.001 |
| IDACI: Low | 0.003 (0.003) | 0.246 | 0 (0.003) | 0.886 | -0.008 (0.004) | 0.031 | 0.004 (0.003) | 0.182 | 0.007 (0.002) | 0.001 |
| IDACI: High | -0.002 (0.003) | 0.45 | 0 (0.003) | 0.942 | 0.005 (0.004) | 0.163 | -0.002 (0.003) | 0.634 | -0.005 (0.002) | 0.012 |
| IDACI: Very high | -0.002 (0.003) | 0.487 | 0.001 (0.003) | 0.762 | 0.023 (0.004) | <0.001 | 0 (0.003) | 0.914 | -0.011 (0.002) | <0.001 |
| IDACI: Unknown | 0.001 (0.011) | 0.919 | -0.014 (0.009) | 0.149 | -0.007 (0.014) | 0.642 | 0.007 (0.013) | 0.614 | 0.024 (0.016) | 0.146 |
| Prior attainment: Very low | -0.016 (0.002) | <0.001 | -0.021 (0.002) | <0.001 | -0.065 (0.003) | <0.001 | -0.08 (0.003) | <0.001 | -0.063 (0.003) | <0.001 |
| Prior attainment: Low | -0.011 (0.002) | <0.001 | -0.014 (0.002) | <0.001 | -0.036 (0.003) | <0.001 | -0.048 (0.003) | <0.001 | -0.042 (0.002) | <0.001 |
| Prior attainment: High | 0.027 (0.003) | <0.001 | 0.037 (0.003) | <0.001 | 0.062 (0.003) | <0.001 | 0.078 (0.003) | <0.001 | 0.063 (0.003) | <0.001 |
| Prior attainment: Very high | 0.125 (0.007) | <0.001 | 0.154 (0.007) | <0.001 | 0.234 (0.005) | <0.001 | 0.265 (0.005) | <0.001 | 0.229 (0.006) | <0.001 |
| Prior attainment: Unknown | 0.02 (0.003) | <0.001 | 0.029 (0.003) | <0.001 | 0.025 (0.004) | <0.001 | 0.017 (0.003) | <0.001 | 0.025 (0.003) | <0.001 |
Table E2.4 Average marginal effects on the probability of achieving top grades for Level 3 Tech Levels
| Factor | 2018 AME | 2018 p | 2019 AME | 2019 p | 2020 AME | 2020 p | 2021 AME | 2021 p | 2022 AME | 2022 p |
|---|---|---|---|---|---|---|---|---|---|---|
| Ethnicity: White Irish | 0.032 (0.052) | 0.532 | -0.05 (0.039) | 0.198 | 0.085 (0.07) | 0.224 | -0.004 (0.043) | 0.933 | 0.015 (0.028) | 0.582 |
| Ethnicity: AOWB | 0.004 (0.01) | 0.67 | -0.005 (0.009) | 0.595 | -0.016 (0.013) | 0.196 | -0.011 (0.01) | 0.262 | 0.001 (0.006) | 0.856 |
| Ethnicity: White and Black Caribbean | -0.043 (0.02) | 0.034 | 0 (0.027) | 0.993 | -0.026 (0.023) | 0.271 | -0.013 (0.023) | 0.574 | -0.021 (0.011) | 0.073 |
| Ethnicity: White and Black African | -0.032 (0.039) | 0.403 | -0.058 (0.029) | 0.045 | -0.055 (0.031) | 0.079 | -0.078 (0.026) | 0.003 | 0.007 (0.018) | 0.721 |
| Ethnicity: White and Asian | 0.001 (0.03) | 0.963 | -0.066 (0.021) | 0.001 | -0.004 (0.03) | 0.89 | -0.02 (0.025) | 0.418 | 0.01 (0.014) | 0.488 |
| Ethnicity: AOMMB | -0.028 (0.019) | 0.133 | -0.043 (0.023) | 0.058 | 0.041 (0.024) | 0.083 | -0.028 (0.018) | 0.115 | -0.011 (0.011) | 0.343 |
| Ethnicity: Indian | -0.031 (0.015) | 0.034 | -0.015 (0.016) | 0.352 | -0.031 (0.016) | 0.056 | 0.019 (0.017) | 0.247 | 0.026 (0.011) | 0.018 |
| Ethnicity: Pakistani | -0.016 (0.015) | 0.285 | -0.053 (0.013) | <0.001 | -0.041 (0.014) | 0.003 | -0.049 (0.013) | <0.001 | -0.007 (0.008) | 0.345 |
| Ethnicity: Bangladeshi | -0.048 (0.022) | 0.028 | -0.027 (0.022) | 0.224 | 0.008 (0.026) | 0.75 | -0.007 (0.021) | 0.736 | 0.006 (0.013) | 0.659 |
| Ethnicity: Chinese | 0.027 (0.034) | 0.416 | 0.011 (0.04) | 0.78 | 0.043 (0.051) | 0.397 | -0.023 (0.038) | 0.544 | 0.091 (0.034) | 0.007 |
| Ethnicity: AOAB | -0.019 (0.016) | 0.244 | -0.022 (0.018) | 0.224 | -0.017 (0.019) | 0.382 | -0.038 (0.017) | 0.025 | 0.018 (0.012) | 0.136 |
| Ethnicity: African | -0.078 (0.013) | <0.001 | -0.034 (0.014) | 0.018 | -0.053 (0.014) | <0.001 | -0.037 (0.013) | 0.005 | -0.03 (0.008) | <0.001 |
| Ethnicity: Caribbean | -0.049 (0.02) | 0.013 | -0.012 (0.023) | 0.593 | -0.038 (0.024) | 0.102 | -0.05 (0.019) | 0.007 | -0.022 (0.012) | 0.059 |
| Ethnicity: AOBACB | -0.049 (0.029) | 0.098 | -0.068 (0.025) | 0.006 | -0.014 (0.031) | 0.649 | -0.052 (0.023) | 0.021 | -0.024 (0.015) | 0.12 |
| Ethnicity: AOEG | -0.014 (0.02) | 0.493 | -0.062 (0.016) | <0.001 | -0.032 (0.02) | 0.111 | -0.044 (0.017) | 0.009 | 0.005 (0.011) | 0.644 |
| Ethnicity: Unknown | -0.045 (0.022) | 0.041 | -0.034 (0.023) | 0.134 | -0.024 (0.02) | 0.225 | -0.019 (0.022) | 0.369 | 0.012 (0.012) | 0.339 |
| Gender: Male | -0.002 (0.004) | 0.568 | -0.008 (0.004) | 0.045 | -0.041 (0.005) | <0.001 | -0.048 (0.004) | <0.001 | -0.02 (0.003) | <0.001 |
| Gender: Unknown | -0.049 (0.006) | <0.001 | -0.044 (0.06) | 0.468 | 0.027 (0.026) | 0.298 | 0.038 (0.024) | 0.113 | 0.04 (0.009) | <0.001 |
| SEND: Yes | -0.013 (0.01) | 0.184 | -0.019 (0.009) | 0.04 | 0.002 (0.01) | 0.829 | -0.014 (0.009) | 0.106 | 0.022 (0.007) | 0.001 |
| SEND: Unknown | 0.029 (0.006) | <0.001 | 0.038 (0.007) | <0.001 | 0.013 (0.009) | 0.137 | 0.029 (0.007) | <0.001 | 0.051 (0.006) | <0.001 |
| FSM: Yes | -0.004 (0.011) | 0.717 | 0.008 (0.011) | 0.471 | -0.011 (0.009) | 0.235 | -0.009 (0.008) | 0.223 | -0.007 (0.005) | 0.119 |
| FSM: Unknown | 0.087 (0.013) | <0.001 | 0.095 (0.013) | <0.001 | 0.072 (0.016) | <0.001 | 0.091 (0.013) | <0.001 | 0.007 (0.032) | 0.833 |
| IDACI: Very low | 0.015 (0.007) | 0.029 | 0.021 (0.008) | 0.008 | 0.003 (0.009) | 0.761 | 0.019 (0.009) | 0.044 | 0.009 (0.004) | 0.033 |
| IDACI: Low | 0.01 (0.007) | 0.123 | 0.012 (0.008) | 0.12 | -0.003 (0.009) | 0.728 | -0.006 (0.009) | 0.524 | 0.002 (0.004) | 0.636 |
| IDACI: High | -0.004 (0.007) | 0.581 | 0.003 (0.008) | 0.684 | -0.017 (0.009) | 0.073 | -0.032 (0.009) | <0.001 | -0.012 (0.004) | 0.004 |
| IDACI: Very high | -0.009 (0.008) | 0.221 | -0.013 (0.009) | 0.155 | 0.006 (0.01) | 0.545 | -0.033 (0.009) | <0.001 | -0.018 (0.004) | <0.001 |
| IDACI: Unknown | -0.017 (0.023) | 0.47 | -0.047 (0.022) | 0.033 | -0.043 (0.022) | 0.05 | -0.07 (0.024) | 0.004 | 0 (0.028) | 0.996 |
| Prior attainment: Very low | -0.025 (0.005) | <0.001 | -0.043 (0.006) | <0.001 | -0.064 (0.006) | <0.001 | -0.07 (0.006) | <0.001 | -0.053 (0.005) | <0.001 |
| Prior attainment: Low | -0.009 (0.005) | 0.083 | -0.02 (0.006) | 0.001 | -0.037 (0.006) | <0.001 | -0.034 (0.005) | <0.001 | -0.037 (0.004) | <0.001 |
| Prior attainment: High | 0.038 (0.007) | <0.001 | 0.049 (0.008) | <0.001 | 0.068 (0.008) | <0.001 | 0.082 (0.007) | <0.001 | 0.055 (0.006) | <0.001 |
| Prior attainment: Very high | 0.161 (0.013) | <0.001 | 0.182 (0.012) | <0.001 | 0.243 (0.011) | <0.001 | 0.249 (0.01) | <0.001 | 0.214 (0.01) | <0.001 |
| Prior attainment: Unknown | 0.062 (0.008) | <0.001 | 0.067 (0.008) | <0.001 | 0.027 (0.007) | <0.001 | 0.029 (0.006) | <0.001 | 0.028 (0.005) | <0.001 |