Statutory Security of Supply Report 2024
Published 19 December 2024

© Crown copyright 2024
This publication is licensed under the terms of the Open Government Licence v3.0 except where otherwise stated. To view this licence, visit nationalarchives.gov.uk/doc/open-government-licence/version/3 or write to the Information Policy Team, The National Archives, Kew, London TW9 4DU, or email: psi@nationalarchives.gov.uk.
Where we have identified any third party copyright information you will need to obtain permission from the copyright holders concerned.
This publication is available at https://www.gov.uk/government/publications/statutory-security-of-supply-report-2024/statutory-security-of-supply-report-2024
Presented to Parliament pursuant to Section 172 of the Energy Act 2004 (as amended by Section 80 of the Energy Act 2011)
Ordered by the House of Commons to be printed on 19 December 2024
HC 435
Introduction
This report is prepared jointly by the Secretary of State for Energy Security and Net Zero and the Gas and Electricity Markets Authority (GEMA) as required by section 172 of the Energy Act 2004 (as amended by section 80 of the Energy Act 2011). It deals with the availability of electricity and gas for meeting the reasonable demands of consumers in Great Britain (GB), considering the short and long-term, and includes the electricity supply capacity required to meet demands of consumers for the supply of electricity in GB, covering the subsequent four calendar years.
Although security of supply of oil is not included as part of the statutory requirement, this report includes a section produced by the Department for Energy Security and Net Zero (DESNZ) on oil security of supply for general information.
The technical data presented here has been produced from analysis conducted by DESNZ, Office of Gas and Electricity Markets, (Ofgem), National Gas Transmission (NGT) acting in its capacity as the Gas System Operator (GSO) and the National Energy System Operator (NESO).
The statistics underpinning this document are for GB only where possible. However, in some cases where it is not possible to split the GB data out from the United Kingdom (UK) data, UK statistics have been used. Where this is the case, they have been referred to as UK in the accompanying text.
Executive summary
The Statutory Security of Supply Report (SSSR) 2024 concludes that GB is expected to have sufficient supplies of electricity and gas to meet consumers’ demands over the short and long-term. GB has also continued to maintain good access to oil supplies. Government will continue to closely monitor security of supply.
Electricity security of supply
GB has demonstrated consistent success in ensuring secure electricity supplies and is expected to continue this trend in the future. NESO forecasts sufficient electricity capacity to meet this winter’s demand, with a derated margin of 5.2GW (8.8%) of the average peak cold spell demand for this winter. This is an increase from the 4.4GW (7.4% of peak demand) last winter.
The Capacity Market (CM) is GB’s key mechanism for ensuring there continues to be sufficient electricity capacity margin to meet peak demand. The required electricity capacity needed to ensure security of supply over the medium term has mostly been procured via four-year ahead auctions, with the remainder to be procured through future ‘top up’ auctions held in the year before delivery. While most of this capacity comes from existing units, the CM has also procured new build units for delivery out to 2027/2028. This includes a pipeline of electricity storage and interconnector projects which is scheduled for completion by 2028, building on the 7.5GW of electricity storage and 9.8 GW of interconnector capacity currently operational in GB.
Gas security of supply
GB’s gas system has reliably delivered secure gas supplies to date and is well-positioned to continue doing so. For Winter 2024/2025 National Gas (NG) forecasts GB has sufficient capability to meet peak (1-20) demand. Overall, demands on the National Transmission System (including exports) are forecast to reduce this winter to more normal levels following the peak in winter 2022/2023.
As domestic gas production declines, GB will continue to benefit from a diverse set of import routes and the second largest liquified natural gas (LNG) import infrastructure capacity in Europe. Long-term investment, at the Grain LNG terminal, to expand import capacity will increase storage and regassification capacity from mid-2025.
Natural gas currently plays a critical role in the GB energy system, providing around a third of our power and heating most of our homes. While gas demand is expected to decline, the system will continue to play an important role as GB decarbonises. As long as natural gas remains an important part of our energy mix, government will continue to ensure that consumers can rely on secure gas supplies via an appropriately resilient and flexible network that is also efficiently regulated.
Oil security of supply
GB has continued to maintain good access to oil supplies. In April 2024, the UK completed rebuilding oil stocks, following an IEA-led coordinated release to protect global oil market prices in the aftermath of Russia’s illegal invasion of Ukraine. The resilience of the UK oil sector is evident in its ability to adapt, ensuring a steady supply amid geopolitical shifts and fluctuating demand. Government is strengthening resilience through the Energy Act 2023 which creates a duty on core fuel sector participants to report a notifiable incident.
Ongoing domestic production and refining, import diversity and sustainable consumption will all remain essential features of the evolving oil market. In response to PetroIneos’ decision to convert the Grangemouth refinery into a fuel import terminal, the UK government has worked closely with the Scottish government and the private sector, including PetroIneos, to guarantee continuity of fuel supply to Scotland, and has invested £10m to support the workforce and community and launched Project Willow to explore future opportunities for the site, with the National Wealth Fund standing ready to consider any commercially viable propositions.
Electricity
Introduction
GB’s electricity system continues to deliver secure electricity supply, benefitting from a diverse electricity mix which ensures that households, businesses, and industry can be confident they can get the electricity they need. Most of the required electricity capacity to ensure security of supply has already been procured via the CM four year ahead auctions, with the remainder to be procured through future ‘top up’ auctions held in the year before delivery.
The National Energy System Operator (NESO) launched on 1 October 2024 and building on its previous experience as the Electricity System Operator (ESO), is the new public corporation, responsible for planning Britain’s electricity and gas networks and operating the electricity system. Central to NESO’s role is a whole system approach to strengthening energy security, helping deliver net zero and ensuring household bills are affordable in the long term.
For winter 2024/25, NESO has determined that we have sufficient available capacity to meet demand with an increased margin compared to last year. Their projections and analysis are set out in their yearly winter assessment titled the Winter Outlook Report. [footnote 1] In the information below, we provide more detail on supply, demand and available operational tools that allow NESO to safely manage the electricity system.
The government continues to work closely with NESO, Ofgem and all relevant stakeholders to monitor the electricity supply horizon, and to ensure the system operator has the right tools so the market can respond to fluctuations in supply and demand.
The Review of Electricity Market Arrangements (REMA), a major review into the design of Britain’s electricity market, was first announced in April 2022. [footnote 2] REMA’s objective is to identify and implement the reforms needed to drive the necessary investment in, and efficient operation of, a secure, low carbon electricity system, whilst ensuring affordability for consumers and attractiveness for investors. The first REMA consultation ran between July and October 2022, followed by a summary of responses published in March 2023. [footnote 3] The second REMA consultation narrowed down the options for reform and was published in March 2024. [footnote 4] The government is continuing to develop, refine, and narrow down options for reform, working closely with industry and stakeholders.
NESO published ‘Clean Power 2030: Advice on achieving clean power for Great Britain by 2030’ [footnote 5] this year, in response to a government commission on how to achieve clean power by 2030. The publication concludes that it is possible to build, connect and operate a clean power system for Great Britain by 2030, while maintaining security of supply. Government has responded to this advice in the Clean Power 2030 Action Plan.
Demand
NESO produce electricity demand projections including the Future Energy Scenarios (FES), which provide data for input into network planning processes, and the Five Year Forecast designed for use in security of supply planning and capacity market auctions.
- The Future Energy Scenarios (FES) [footnote 6]: NESO framework has shifted this year from scenarios to pathways, featuring three new net zero pathways (see below). The framework also includes a ‘Counterfactual’, which does not meet the 2050 net zero target. This transition is reflected in the new publication name - Future Energy Scenarios: NESO Pathways to Net Zero.
- The Five Year Forecast [footnote 7]: retained in the NESO data workbook provides the best estimate of annual and peak demand to 2029, as opposed to the strategic wide view taken by the net zero pathways. It is intended to be used in security of supply planning and capacity market auctions.
NESO FES
This year’s Future Energy Scenarios (FES), evolving from ‘scenarios’ to three net zero ‘pathways’ and a counterfactual, explore narrower ranges and strategic, credible choices to propel us on the route to decarbonisation.
Net Zero Pathways:
- Holistic Transition - net zero met through a mix of electrification and hydrogen, with hydrogen mainly around industrial clusters. Consumer engagement in the transition is very strong with smart homes and electric vehicles providing flexibility to the grid.
- Electric Engagement - net zero met through mainly electrified demand. Consumers are highly engaged in the energy transition through smart technologies that reduce energy demand, using technologies such as electric heat pumps and electric vehicles.
- Hydrogen Evolution - net zero met through fast progress for hydrogen in industry and heat. Many consumers will have hydrogen boilers, although energy efficiency will be key to reducing cost. There are low levels of consumer engagement. Hydrogen will be prevalent for heavy goods vehicles, but electric vehicle uptake is strong.
- Counterfactual - net zero missed, although some progress is made for decarbonisation compared to today. While home insulation improves, there is still a heavy reliance on gas across all sectors, particularly power and space heating. Electric vehicle uptake is slower than the net zero pathways, but still displaces petrol and diesel.
Figure 1. Electricity average cold spell peak demand (including losses)

Source: NESO (2024) ‘Data Workbook’
Supply
Generated electricity is transmitted around GB to homes and businesses via a network of cables and wires. This is known as the supply of electricity. NESO are responsible for ensuring this transmission happens safely and effectively. The reliability standard is a set of guidelines that define the level of reliability that an electricity system must meet.
The government’s reliability standard for security of electricity supply is expressed as a Loss of Load Expectation (LOLE) of three hours per year. LOLE is a statistical measure based on an assessed range of scenarios and weather conditions. LOLE represents the number of hours per year in which supply is expected on average to be lower than demand under normal operation of the system. The LOLE metric is not a measure of the expected number of hours in which customers may be disconnected, but represents periods in which system feeds would not meet overall demand and the system operator would need to take additional actions to mitigate risk.
The de-rated capacity margin measures the amount of excess supply above forecast peak demand. De-rating means the capacity is adjusted to reflect the expected availability by fuel type or technology. It reflects the proportion of an electricity source which is likely to be technically available to generate at times of peak demand. [footnote 8]
The majority of the required electricity capacity to ensure security of supply and that GB expected margins remain within its reliability standard through to the 2027/28 delivery year has already been procured via the CM, with the remainder to be procured through future ‘top up’ auctions. [footnote 9] While most of this capacity comes from existing units, the Capacity Market (CM) has also procured new build units for delivery out to 2027/28.
For the 2025/26 delivery year, 1.9GW of new build generating capacity and 2.8GW of new build interconnector capacity has been secured. In 2026/27, 3.5GW of procured capacity is from new build generating units and 1GW of new build interconnector capacity has been secured. For 2027/28, there is 1.7GW of new build generation capacity and 1GW of new build interconnector capacity that has been procured.
Winter ahead assessment
NESO’s Winter Outlook Report for 2024/2025 shows sufficient available capacity to meet electricity demand in winter 2024/2025 with a derated margin of 5.2GW (8.8%) of the average peak cold spell demand for this winter and a LOLE of below 0.1 hours/year. This is an increase from 4.4GW (7.4% of peak demand) last winter. Their analysis shows that demand can be met under their credible range scenarios, though there may be times when they need to use their standard operational tools such as system notices. System notices are a routine way to communicate to the market and operate the system. They do not indicate that electricity supply is at risk, or an emergency situation will follow, but simply tell the market what is required.
NESO has the tools it needs to operate the electricity system reliably and can call on a range of technologies to balance electricity supply and demand, including gas-fired generation and flexible technologies such as batteries and consumer-led flexibility [footnote 10].
Figure 2. De-rated margin in relation to generation capacity and demand

Source: NESO (2024) ‘Winter Outlook 2024/2025’
The government, NESO, and Ofgem have taken a range of actions to mitigate risks and strengthen the security of GB’s electric supply for Winter 2024/2025. In June, NESO announced the intention to reintroduce the Demand Flexibility Service (DFS). Due to the improved outlook for this winter, NESO proposed several changes to the service design that would see the DFS evolve from an enhanced action to a multi-year service that can be used under normal market conditions. Ofgem approved this new iteration of DFS. [footnote 11]
Over the longer-term, the Government has recently commissioned NESO to produce the first Strategic Spatial Energy Plan (SSEP) to assess the optimal locations, quantities and types of energy infrastructure required, across a range of plausible futures, to meet future energy demand. Our intention is for the SSEP to directly feed into, and be published in time for, the Centralised Strategic Network Plan (CSNP) - a plan for transmission network infrastructure which NESO is also developing.
Capacity Market
Capacity auctions
The purpose of the CM is to ensure security of GB’s electricity supply at least cost to consumers, by providing all forms of capacity with the right incentives to be on the system and to provide capacity when needed. The CM ensures there is sufficient reliable capacity available during periods of electricity system stress, for example during cold, still periods with high demand and low wind generation.
The CM works by allowing eligible capacity providers to bid into a competitive auction to provide capacity. Successful capacity providers receive payments to be available to provide their capacity at times of system stress, such that the GB system operates within the Reliability Standard of 3 hours LOLE. These capacity payments incentivise the necessary investment to maintain and refurbish existing capacity, and to finance new capacity where necessary. Capacity providers face penalties if they fail to deliver against their capacity obligation – to provide electricity, or reduce demand, when required during a System Stress Event.
The CM is technology neutral and does not seek to procure allocated volumes of capacity from specific types of technology. All types of technology are able to participate except for capacity providers in receipt of support from other specific policy measures, provided they can demonstrate sufficient technical performance to contribute to security of electricity supply, and provided they comply with the CM’s emissions limits. [footnote 12]
The Electricity Settlements Company’s (ESC) records show that £1 billion was paid out to CM agreement holders for Delivery Year 2023/2024. [footnote 13]
Capacity auctions
There are two capacity auctions: the T-4 auction which secures capacity for the delivery year four years ahead, and the T-1 auction which secures capacity for the delivery year one year ahead.
T-1 Auction results for the delivery year 2024/2025
The T-1 auction for the delivery year 2024/2025 concluded on 20 February 2024 and secured 7.6GW of de-rated capacity at a clearing price of £35.79/kW per year. [footnote 14] A total of 9.5GW of de-rated capacity entered the auction, of which 80.8% received CM agreements. 6.2GW of awarded capacity is from existing generation capacity and 0.7GW is from new build generation capacity. The remaining capacity was awarded to CM participants leveraging consumer-led flexibility. Consumer-led flexibility refers to action taken by consumers to reduce or increase the amount of electricity they take off the grid at a particular time. In the Capacity Market Rules, consumer-led flexibility is defined as Proven Demand Side Response (DSR) and Unproven DSR. The DSR category is determined by whether a DSR Test is completed ahead of the auction prequalification period (Proven DSR) or following the auction prequalification period but ahead of the relevant Capacity Market delivery year (Unproven DSR). Under Capacity Market Rules, Unproven DSR requires the submission of a business plan at application detailing how it will acquire its submitted capacity offer. Proven DSR secured 0.2GW agreements and Unproven DSR 0.6GW agreements for the 2024/25 T-1 auctions.
Figure 3. T-1 Auction results breakdown by Capacity Agreements awarded by fuel type (de-rated capacity)

Source: NESO (2024)
T-4 Auction results for the delivery year 2027/2028
The T-4 auction for the delivery year 2027/2028 concluded on 27 February 2024 and secured 42.8GW of de-rated capacity at a clearing price of £65/kW per year. [footnote 15] A total of 43.4GW of de-rated capacity entered the auction, of which 98.8% received CM agreements. 33.2GW of awarded capacity is from existing generation capacity; 1.7GW from new build generation capacity; 5.5GW from existing interconnectors; and 1.7GW from new build interconnectors. The remaining capacity was awarded to unproven consumer-led flexibility (0.9GW), proven consumer-led flexibility (0.2GW) and refurbishing generating capacity (0.2GW).
Figure 4. T-4 Auction results breakdown by Capacity Agreements awarded by fuel type (de-rated capacity)

Source: NESO (2024).
Capacity procured in historical auctions for future delivery years
The majority of the capacity required to meet forecasted peak demand for the 2025/2026 (42.4GW), 2026/2027 (43.0GW) and 2027/2028 (42.8GW) delivery years has already been procured in historical T-4 CM auctions. For 2025/26, 1.9GW is new build generating capacity and 2.8GW is new build interconnector capacity. In 2026/27, 3.4GW of procured capacity is new build generating capacity and 1GW of new build interconnector capacity. For 2027/28, there is 1.7GW of new build generation capacity and 1GW of new build interconnector capacity that has been procured.
The CM has a robust set of Rules and Regulations that incentivise new build units to deliver their contracted capacity on time. CMUs must meet several milestones prior to receiving their first Capacity Payment. These milestones are evidenced through reports from Independent Technical Experts and include meeting the Financial Commitment Milestone of taking a Final Investment Decision and spending 10% of Capital Expenditure, as well as reaching the Substantial Completion Milestone by showing a CMU can deliver 90% of its obligated capacity.
The capacity for each delivery year will be topped up in the corresponding T-1 auctions.
Figure 5. Derated Capacity secured for 2025/26 delivery year by technology, in GW [footnote 16]
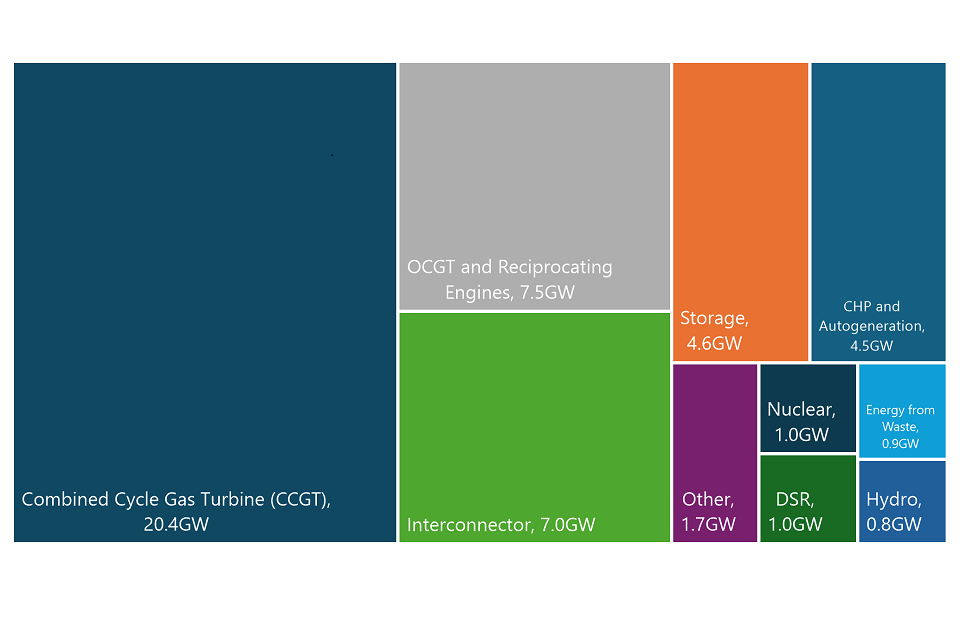
Source: NESO (2024) ‘Capacity Market Registers’
Figure 6. Derated Capacity secured for 2026/2027 delivery year by technology, in GW
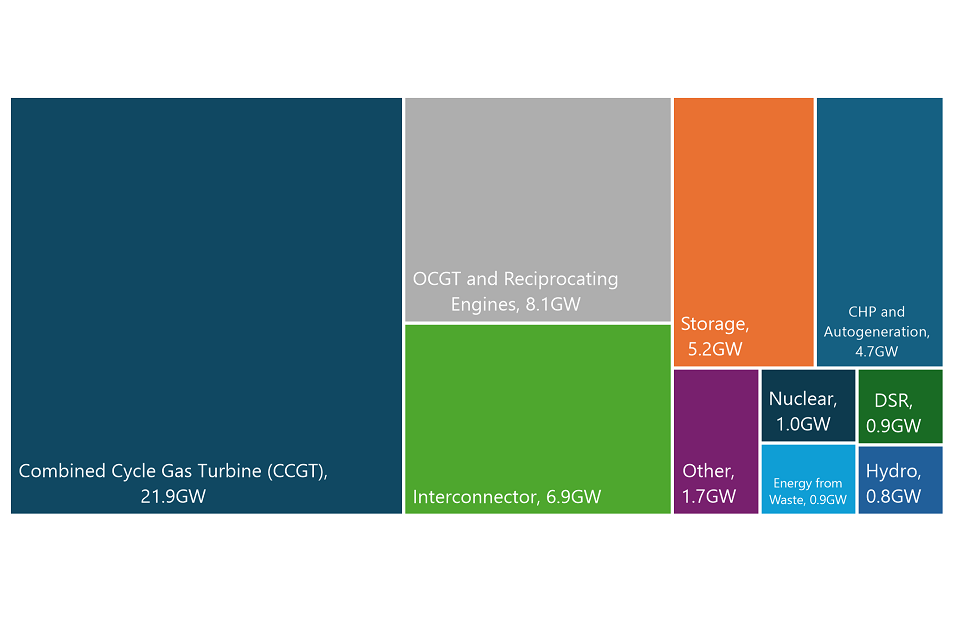
Source: NESO (2024) ‘Capacity Market Registers’
Figure 7. Derated Capacity secured for 2027/28 delivery year by technology, in GW
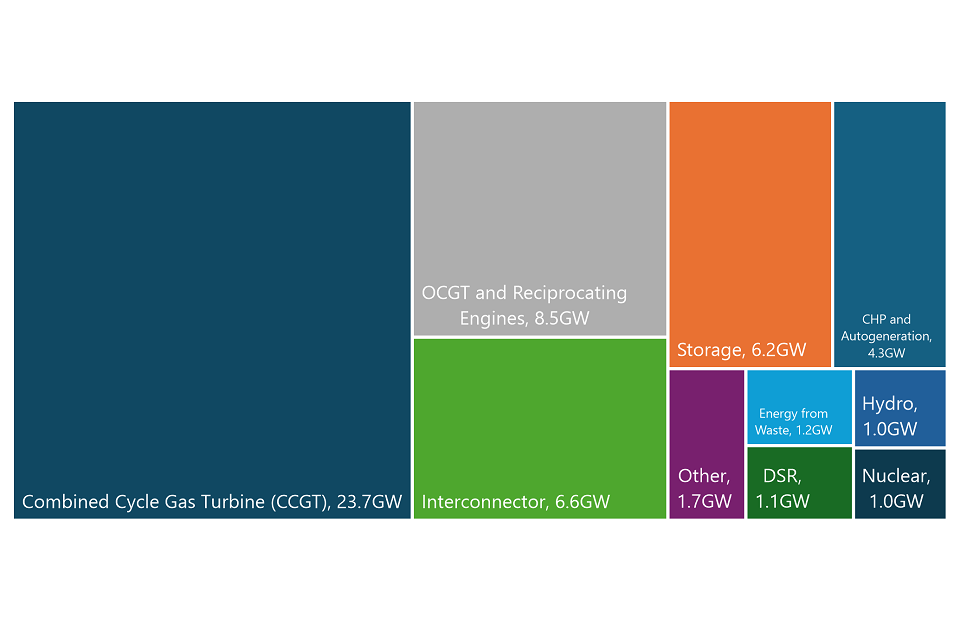
Source: NESO (2024) ‘Capacity Market Registers’
The next Capacity Market auctions
The next CM auctions will be held in March 2025. These will include a T-1 auction to top-up capacity for the 2025/26 Delivery Year and a T-4 auction to secure the bulk of the capacity for the 2028/29 Delivery Year.
NESO published the target capacity recommendations for the March 2025 CM auctions in its 2024 Electricity Capacity Report (ECR). For the T-1 Auction for the 2025/2026 Delivery Year this was 6.8 GW, to top up the 42.1GW already procured in the earlier T-4 auction for the 2025/2026 Delivery Year. For the 2028/2029 Delivery Year, NESO recommended a total target of 45.0GW.
The Secretary of State wrote to NESO on 18 July 2024 to set the CM auction targets. For the T-1 Auction, the target was set as 6.5GW. The Secretary of State set this target with consideration of the views of the DESNZ independent panel of technical experts (PTE). The PTE’s views are detailed in their annual report on the ECR. For the T-4 auction, the target was set as 44.0GW, with 1.0GW set aside for the future corresponding T-1 auction. The Secretary of State set this target in agreement with the NESO’s recommendation.
The Secretary of State may adjust the auction targets ahead of the auctions in March 2025, taking into account any updated advice from NESO. Final targets will be confirmed before the auctions are scheduled to be held.
Improvements to the Capacity Market
Changes over the last year in the CM have intended to improve security of supply and align with the Government’s clean power and net zero goals. The improvements we have made to the CM in the last year are set out below.
Capacity Market Phase 2 and Rule amendments to support auction liquidity
In October 2023, the government launched a consultation on the second phase of proposals (the ‘Phase 2’ consultation [footnote 17]) to improve security of supply and to enable more low carbon technologies to access the CM. The intent is to remove barriers for low carbon technology to participate in the CM, provide additional capacity, improve competition and to strengthen security of supply, while increasing the diversity of low carbon technologies within the scheme. To complement these proposals, we proposed publishing emissions data on the CM register to ensure transparency. The changes proposed in the Phase 2 consultation focused on:
- Improving the functioning of the scheme.
- Enabling battery operators to address issues around degradation.
- Greater flexibility to allow low carbon projects with longer-build times to access the scheme.
- New longer term agreement options for low-carbon technology.
- Measures to support the growth of the domestic consumer-led flexibility sector.
In April 2024, the government consulted on proposals to support CM auction liquidity by improving the functionality of the CM emissions verification process. [footnote 18] Full details can be found in both consultation documents.
As a result of the 2024 General Election, Parliamentary time was limited before the opening of the CM 2024 pre-qualification window. As such, it was not possible for the government to make amendments to the Electricity Capacity Regulations 2014 which established the CM. These resulted in prioritising technical measures that could be implemented via Rules amendments, which could be made in the short period before the commencement of the pre-qualification window.
As outlined in the government response to the Phase 2 consultation and the 2024 Rule amendments to support auction liquidity, [footnote 19] published 22 July 2024, the following changes were put into effect via changes to the CM Rules in July 2024:
- Rolling over a temporary amendment to enable mothballed plants to apply to prequalify for CM auctions, allowing existing generating Capacity Market Units (CMU) who have not been operational for 24 months before prequalification to use operational data older than 24 months.
- Introduction of a new exception to Rule 4.4.4, clarifying that battery augmentation is permitted so that storage CMUs can manage the natural decline in capacity due to degradation.
- Enabling the level of the Extended Performance Test (EPT) obligation to be reduced through secondary trading, in line with the approach for other CM testing frameworks.
- Enabling CM applicants to have their emissions verified after the deadline for submitting applications to prequalify for the CM.
- Allow some CMUs to use a Combined Heat and Power Quality Assurance Programme (CHPQA) certificate which evidences their emissions for a given calendar year to better align with the definition of an ‘Emissions Year’ in the Rules.
- Requiring applicants relying on previous verified Fossil Fuel Emissions Declarations (FFEDs) to resubmit the relevant documents.
- Updating Exhibit ZA in the CM Rules (relating to fossil fuel declarations) and improving functionality.
- Enabling older versions of the FFED to be accepted at prequalification.
The CM Phase 2 Policy Update [footnote 20] (15 October 2024) then outlined the intention to implement the remaining Phase 2 policies that were not immediately progressed after the General Election. As such, the following changes are to be put into effect as soon as possible (via changes to the CM Rules and Regulations):
- Amending timelines for post-stress event activities to improve administrative arrangements.
- Amending rules on what can be captured as part of refurbishment programmes.
- Reducing administrative barriers to consumer-led flexibility and other low carbon technologies competing in the CM.
- Enabling low carbon technologies with lower capital expenditure requirements to access longer term agreements.
- Supporting low carbon projects with longer build times to access support from the CM, vital for supporting the refurbishment of some large pumped hydro capacity.
- Publishing emissions data on a publicly available register.
- Implementing a low carbon definition for declared units.
Capacity Market: Proposals to maintain security of supply and enable flexible capacity to decarbonise
While low-carbon technologies are scaling up, we will continue to need existing flexible capacity, including unabated gas, to ensure security of supply. The running hours of gas generators have already significantly reduced, and we expect that the amount of unabated gas we need will continue to decline as we deploy more low-carbon technologies. Our aim is to move unabated gas into a back-up role, primarily to ensure security of supply.
On 15 October 2024, we published a consultation and call for evidence, seeking views on reforms to the CM aiming to retain the flexible capacity required to maintain security of electricity supply in the short-term and support the conversion of unabated gas plants to low carbon technology.
In summary, we are consulting on changes that would:
- Support the economic case for works to extend the life of ageing plants by lowering the scale of planned works needed to access three-year CM agreements.
- Provide assurance that all substantially refurbishing or new combustion power plants participating in the 2026 CM auction have a credible plan to decarbonise before they become operational, either through converting to hydrogen firing or carbon capture.
- Introduce an exit pathway for unabated gas generators with multi-year CM agreements to transfer from the CM to bespoke support, enabling the plants to retrofit carbon capture equipment to convert to low carbon.
Depending on the responses to the consultation, we will look to make any legislative changes to the CM in time for prequalification in 2025 for the 2026 CM auctions.
The simultaneous call for evidence is seeking views on alternative exit pathways for unabated gas to leave the CM to decarbonise, and future options for developing NESO’s modelling of longer-term capacity needs to include indicative future capacity targets eight years ahead of delivery.
Electricity storage
Electricity storage enables us to use electricity more flexibly, decarbonise cost-effectively and maintain operability of the system. This supports the integration of intermittent renewables and defers or avoids the need for costly network upgrades and new generation capacity.
Today, there is around 7.5GW of electricity storage operational in GB, made up of 2.8GW of pumped hydro, [footnote 21] around 4.3GW of newer grid scale lithium-ion battery storage [footnote 22] and 0.4GW behind the meter batteries in homes and buildings. [footnote 23]
There is a growing electricity storage in the planning pipeline representing over 60.0GW of storage: 59.0GW of battery storage and 5.5GW of pumped hydro storage. [footnote 24] These pipeline electricity storage projects are also getting larger with longer durations which will further support the development of a reliable, low carbon, transformation of the electricity grid. We anticipate 18.0GW of grid-scale batteries to be operational by 2027/2028 following CM agreements. These projects will contribute to energy security in the long-term by strengthening GB’s energy flexibility.
Interconnection
Electricity interconnectors are electricity cables which transport electricity between two (or more) countries. Interconnectors enable us to import and export electricity depending on price signals from the connected markets, transporting electricity from the lower-priced market to the higher-priced market.
Point-to-point interconnectors transport electricity directly between the connected countries. Offshore Hybrid Assets (OHAs) are a novel type of electricity asset, which combine interconnectors with offshore wind farms.
Electricity interconnectors provide us with access to a more diverse pool of generation, e.g. nuclear energy in France and hydropower in Norway, complementing our domestic energy mix and enhancing our security of supply.
GB currently has 9.8GW of operational electricity interconnector capacity across nine interconnectors. [footnote 25]
- 4.0GW to France: IFA 2.0GW, IFA2 1.0GW, and ElecLink 1.0GW, operational since 1986, 2021 and 2022 respectively
- 0.5GW to Northern Ireland: Moyle, operational since 2001
- 1.0GW to Netherlands: BritNed, operational since 2011
- 0.5GW to Ireland: East-West, operational since 2012
- 1.0GW to Belgium: Nemo Link, operational since 2019
- 1.4GW to Norway: NSL, operational since 2021
- 1.4GW to Denmark: Viking Link, operational since 2023
The UK has historically been a net importer of electricity, with the exception of 2022. In 2022, the UK was a net exporter for the first time in more than 40 years, with net exports totalling 5.3TWh. This was due to the widespread outages in the French nuclear fleet, increasing the demand for exported electricity to France. In 2023, net imports totalled a record of 23.8TWh. Total annual imports rose to a record 33.3TWh, whilst total exports halved compared to 2022, reaching 9.5TWh, however this was still the second highest annual figure. UK imports came primarily from France and Norway, with 12.9TWh and 8.5TWh of net imports, respectively. [footnote 26]
In Q2 2024, net electricity imports rose to record levels reaching 9.2TWh, equivalent to 13% of UK electricity supply. [footnote 27]
This winter, NESO expects GB to continue working closely with our neighbouring system operators in Europe to ensure that interconnectors remain mutually beneficial for flexibility and adequacy. It expects that GB will continue to be a net importer from continental Europe, including in times of tight margins or stress on the GB system. It identifies that there will be periods where exports flow from GB to Europe, including over peak periods, but only when we have sufficient operational surplus. NESO does not expect interconnector market positions to provide exports to Europe if this means there is insufficient electricity to meet GB demand. As system operator it has operational tools to manage peak demands, including the ability to trade on the interconnectors to secure flows for GB during tight periods. There are minimal planned outages for interconnectors this winter, with the T-4 2024/2025 CM securing 6.6GW of import capacity across interconnectors. [footnote 28]
There are two projects under construction, which will add a further 1.9GW of capacity to GB, bringing the total to 11.7GW. [footnote 29]
- 0.5GW to Ireland: Greenlink, scheduled for completion by the end of 2024
- 1.4GW to Germany: NeuConnect, scheduled for completion in 2028
Ofgem regulate electricity interconnectors and typically provide agreements through their cap and floor regime, which was launched in 2014. There have been three application windows for new project proposals since the launch of the regime, with the first two windows approving all projects. The net total quantifiable impact on GB consumer welfare of Window 1 and Window 2 projects has been assessed as £13.6bn and £8.9bn, [footnote 30] respectively. In September 2022, Ofgem opened a third window, alongside an OHA pilot. Seven point-to-point interconnector projects were assessed via Window 3, and two OHAs were assessed under the Initial Project Assessments for the OHA Pilot Scheme. Ofgem published their final decisions on these projects in November 2024. Three of the point-to-point interconnectors were granted a cap and floor regime in principle – MaresConnect (0.75GW to Republic of Ireland), LirlC (0.7GW to Northern Ireland) and Tarchon (1.4GW to Germany). [footnote 31] Both of the OHA projects were granted a Pilot OHA regulatory regime in principle – LionLink (1.8GW to Netherlands) and Nautilus (1.4GW to Belgium). [footnote 32]
The timeframe required to develop an interconnector from project inception to commercial operation can be over a decade. We expect that Window 3 will determine the pipeline of interconnector projects (in addition to those already in development or with regulatory approval) through to at least 2030, and therefore the maximum GB interconnector capacity we will achieve by then.
There is a further 2.5GW of interconnection, approved by Ofgem, that is awaiting regulatory approval in the connecting country:
- 2.5GW to France: FAB 1.25GW and Grid Link 1.25GW, the expected operational date is currently unknown for both projects.
NESO’s Future Energy Scenarios 2024 show that under all net zero pathways, net imports of electricity fall over the coming years, with GB expected to become a net exporter of electricity in the coming years due to higher levels of renewable generation. [footnote 33]
Consumer-led flexibility
Consumer-led flexibility can help consumers save money and improve system efficiency by using electricity at times that are beneficial to the system and being rewarded for doing so. It supports the integration of renewables and helps defer or avoid the need for costly network upgrades and new generation capacity.
Flexibility from technologies such as energy storage, smart charging of electric vehicles, flexible heating systems and interconnection could save up to £10 billion (2012 prices) per year by 2050 by reducing the amount of generation and network needed to decarbonise and will play a key role in reaching clan power by 2030 and accelerating to net zero. [footnote 34]
In 2023, consumer-led flexibility from electric heating provided 5.6GW (including 4.8GW from storage heaters) and industrial and commercial consumers are providing around 0.8GW of consumer-led flexibility to the system. [footnote 35] Participation from domestic consumers, smaller non-domestic consumers and electric vehicle charging, remains at an early stage but these collectively contribute 0.9GW. We expect these to provide a significant source of flexibility over the next decade and beyond, when combined with tariffs that reward flexible electricity use.
The CM is one vehicle for consumer-led flexibility participation in GB’s electricity system whose underpinning principle and function is to ensure security of supply. Table 1 shows the amount of consumer-led flexibility winning capacity agreements in CM auctions for T-4 (held four years ahead of delivery year) and Table 2 shows the amount of consumer-led flexibility winning capacity agreements, in CM auctions for T-1 (held one year ahead of delivery year) periods. This is awarded capacity, which has been de-rated in line with the CM’s de-rating factor for consumer-led flexibility.
Table 1. Capacity Agreements awarded to consumer-led flexibility in recent Capacity Market T-4 auctions
| Delivery Year | 2023-2024 | 2024-2025 | 2025-2026 | 2026-2027 | 2027-2028 |
|---|---|---|---|---|---|
| Awarded Capacity (MW) | 1,108 | 1,066 | 1,004 | 925 | 1,130 |
Table 2. Capacity Agreements awarded to consumer-led flexibility in recent Capacity Market T-1 auctions
| Delivery Year | 2021-2022 | 2022-2023 | 2023-2024 | 2024-2025 |
|---|---|---|---|---|
| Awarded Capacity (MW) | 239 | 528 | 405 | 745 |
Source: National Energy System Operator (2024) ‘Capacity Market Auction Results’.
Government previously consulted on proposed changes to the CM in October 2023. The consultation included proposals to address administrative barriers for domestic consumer-led flexibility portfolios, and to introduce 3-year agreements for low carbon, low capex assets (such as consumer-led flexibility). Government published its response in October 2024. [footnote 36]
The 2023 CM consultation also included a call for evidence on Generating Technology Classes (GTCs) for consumer-led flexibility. [footnote 37] Within current CM Rules, consumer-led flexibility is understood as a single technology type with one de-rating factor covering all technologies under the consumer-led flexibility umbrella. Consumer-led flexibility can comprise commercial-scale technologies, e.g. industrial fridges or manufacturing plants, or domestic-scale portfolios of components such as heat pumps and electric vehicle chargers, all of which can provide turn up/down services. In the 2023 CM consultation, government invited stakeholder views on introducing new GTCs for consumer-led flexibility technologies which would more accurately reflect its characteristics and capabilities within the CM. Government intends to review this question further and to put forward specific policy proposals for how to change the GTC, using the responses provided to help inform its decision. Government will be publishing a further consultation and Call for Evidence inviting further views on consumer-led flexibility technologies’ participation and interaction with the CM.
Demand Flexibility Service (DFS)
Another significant consumer-led flexibility enabler has been the Demand Flexibility Service (DFS) introduced by the National Energy System Operator (NESO) in Autumn 2022 in response to increased volatility and uncertainty in energy markets following Russia’s illegal invasion of Ukraine. The DFS helped manage the electricity system over winter 2022/2023 and was continued in 2023/2024. It gave NESO the option to pay consumers – via their energy supplier or an approved third-party intermediary – to turn down their demand in time periods where there might be a shortage of electricity. Over winter 2022/23, DFS incentivised 1.6 million households and businesses to lower their electricity demand when required, saving over 3.3 GWh of electricity. During winter 2023/24, there was an over 50% increase in the number of participants in the service, with around 2.5 million participants and over 3.6 GWh delivered. [footnote 38]
Ofgem approved NESO’s proposals for a third iteration of DFS for launch in November 2024. Due to the improved outlook for this winter, NESO proposed several changes to the service design that would see the DFS evolve from an enhanced action to a multi-year service that can be used under normal market conditions as a more business as usual balancing measure.
Liquidity in the GB wholesale power market
Energy market firms buy and sell their electricity in the wholesale market. The wholesale market allows participants to trade a range of products that enable them to meet their obligation to supply energy whilst also enabling them to mitigate risk. The degree of access to these products relates to the liquidity of the market and low levels of market liquidity can be indicative of an uncompetitive market.
Poor liquidity in the wholesale market can prevent consumers from fully realising the benefits that competition can deliver in terms of downward pressure on bills, better service and greater choice. It can also obscure or weaken price signals, inhibiting long term investment decisions in new generating plants with negative consequences for security of electricity supply.
In December 2023, Ofgem published a Call for Input on GB Power Market Liquidity. [footnote 39] This was to explore current market power liquidity trends, issues and concerns following the suspension of the Market Making Obligation (MMO) in 2019. [footnote 40] Stakeholders were asked to comment on power market liquidity trends, how liquidity is impacting trading, the future of liquidity, and if any potential intervention options would be justified in the short-medium term.
In August 2024, Ofgem published the Summary of Responses to the Power Market Liquidity Call for Input. [footnote 41] Ofgem found that:
- A variety of factors have led to a decline in liquidity, with respondents in agreement that it was not the suspension of the MMO alone which caused the decline.
- Certain policy levers, such as the price cap and Contracts for Difference were highlighted in the Summary of Responses to be affecting trading incentives and therefore concentrating liquidity into certain products.
- Reduced liquidity has had a varying impact on the market. The extent of this impact on stakeholders was mixed, with no alignment of responses based on market participant type.
- There was no clear agreement on potential intervention. Suggested interventions were spread across market levers and policy changes.
- Liquidity is gradually improving, with 2022 having been the most volatile and illiquid year since the MMO suspension.
Ofgem’s monitoring shows:
- Total traded volumes (comprising exchange and over the counter) reached a trough in Q3 2022 before recovering throughout 2023. Following this trough, total traded volumes peaked at around 222TWh in Q1 2023. Traded volumes in Q4 of 2023 exceeded the same period in 2022, at more than 178TWh. This trend has continued into 2024.
- Churn (the number of times a forward product is traded before delivery to the end-consumer) reversed its trend of steady decline from mid-2020, reaching an average of 2.6 in Q3 2024. This was an increase on Q3 2023 of 2.3. A liquid market is thought to require a churn rate of 3 or more, and although we have seen churn rates steadily increasing, we have yet to achieve this level of liquidity.
- Across front month, front quarter and front season contracts, bid-offer spreads (the difference between the best bid to buy and the best offer to sell) have also decreased from the peak in 2022. Smaller bid-offer spreads are a positive indicator for improving liquidity. Yearly average bid-offer spreads for the front quarter reached their lowest level since the suspension of the MMO in 2024. Bid-offer spreads on day-ahead contracts have stayed broadly consistent since 2016.
- Bid-offer spreads for the front quarter contract have also consistently been below 2022-2023 levels throughout the first half of 2024. This is a significant improvement from the peak of 2022.
In light of the above, Ofgem did not consider that there was a clear and strong case to proceed with market intervention (e.g. a market maker) at this time. Ofgem and DESNZ will continue to discuss potential policy levers to improve liquidity as per stakeholder’s feedback. We will also continue to monitor liquidity trends going forward.
Network reliability
Current network reliability
The historic overall reliability for the electricity networks (both transmission and distribution) has been high - over 99% in 2023-2024, 2022-2023 and in 2021-2022.
As part of the price control process, Ofgem sets target and incentive rates for the number of customer interruptions and customer minutes lost for each Distribution Network Operator (DNO). The Interruptions Incentive Scheme incentivises DNOs to invest in and operate their networks to manage and reduce the frequency and duration of power cuts experienced by their customers, whilst maintaining focus on minimising network costs and securing optimal value for consumers. The standards encourage DNOs to meet certain expected levels of service and to provide payments to end customers in the event of individual standards not being met. The standards cover a range of activities, including restoring supply during an unplanned interruption and providing notice periods for planned interruptions.
All individual DNOs met their Interruptions Incentive Scheme (IIS) targets for unplanned and planned interruptions in 2021-2022.
Offshore Transmission Systems connect offshore generation (such as wind) to the wider National Electricity Transmission System. The regulatory system for Offshore Transmission Owners is distinct from that of Onshore Transmission Owners because regulatory performance incentives are based on system availability, rather than loss of supply. This ensures offshore generators are able to export energy with minimal disruption. The Annual System Availability of Offshore Networks for 2023-24 was 97.85% according to figures provided by NESO.
Future development of networks
Accelerating the delivery of electricity network infrastructure and reforming the process for connecting new projects to the network are crucial enablers for the Government’s Clean Energy Superpower and Growth missions.
In November 2024, NESO published its Clean Power 2030 advice to government [footnote 42] and in December the government published its Clean Power 2030 Action Plan, [footnote 43] which includes technology-specific capacity ranges for the generation and storage capacity needed on the network out to 2035.
The Clean Power 2030 Action Plan builds on a comprehensive package of reforms to electricity networks that were set out at Autumn Statement 2023, including the Connections Action Plan (CAP) to free up over 100GW of capacity in the electricity network connections queue, and the government’s response to the recommendations from Nick Winser, which aimed to halve the end-to-end build timelines from new transmission infrastructure from 12-14 years to seven.
Subject to Ofgem approval of NESO’s proposals for connections reform, the capacity ranges set out in the Action Plan will be used within a reformed connection process to prioritise connection offers out to 2035 for viable and strategically aligned projects. Reforming the connections process will drive the country forward to clean power by 2030 and accelerate key industries from data centres to gigafactories unlocking billions of investment in GB.
To achieve network requirements for Clean Power 2030 we will need to go further and faster than Winser’s recommendations with around four times as much new transmission network needed by 2030 as has been built since 1990. NESO’s Clean Power 2030 advice confirms that all 80 transmission projects they identified as required to achieve clean power by 2030, including both upgrades to existing infrastructure and new transmission lines, are already in existing strategic network plans. Of these, there are 3 with delivery dates post 2030, which we know need to be accelerated.
Delivery of the full list of projects to such a short timeline is an unprecedented challenge and government and the Clean Power Advisory Commission [footnote 44] will work closely with partners to monitor delivery of individual projects and identify targeted interventions to accelerate delayed projects where necessary, including through prioritisation in the consenting process.
To continue to assure a reliable electricity system and to provide the necessary acceleration to facilitate power sector decarbonisation by 2030, networks require ongoing and increasing investment. Ofgem’s RIIO (Revenue = Incentives + Innovation + Outputs) price control models are ensuring this takes place, while driving further efficiency savings and incentivising outperformance.
The RIIO-T2 transmission price control applies to electricity transmission network companies over the period 2021-2026. Final business plan determinations for expanding, replacing, and maintaining the Transmission networks show a lower basic annual rate of approved funding than in RIIO-T1 but include the potential for significant additional investment through flexibility mechanisms above the approved baseline funding of £8.8bn; [footnote 45] together these can provide the basis to deliver the pathway to Clean Power 2030.
The RIIO-ED2 price control for electricity distribution networks runs from 2023-2028. There are 14 regional electricity DNOs that are regulated through RIIO-ED2 and Ofgem have approved overall funding of £22.2bn across GB under this price control, a very significant investment in the distribution networks and representative of their importance in achieving the transition to net zero. [footnote 46]
Gas
Introduction
Gas continues to remain critical to powering and heating GB, especially in winter, and in 2023 made up 36 per cent of total UK energy demand. [footnote 47] The recent winter assessment by the gas system operator shows we have sufficient supply capacity to meet demand. The below provides more detail on our supply, demand and wider flexibility tools to meet the reasonable demands of consumers in GB.
Our gas system continues to benefit from diverse supply sources and routes to market. The gas market remains crucial to the UK’s energy security due to its significance in heating, industry, and electricity generation. Figure 8 illustrates the sectoral consumption of natural gas in 2023. [footnote 48] Natural gas will continue to play an important role while we decarbonise to meet Net Zero. Most recent data show approximately 25 million GB households remain connected to the gas grid. [footnote 49]
Figure 8. Sectoral consumption of natural gas
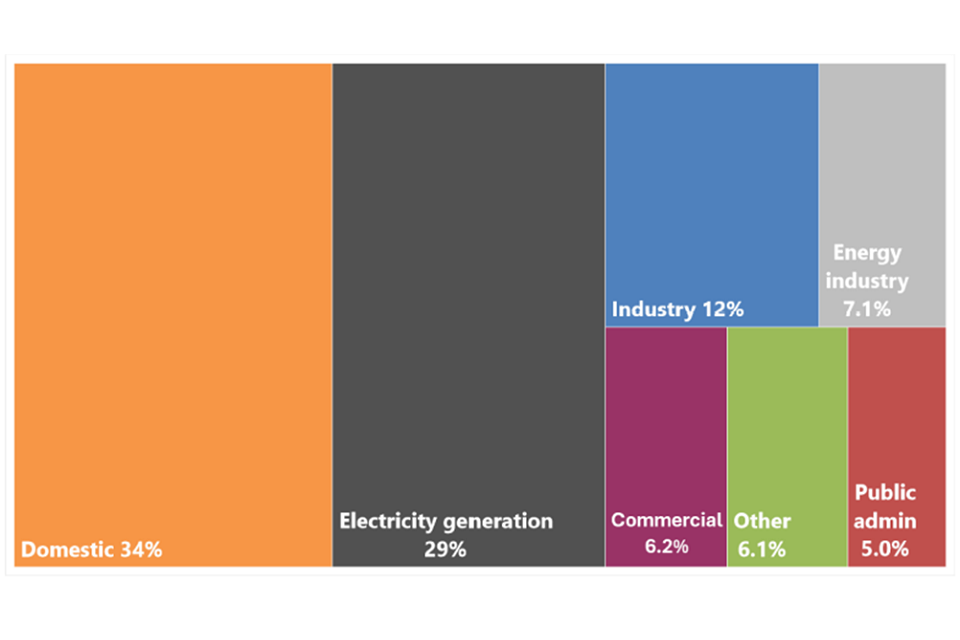
Source: DUKES (2024) ‘Chapter 4: natural gas’.
Over the past three years, the market has successfully delivered sufficient supplies amidst a period characterised by high energy prices and increased uncertainties caused by Russia’s illegal invasion of Ukraine, and conflict in the Middle East. National Gas’ (NG) 2023/2024 performance report indicates the transmission network continued to perform with 100% reliability over the last year [footnote 50] and we expect it to continue to perform reliably given the measures NG are continuing to take in maintenance, safety, innovation and investment into the network. [footnote 51] As detailed below, Government continues to work closely with all relevant stakeholders, including Ofgem, and the gas and electricity system operators to ensure the security of our gas supply over the short and long term.
Demand
A small increase in domestic, commercial and smaller industrial (non-daily metered (NDM)) demand is expected this winter due to a slight decrease in energy prices compared to winter 2023/2024. [footnote 52] NG forecasts that we have sufficient capability to meet this increase in demand. [footnote 53] This increase is expected to be offset by reduced demand for power generation as well as energy saving habits, as while prices have decreased they remain high compared to previous decades. Daily metered (DM) and industrial demand is historically consistent and forecast to be comparable to previous winters (3.8bcm for winter 2024/2025, compared to 3.9bcm for winter 2023/2024). [footnote 54]
Overall demand on the National Transmission System (including exports) is forecast to reduce this winter to more normal levels following the peak in winter 2022/2023, given the EU will enter winter with high storage levels and increased import infrastructure in place. [footnote 55] The UK exports gas to Northern Ireland and the Republic of Ireland, as well as to continental Europe via the two bidirectional interconnector pipelines with Belgium and the Netherlands.
Gas demand for electricity generation was down 20% in 2023 compared to 2022, due to lower electricity demand and increased electricity imports. [footnote 56] Gas demand for electricity generation is expected to continue decreasing, reducing from 8.2bcm for winter 2023/2024 to 7.8bcm for winter 2024/2025, due to the continuing increase in renewable generation. [footnote 57]
Future total gas demand is expected to decline further as the UK decarbonises to meet Clean Power 2030 ambitions, for which unabated gas should provide less than 5% of GB’s electricity generation. [footnote 58] From 2023 to 2050, available projections suggest that gas demand could fall by between 56% and 82% depending on the uptake of low carbon technologies. [footnote 59] In cases of high electricity demand and low availability of renewables and imports, gas will still play a critical role in balancing the electricity system. [footnote 60] As longer-duration technologies, such as pumped hydro storage, gas CCUS, hydrogen to power or liquid air energy storage, are deployed, there will be a fundamental shift in the role and frequency of unabated gas generation, moving from generating almost every day of the year, to an important backup to be used only when essential.
While overall long-term gas demand will decline, short-term demand is inherently uncertain due to changing factors such as weather and geopolitical developments. NG, as the gas system operator, has the necessary physical, commercial, and market-based tools in place to manage supply and demand imbalances effectively. [footnote 61] Government continues to work with NG, Ofgem and other stakeholders to ensure consumers can rely on secure gas supplies via an appropriately resilient, flexible, and efficiently regulated network.
Supply
The UK currently benefits from a wide variety of gas supply sources. North Sea gas, transported via pipelines from the UK Continental Shelf (UKCS) and the Norwegian Continental Shelf (NCS), forms the majority of gross UK gas supply (76% over 2019-2023, see Figure 9). The remainder of our gas supply is primarily made up of imports, including Liquefied Natural Gas (LNG) shipments and interconnector pipeline supply from Belgium and the Netherlands. [footnote 62] Between 2019 and 2023, these two sources of supply comprised, on average, 22% (LNG) and 2% (interconnector imports) of gross UK gas supply. The UK also has eight gas storage facilities which, although not a traditional form of supply, act as a source of system flexibility when responding to short-term changes in supply and demand, as well as a very small amount of onshore natural gas production. [footnote 63]
Figure 9. UK natural gas gross supply mix 2019 to 2023

Source: DESNZ analysis using data from Energy Trends: UK gas. [footnote 64]
Domestic Production
The UK-owned section of the North Sea (the UK Continental Shelf) is considered a mature basin. This means that the most accessible oil and gas in the basin has already been extracted, following sixty years of production. As a result, UKCS production is declining on an annual basis, and has been doing so over the last twenty-five years. The North Sea Transition Authority (NSTA) currently project an annual decline of domestic offshore gas production at a rate of 11% per year. [footnote 65]
The Gas Safety (Management) Regulations 1996 were amended in April 2023 to implement the policy decision to reduce the lower limit of the Wobbe Number for normal supply in British gas networks from April 2025. The Wobbe Index is an expression of the amount of energy within gas and its density relative to air. Expanding the Wobbe Index range means that, from April 2025, a greater volume of gas from the UKCS can be injected into the National Transmission System (NTS) without the need for blending with moderately higher quality gasses. This has been factored into the NSTA’s projected annual UKCS gas production decline of 11% per year.
Import Capacity and Outlook
GB has a diverse set of import routes, including direct connection to the Norwegian Continental Shelf via several pipelines, predominantly the Langeled pipeline, as well as the Vesterled, Tampen Link, and Gjoa pipelines. GB is connected to international markets via two interconnectors to mainland Europe and three LNG import facilities. Interconnector links the National Balancing Point (NBP, GB’s gas trading hub) to the Belgian Zeebrugge gas trading hub. The Balgzand-Bacton Line (BBL) links to the Dutch Title Transfer Facility (TTF). GB has the second largest LNG import infrastructure capacity in Europe, with facilities in Isle of Grain, Kent, and two in Milford Haven, Southwest Wales (Dragon and South Hook).
Currently, the UK has a total import capacity of around 141 billion cubic metres per year (bcm/y), made up of ~51bcm/y from Norway, ~34bcm/y from Belgium and the Netherlands, and ~55bcm/y from LNG. [footnote 66] While capacity does not guarantee utilisation, with current infrastructure it has always secured the gas required.
The operator of the Isle of Grain LNG terminal is investing in upgrades to the facilities to increase capacity. This upgrade is already underway and is expected to add an additional 0.2mcm of liquid storage capacity and approximately 5bcm/y of additional regasification capacity from mid-2025. [footnote 67]
Total gas imports fell by 20%, to 45bcm, in 2023 compared to a record high of 56bcm in 2022, [footnote 68] when trade patterns changed as a result of the Russia-Ukraine conflict. Unlike 2022 when high exports to Europe were facilitated by increased imports into the UK, 2023 saw imports return to more typical levels and higher than normal exports were facilitated by low UK demand.
While long-term external outlooks for global gas supply vary between different market intelligence providers, traders and NGOs; global gas supply has started to return to growth following the supply shocks caused by Russia’s illegal invasion of Ukraine in 2022/2023 with Russian exports falling over 105bcm (43%) from 2021 to 2023. However, forecasted all-time high global demand in 2024 and 2025 means that markets will remain vulnerable to unexpected changes to supply or demand in the near term. The International Energy Agency (IEA) expect global LNG supply growth to accelerate from 2% (or 10bcm) in 2024, to near 6% (or 30bcm) in 2025, [footnote 69] mostly driven by liquefaction capacity installations in the United States and Qatar.
No new liquefaction projects have reached final investment decision in the United Sates since January 2024, due to a pause on granting LNG export licenses to countries without a free trade agreement with the United States. This means that approvals in 2024 have been driven by the Middle East, led by Qatar, the United Arab Emirates and Oman. This strong growth is expected to mean there could be more gas supply than demand globally in the second half of this decade.
Gas storage
Our varied sources of gas supply means that the UK is less reliant on gas storage than some European countries who have larger storage capacities to mitigate their lack of diverse supply and operate a ‘strategic reserve’ model. Instead, GB’s gas storage plays an important role in providing system flexibility in responding to short-run changes in supply and demand (i.e. helping top-up supply to meet peak demand on any given day).
GB currently has eight gas storage facilities, with a maximum storage capacity of 3.2bcm, and a maximum deliverability of 127mcm/day, (though daily deliverability declines as stocks deplete due to reduced pressure). [footnote 70] Seven of these are medium-range storage which means they can cycle gas regularly – some sites can empty and refill within days, others within weeks (this is dependent on pressure and the age of the facilities). The eighth facility provides long-range storage cycling on a seasonal basis, primarily injecting in the summer and withdrawing in the winter.
The economics of storage relies on gas price variations over time: injections are incentivised when global prices are low so that gas can be withdrawn when prices are higher on the global market. The value GB derives from gas storage is its ability to offer flexibility to the market when gas is needed to meet GB’s energy demand and other sources of gas supply such as the UKCS, NCS or LNG are more expensive or not available. The government will continue to monitor GB’s storage model as the dynamics of the gas market continue to evolve through engagement with the market.
In winter 2023/2024, gas storage was used to provide around 3bcm (~7%) of gas on to the network, helping meet overall winter demand of 43bcm. [footnote 71] We expect storage to continue to play an important role in ensuring a resilient gas system, alongside existing import capacity.
Demand Side Response (DSR)
NG, as the gas system operator, offers a Demand Side Response (DSR) scheme as one of its pre-emergency tools to limit the likelihood, duration and severity of a gas supply emergency. DSR allows daily metered (DM) consumers to voluntarily reduce their demand in exchange for a payment at times when expected available supplies are forecast to be insufficient to meet demand by the end of a gas day. [footnote 72]
DM consumers must be able to deliver demand reduction of at least 100,000kWh/day to be eligible for DSR. The DSR options process requires eligible participants to commit in advance of winter to reduce their gas consumption, if NG requires it. DSR allows for businesses to protect their most critical loads as well as receive financial compensation at a greater level than they would otherwise receive if they were instructed to cease using gas involuntarily during an emergency. [footnote 73] If NG send out a gas balancing notification or margins notice, shippers and consumers may also send offers on the On-The-Day commodity market, in which case they would not be required to contract in advance.
NG runs a tender each summer to which potential consumers and shippers can place DSR offers for the forthcoming winter (1 November – 30 April) and next two winter periods. [footnote 74] After the tender event, NG decides which DSR offers to accept. NG can accept one offer per consumer/shipper to be exercised within day, D-1 (day ahead of delivery), and/or at D-5 (5 days ahead of delivery).
As a result of the tender in summer 2024, NG accepted offers for winter 2024/2025 totalling 4.3GWh pre-contracted DSR, with an option cost of £3.7 million. NG received limited offers for future winter (2025/2026 and 2026/2027) and decided to not accept them. This was for cost purposes, as well as the potential of future DSR improvements that may be made to further stimulate the market. [footnote 75]
Following feedback on the DSR regime, NG have worked with Government, Ofgem, and industry to make improvements in line with industry priorities and are planning to continue engagement in the coming months. [footnote 76] Government is also working with NG and Ofgem to consider the opportunities and challenges of a potential future scheme for NDM gas users.
Peak supply and demand capability
NG is licenced [footnote 77] to plan the gas transmission system to meet 1-in-20 peak aggregate daily demand, as well as a 1-in-50 severe winter. [footnote 78], [footnote 79] This licence requirement relates to the capacity of gas transmission infrastructure to meet peak demand [footnote 80] – it does not apply to the availability or reliability of gas supply to meet demand. Decisions to refill and deplete storage, as well as procure supply, are determined by the market.
NG’s annual Winter Outlook compares operational maximum daily supply capability against peak 1-in-20 daily demand (the difference is known as the ‘peak day supply margin’). [footnote 81] When calculating the peak day supply margin, NG assume a reasonably high level of storage fullness (due to the market incentive to refill storage in anticipation of high demand). We should expect a tighter margin if storage levels are lower than assumed.
The peak day supply margin in NG’s 2024/2025 Winter Outlook is 127mcm, which is lower than the 2023/24 Winter Outlook peak day supply margin (159mcm) but otherwise broadly similar to previous Winter Outlooks. [footnote 82] The reason for the decline from the 2023/24 Winter Outlook can be largely attributed to the 2023/24 Outlook overestimating available UKCS supply. Other factors for the decline from the 2023/24 Winter Outlook include a methodological change to calculating imports from continental Europe, as well as moderate increases in sources of peak demand. The latter includes an increase in peak gas-for-power demand, reflecting the build-out of renewable electricity generation, [footnote 83] and a moderate increase in consumer and residential demand.
Beyond Winter 2024/25, a new medium range gas supply security assessment will be delivered by NESO. This assessment aims to assess the availability, reliability and deliverability of gas supply over a 5-to-10-year horizon and will play an important role in identifying risks in this area in the medium term. The first publication is due in late 2025.
Market functioning
The underlying market arrangements in GB are established on the basis that the market will provide the gas itself, and the market will balance supply and demand. Should the market not balance supply and demand, the gas system operator will step in as the residual balancer, effectively entering the market and undertaking trading activity to seek to resolve any imbalance on the system. Access to international markets allows GB to meet annual gas demand by supplementing indigenous production from the UKCS, bolstering security of supply by reducing reliance on any one source. The GB gas market has delivered effectively to date, and we expect that delivery to continue.
Churn is effectively the number of times a unit of electricity or gas is traded before delivery to the end-consumer (ratio of traded volume to end demand) and can tell us how liquid a market is. As the system operator will look to the market to remedy tight margins in the first instance (e.g. through a Margins Notice), the ability to trade efficiently is important to security of supply. The higher the churn, the more traders are likely to participate in the market and therefore alleviate potential security concerns. The GB gas market remains relatively liquid with a significant number of participants. The gas wholesale market’s churn ratio in Q2 2024 averaged 10.5, an increase of 1.2 from the previous quarter (9.3). Year-on-year the churn has increased by 1.7, which is likely caused by the decrease in price volatility across the gas forward curve.
Figure 10. GB wholesale gas prices, January 2023 to September 2024

Source: Ofgem Wholesale Market Indicators
Wholesale gas prices have been on the rise this calendar year, with forward prices for gas averaging 93.4p/th in September 2024 (from 76.3p/th in January 2024), but as can be seen from Figure 10 above, prices are lower than September 2023 prices (130.5p/th). Prices fell at the end of 2023, due to strong supply (LNG and European storage at record high levels) and lower than seasonal average demand due to a mild winter. However, the price rises seen since January have been driven by increased global demand, increasing competition for LNG, and a reduction in overall supply, and additional risk perceived in the market to securing necessary supply to meet increased demand. Additionally, weather forecasts for this winter indicate a return to colder temperatures, which will drive increased gas demand after the previous two mild winters.
GB has an established reputation in promoting transparent market-based approaches and fully supports the liquid, transparent and flexible global gas market. Market flexibility is essential to promoting global security of supply, ensuring that gas is delivered where it is most needed. The existing market mechanisms in the UK continues to balance supply with demand.
Oil
Introduction
Security of oil supply is not part of the statutory requirement but is included here for general information.
Two key events affected patterns of oil supply and demand in 2023: 1) trade sanctions banning Russian oil imports since December 2022, and 2) continued demand recovery following the ending of travel restrictions that were introduced to curb the spread of COVID-19 in 2020 and 2021.
In 2023 there were no imports to the UK from Russia; the Government declared its intention to end imports of oil from Russia shortly after the invasion and worked with an industry task force to implement a statutory ban in December 2022. [footnote 84] The last cargoes of primary oils and oil products from Russia arrived in October and November 2022, respectively. More recent data on oil imports to the UK are published in Energy Trends Table 3.14. [footnote 85]
On the demand side, 2023 saw further recovery in transport fuels following the ending of travel restrictions to curb Covid-19 in place in 2020 and 2021. Overall transport demand increased by 2.7% compared to 2022 because of a 16% increase in jet demand. Oil formed 39% of total UK primary demand in 2023, up from around only a third in 2020 and 2021. [footnote 86]
Primary oil production continued the ongoing pattern of decline from the mature North Sea basin, falling by 11% compared to 2022 to a record low of 34 million tonnes. There was a corresponding 11% decrease in exports of crude oil and natural gas liquids (NGLs), which reached a record low of 25 million tonnes and meant that crude and NGL net imports increased by 14% to 16.5 million tonnes in 2023. Despite this decline the UK remains well-positioned to meet demand for crude with production remaining equivalent to two-thirds of refinery demand and remaining supply coming from reliable trading partners such as the US and Norway.
All data are for 2023 and sourced from Section 3 of the Digest of UK Energy Statistics 2024 unless otherwise specified. [footnote 87]
Primary Oil Supply and Demand
UK primary oil production peaked at 137 million tonnes in 1999 and had contracted to 34 million tonnes by 2023 (see Figure 11). The North Sea Transition Authority (NSTA) estimates that offshore oil production from the mature North Sea basin will drop by another third by 2028, reaching 22 million tonnes. [footnote 88] This will be sufficient to meet around 40 per cent of projected UK oil needs compared to one-half in 2024 (based on the Net Zero Strategy delivery pathway). Extended projections to 2050 suggest that production will in future meet 35 to 40 per cent of demand each year.
Brent crude oil from the UK Continental Shelf is a high-quality product, which is in high demand internationally but is not as commercially attractive to UK refineries. Most crude oil produced in the UK is processed by refineries abroad into the products the UK needs before it is returned to the UK.
Figure 11. UK supply and demand for primary oils, 1998 - 2023

Source: DUKES (2024) ‘Chapter 3: Petroleum’.
The UK therefore trades extensively in primary oils globally, exporting to meet demand for Brent crude (with nearly 90% of crude oil exports going to EU partners) and importing to meet UK refinery crude type demand. Norway has historically been the largest import source because of the extensive shared infrastructure, but the UK has been increasingly importing from the US since the lifting of the US export ban in 2015.
Figure 12 shows the diversity of sources of crude imports in 2023. For further information, see the article on diversity of supply for oil and oil products in OECD countries, 2023. [footnote 89]
Figure 12. Worldwide crude oil imports to the UK in 2023 (thousand tonnes)

Source: DUKES (2024) ‘Chapter 3: Petroleum’.
Sanctions were placed on Russian oil following the invasion of Ukraine in February 2022 with an oil import ban taking effect from the 5th December 2022. The last cargo of crude from Russia arrived in the UK in April 2022, and of feedstocks in October 2022. [footnote 90]
The UK is a significant exporter of crude oils as well as an importer. Crude oil and NGL exports fell by 11% in 2023 to 25.4 million tonnes, the lowest on record in line with reduced offshore production.
Refined Product Supply and Demand
Oil must be refined into oil products before it can be used for all forms of transport, manufacturing, medicines, textiles, etc. Refinery production was down 6.9% compared to 2022 at 50 million tonnes, half of the peak production seen in 1998 (Figure 13). This is below the average of around 60 million tonnes seen between 2014 and 2019 and remained low partially because of significant maintenance at the end of 2023.
The UK remained a net importer of products at 11.5 million tonnes in 2023, an increase of 60% on 2022. This is the first time that net imports have risen above 10 million tonnes since pre-pandemic 2019 and, at the third highest level on record, slightly surpassed the 5-year pre-pandemic average.
In 2023, total demand for petroleum products increased by 1.6% compared to 2022 (total demand includes energy industry use and transformation). Much of this growth was from an increased demand in transport, which was up by 1.1 million tonnes (2.7%) in 2023. Demand for jet fuel and petrol increased by 16% and 4.4%, respectively, while diesel demand for road use dropped by 4.2%.
Figure 13. UK supply and demand for petroleum products, 1998 – 2023

Source: DUKES (2024) ‘Chapter 3: Petroleum’.
Production of key petroleum products
Although refinery production decreased by 6.9% compared to 2022, this was still higher than the record and near record lows in 2020 and 2021 when travel restrictions dampened demand for transport fuels. Travel accounts for around three quarters of oil product consumption; in 2023 UK refiners produced a fifth more petrol than needed to meet demand and met around half and 30% of diesel and jet fuel, respectively. Excess petrol was exported, mainly to the US, with diesel and jet fuel supply made up with imports.
Despite trade sanctions ending supply from Russia since the end of 2022, the UK remains favourably positioned to obtain diesel and jet fuel from a diverse range of sources. Prior to the ban the UK had sourced Russian imports to help meet demand for road diesel, but Russian imports fell from nearly 40% of imports in 2021 to just 13% in 2022 and dropped to zero from July 2022. [footnote 91] There were not any oil imports from Russia in 2023.
To compensate for changing trade patterns, in 2023 the UK imported diesel from 23 partners with 80% coming from the US, the Netherlands, and Belgium (DUKES Table 3.7). There is strong jet fuel demand in the UK because Heathrow is one of the busiest airports in the world and the UK imported from 18 countries in 2023, mainly from established trading partners in the Middle East.
Most products that the UK exported went to EU partners in 2023, including the Netherlands, Ireland, Belgium, Germany, France, Poland, and Sweden.
The UK has been a net importer of petroleum products since 2013 and continued to be in 2023 at 11.5 million tonnes compared to 7.2 million tonnes in 2022. The UK benefits from ready access to international maritime trade in oil products, including the Antwerp, Rotterdam, Amsterdam trading hub, with the Netherlands and Belgium combining to provide most of the UK’s oil product imports.
Consumption of key petroleum products
Final consumption of oil was up by 1.6% in 2023 compared to 2022. Figure 14 shows the 2.7% increase in demand for transport fuels as air travel continued to bounce back after the lifting of restrictions to curb the spread of Covid-19, which largely contributed to the overall increase in oil demand. Overall demand for petroleum products in 2023 remained lower than pre-pandemic levels, down by 12% compared with 2019 at 59.6 million tonnes.
Figure 14. UK demand for petroleum products (arrows show change in 2023 compared to 2022)

Source: DUKES (2024) ‘Chapter 3: Petroleum’.
The transport sector is the primary use for petroleum products in the UK. In 2023 overall road fuel demand was down by 1.1% compared to 2022. Within this headline figure, petrol demand was up by 4.4% and diesel demand down by 4.2% as motorists continue to switch to petrol cars following raised awareness around nitrogen oxide emissions of diesel engines. However, when biofuels are included petrol demand was up by 5.0% and diesel down only 2.7%, netting out to no change compared to 2022. [footnote 92]
Demand for jet fuel was most severely impacted by Covid-19-related restrictions and reached a record low of 4.8 million tonnes in 2021. Since then, the aviation industry has been recovering; although jet demand in 2023 remained 8.2% lower than pre-pandemic 2019, it was up by 16% compared to 2022. Table 4 shows demand for key oil products in 2023.
Table 4. UK demand for oil products 2023
| Petroleum Product | Quantity (million tonnes) |
|---|---|
| Petrol | 11.5 |
| White Diesel | 22.9 |
| Jet Fuel | 11.1 |
| Burning Oil | 3.0 |
| Gas Oil | 2.2 |
| Fuel Oil | 0.3 |
| Other | 8.7 |
Source: DUKES (2024) Table 3.2.
Technology changes, including adoption of electric vehicles, increased use of sustainable transport fuels, and renewables for heat generation, will ultimately reduce future demand for oil. Estimates indicate a reduction in final demand for oil of roughly 17% by 2040 compared to 2023. [footnote 93] Whereas oil currently meets around 93% of transport needs [footnote 94], as we move towards Net Zero the use of oil will likely become increasingly concentrated in aviation.
Figure 15. Chart showing projections of oil product demand, plus oil product demand for international aviation to 2040

Source: DESNZ Energy and emission projections, Reference scenario, Annex F
Resilience
The UK remains well supplied by a combination of domestic refining and imported fuels.
There were no significant disruptions to fuels supply in 2023, but the Department continued to monitor the market, including forecourt stock levels. The government publishes a complete timeseries extending back to 2019 covering average road fuel sales, deliveries, and stock levels. [footnote 95]
The Energy Act 2023 introduced the Core Fuel Sector Resilience measures. [footnote 96] While some of these require secondary legislation to implement, Section 274 of the Energy Act 2023 creates a duty on core fuel sector participants to report a notifiable incident, i.e. an incident which affects their relevant activities or assets in such a way as to create a significant risk of or cause, disruption to or failure of the continuity of core fuel supply. Early indications in 2024 are that this measure is being complied with and enabling the Department to have a more accurate view of the risks and issues facing the core fuel supply system.
In November 2023 Petroineos announced that they would start preparatory work to enable the future transformation of its Grangemouth refinery into a fuel import terminal. Refining operations are now expected to cease in the second quarter of 2025. Since the 2023 announcement, the Department has worked closely with Petroineos, the Scottish Government and other stakeholders to support the workforce and community and to find a viable, long-term future for the site. The Department’s assessment is that the conversion of the refinery to an import terminal will provide more than enough capacity to meet normal levels of demand with imported fuels.
Emergency oil stocks
As a condition of membership of the International Energy Agency (IEA), the UK is required to hold stocks of oil equivalent to at least 90 days of net imports that could be released in the event of severe disruption to global supply. The government meets this obligation by directing industry to hold minimum levels of stocks. Companies may choose to hold stocks within the UK or abroad via legal agreements with other countries. In August 2024 the net total of tickets held here for other countries or held abroad on behalf of the UK was around 15% of total stocks. In the same month total stocks were equivalent to around 140 days of net imports.
Following the illegal invasion of Ukraine by Russia, the UK participated in an IEA-led co-ordinated release of oil stocks to help protect global oil market prices. The UK released 2.2 million barrels in March 2022 and 4.4 million barrels in April 2022. The IEA announced the end of the release in June 2023 and the UK completed re-building stocks in April 2024.
-
NESO ‘Winter Outlook’ (viewed on 13 November 2024) ↩
-
DESNZ and BEIS ‘British Energy Security Strategy’ (viewed on 13 November 2024) ↩
-
DESNZ and BEIS ‘Review of Electricity Market Arrangements’ (viewed on 13 November 2024) ↩
-
DESNZ ‘Review of Electricity Market Arrangements Second Consultation’ (viewed on 13 November 2024) ↩
-
NESO ‘Clean Power 2030’ (viewed on 26 November 2024) ↩
-
ESO ‘Future Energy Scenarios: ESO Pathways to Net Zero’ (viewed on 13 November 2024) ↩
-
NESO ‘FES Data Workbook’ (viewed on 13 November 2024) ↩
-
DECC (2013) ‘Reliability Standard Methodology’ (viewed on 3 December 2024) ↩
-
For further information on the approach to capacity auction recommendations please refer to NESO’s annual electricity capacity reports ↩
-
Consumer-led flexibility related to electricity usage is also known as demand side response (DSR). ↩
-
Ofgem (2024) Decision on Demand Flexibility Service (viewed on 3 December 2024) ↩
-
DESNZ and BEIS ‘Carbon Emissions Limits in the Capacity Market’ (viewed on 13 November 2024) ↩
-
Electricity Settlements Company ‘Annual Report’ (viewed on 13 November 2024) ↩
-
ESO ‘Final Auction Report’ (viewed on 13 November 2024) ↩
-
ESO ‘Final Auction Report 2023 Four-Year Ahead Capacity Auction’ (viewed on 13 November 2024) ↩
-
Delivery year capacity accounts for multi-year agreements and confirmed terminations that have occurred since the capacity agreement was awarded. The Other category includes technologies such as Wind, Solar, Biomass and Mixed-use generators. ↩
-
DESNZ ‘Capacity Market Consultation on proposals to improve security of supply and align with net zero (Phase 2) and call for evidence on Ten-year Review’ (viewed on 13 November 2024) ↩
-
DESNZ ‘Capacity Market Rule Amendments to support Auction Liquidity’ (viewed on 13 November 2024) ↩
-
DESNZ ‘Capacity Market Government Response’ (viewed on 13 November 2024) ↩
-
DESNZ ‘Capacity Market: Policy Update 2023 Phase 2 Consultation’ (viewed on 13 November 2024) ↩
-
DESNZ ‘DUKES 2023 Chapter 5: statistics on electricity from generation through to sales’ (viewed on 13 November 2024) ↩
-
Modo Energy ‘Benchmarking dashboard’ (viewed on 13 November 2024) ↩
-
LCP Delta ‘European Market Monitor on Energy Storage 8.0’ (viewed on 13 November 2024) ↩
-
Figures taken from Renewable Energy Planning Database and include projects that have planning approval, submitted an application for planning or are currently under construction ↩
-
DESNZ ‘DUKES 2023 Chapter 5: statistics on electricity from generation through to sales’ (viewed on 13 November 2024) ↩
-
DESNZ ‘DUKES 2023 Chapter 5: statistics on electricity from generation through to sales’ (viewed on 13 November 2024) ↩
-
DESNZ ‘Energy Trends September 2024’ (viewed on 13 November 2024) ↩
-
NESO ‘Winter Outlook Report 2024’ (viewed on November 13 2024) ↩
-
Ofgem ‘Interconnector Webpage’ (viewed on November 13 2024) ↩
-
Ofgem ‘Interconnector Policy Review’ (viewed on November 13 2024) ↩
-
Ofgem ‘Window 3 Results: Interconnectors: Initial Project Assessment of the Window 3 Interconnectors – decision’ (viewed on November 13 2024) ↩
-
Ofgem ‘Window 3 Results: OHA Pilot Projects: Initial Project Assessment for the Offshore Hybrid Asset Pilot Projects (viewed on November 13 2024) ↩
-
NESO ‘Future Energy Scenarios 2024’ (viewed on November 13 2024) ↩
-
BEIS ‘Electricity System Flexibility Modelling’ (viewed on 13 November 2024) ↩
-
NESO ‘Future Energy Scenarios 2024’ (viewed on 13 November 2024) ↩
-
BEIS ‘Smart Systems and Flexibility Plan’ (viewed on 13 November 2024) ↩
-
BEIS ‘Capacity Market 2023 Consultation’ (viewed on 13 November 2024) ↩
-
ESO ‘Demand Flexibility Service End of Year Report’ (viewed on 13 November 2024) ↩
-
Ofgem ‘Call for Input: Power Market Liquidity’ (viewed on 13 November 2024) ↩
-
Ofgem ‘Decision to suspend the Secure and Promote Market Making Obligation with effect on 18 November 2019’ (viewed on 13 November 2024) ↩
-
Ofgem ‘Summary of Responses Following Liquidity Call for Input’ (viewed on 13 November 2024) ↩
-
NESO (2024), ‘Clean Power 2030’ (viewed on 17 December 2024) ↩
-
NESO (2024), ‘Clean Power 2030’ (viewed on 17 December 2024) ↩
-
DESNZ (2024) ‘Energy experts appointed to deliver clean power 2030 mission’ (viewed on 17 December 2024) ↩
-
Ofgem ‘RIIO-2 Final Determinations for Transmission and Gas Distribution network companies and the Electricity System Operator’ (viewed on 13 November 2024) ↩
-
Ofgem ‘RIIO-ED2 Final Determinations’ (viewed on 13 November 2024) ↩
-
DESNZ ‘Digest of UK Energy Statistics 2024 Chapter 4: natural gas’ (viewed on 15 November 2024) ↩
-
DESNZ ‘Digest of UK Energy Statistics 2024 Chapter 4: natural gas’ (viewed on 13 November 2024) ↩
-
DESNZ ‘Sub-national estimates of properties not connected to the gas network 2015 to 2022’ (viewed on 13 November 2024) ↩
-
National Gas ‘Our Performance 2023/2024’ (viewed on 13 November 2024) ↩
-
National Gas ‘Our Performance 2023/2024’ (viewed on 13 November 2024) ↩
-
National Gas ‘Winter Outlook 2024’ (viewed on 13 November 2024) ↩
-
National Gas ‘Winter Outlook 2024’ (viewed on 13 November 2024) ↩
-
National Gas ‘Winter Outlook 2024’ (viewed on 13 November 2024) ↩
-
National Gas ‘Winter Outlook 2024’ (viewed on 13 November 2024) ↩
-
DESNZ ‘Digest of UK Energy Statistics 2024 Chapter 4: natural gas’ (viewed on 13 November 2024) ↩
-
National Gas ‘Winter Outlook 2024’ (viewed on 13 November 2024) ↩
-
NESO ‘Clean Power 2030’ (viewed on 04 December 2024) ↩
-
DESNZ analysis of FES 2024 figures taken from the FES data workbook (viewed on 4 December 2024) ↩
-
National Gas ‘Winter Outlook 2024’ (viewed on 19 November 2024) ↩
-
National Gas ‘Winter Outlook 2024’ (viewed on 13 November 2024) ↩
-
Interconnector pipelines with Belgium and the Netherlands are bidirectional. UK gas exports are treated as a source of demand in this report. ↩
-
~1% of UK gas production is onshore (average 2019-2023 DUKES F.2). ↩
-
DESNZ analysis of published Energy Trends data (tables 4.2 and 4.4) (viewed on 13 November 2024) ↩
-
NSTA ‘Production and expenditure projections 2024’ (viewed on 13 November 2024) ↩
-
National Gas Transmission ‘Gas Ten Year Statement’ (viewed on 13 November 2024) ↩
-
National Grid ‘Grain LNG sets new record for utilisation and increases global reach’ (viewed on 13 November 2024) ↩
-
DESNZ ‘Digest of UK Energy Statistics 2024 Chapter 4: natural gas’ (viewed on 13 November 2024) ↩
-
IEA ‘Global Gas Security Review 2024’ (viewed on 13 November 2024) ↩
-
National Gas ‘Appendix 5.2 Storage Infrastructure, National Gas Ten Year Statement’ (viewed on 13 November 2024) ↩
-
DESNZ analysis of National Gas data (viewed on 13 November 2024) ↩
-
National Gas ‘Demand-Side Response](https://www.nationalgas.com/our-businesses/system-operation/demand-side-response)’ (viewed on 13 November 2024) ↩
-
National Gas ‘Demand-Side Response’ (viewed on 13 November 2024) ↩
-
National Gas ‘Demand-Side Response’ (viewed on 13 November 2024) ↩
-
National Gas ‘DSR Outcome Report 2024’ (viewed on 13 November 2024) ↩
-
National Gas ‘DSR Outcome Report 2024’ (viewed on 13 November 2024) ↩
-
NG’s license is granted by Ofgem to cover their role as the gas transporter that owns and maintains the National Transmission System (NTS) ↩
-
1-in-20 peak aggregate daily demand is the level of daily demand that, in a long series of winters, with connected load held at the levels appropriate to the winter in question, would be exceeded in one out of 20 winters, with each winter counted only once. This includes within-day gas flow variations ↩
-
The 1-in-50 standard is a function of the requirement for transportation arrangements to be consistent with the suppliers’ “domestic customer supply security standards” regarding available annual supplies. ↩
-
This includes entry, exit and transportation capacity. ↩
-
Operational maximum supply factors in that it is not possible to achieve maximum supplies of continental European imports and LNG at the same time due to a capacity constraint in the national transmission system. ↩
-
Recent NG Winter Outlook peak day supply margins include 122mcm (2022/23 Outlook) and 104mcm (2021/22). Previous peak day supply margins were lower – e.g. 79mcm (2020/21) and 89mcm (2019/20 Outlook). ↩
-
Low winds, and therefore high gas-for-power, are factored into peak day demand. ↩
-
DESNZ and DBT ‘Guidance: UK ban on Russian oil and oil products’ (viewed on 13 November 2024) ↩
-
DESNZ ‘Energy Trends, Section 3’ (viewed on 13 November 2024) ↩
-
DESNZ ‘DUKES 2024, Section 1’ (viewed on 13 November 2024) ↩
-
DESNZ ‘DUKES 2024, Section 3’ (viewed on 13 November 2024) ↩
-
NSTA ‘Production and expenditure projections’ (viewed on 13 November 2024) ↩
-
DESNZ ‘Energy Trends September 2024: Diversity of supply for oil and oil products in OECD countries in 2023’ (viewed on 13 November 2024) ↩
-
DESNZ ‘Energy Trends Table 3.14’ (viewed on 13 November 2024) ↩
-
DESNZ ‘Energy Trends Table 3.14’ (viewed on 13 November 2024) ↩
-
DESNZ Energy Trends Table 3.5 (viewed on 13 November 2024) ↩
-
DESNZ ‘Energy and emission projections, Annex F’ (viewed on 13 November 2024) ↩
-
DESNZ ‘DUKES Table 1.1’ (viewed on 13 November 2024) ↩
-
DESNZ ‘Average road fuel sales, deliveries and stock levels’ (viewed on 13 November 2024) ↩
-
Energy Act 2023 (viewed on 13 November 2024) ↩