Statistics on International Development: Final UK Aid Spend 2019
Updated 20 July 2021

© Crown copyright 2021
This publication is licensed under the terms of the Open Government Licence v3.0 except where otherwise stated. To view this licence, visit nationalarchives.gov.uk/doc/open-government-licence/version/3 or write to the Information Policy Team, The National Archives, Kew, London TW9 4DU, or email: psi@nationalarchives.gov.uk.
Where we have identified any third party copyright information you will need to obtain permission from the copyright holders concerned.
This publication is available at https://www.gov.uk/government/statistics/statistics-on-international-development-final-uk-aid-spend-2019/statistics-on-international-development-final-uk-aid-spend-2019
Additional Tables and Annexes are available.
Summary
In 2019:
- the final ODA:GNI ratio was 0.70%
- UK Official Development Assistance (ODA) spend was £15,197 million, an increase of £645 million (4.4% increase) on 2018
- UK bilateral ODA spend was £10,258 million (67.5% of total UK ODA) while UK core funding to multilaterals was £4,939 million (32.5% of total UK ODA)
- DFID spent £11,107 million of ODA in 2019. This was an increase of £211 million (or 1.9%) compared with 2018
- ODA spend by departments other than DFID and other contributors of UK ODA was £4,090 million in 2019, an increase of £434 million, or 11.9%, on 2018
- Africa remained the largest recipient of UK region-specific bilateral ODA in 2019 – accounting for 50.6%
- the top 3 recipients of UK bilateral country specific ODA were Pakistan (£305m), Ethiopia (£300m) and Afghanistan (£292m)
- UK bilateral ODA to Yemen was £260 million, an increase of £94 million compared to 2018 - this was the largest increase to any country in 2019
- the largest amount of bilateral ODA was focused on Humanitarian Aid (£1,536m), Health (£1,431m) and Multisector/ Cross-Cutting (£1,325m) sectors. For more information see the Multilateral Funding section
About this release
What is ODA?
Official Development Assistance (ODA) is provided according to the standardised definitions and methodologies of the Organisation for Economic Cooperation and Development’s (OECD) Development Assistance Committee (DAC). ODA is defined as resource flows to developing countries and multilateral organisations, which are provided by official agencies (e.g. the UK Government) or their executive agencies, where each transaction meets the following requirements:
- it is administered with the promotion of the economic development and welfare of developing countries as its main objective
- it is concessional, including grants and soft loans[footnote 1]
Which countries are ODA eligible?
The list of countries eligible to receive ODA is set by the OECD Development Assistance Committee (DAC). Gross National Income (GNI) per capita below the World Bank high-income threshold defines the coverage and boundaries of the list. It includes all low, lower-middle and upper-middle income countries, except for those that are members of the G8 or the European Union (including countries with a firm accession date for EU membership). The DAC reviews the list every 3 years. Countries ‘graduate’ if they have surpassed the high- income GNI per capita threshold for the 3 consecutive years prior to a graduation year.
What is in the report?
This report contains the release of finalised UK ODA spend figures for the calendar year 2019, including:
- total UK spend on ODA, the UK’s ODA:GNI ratio and a breakdown of spend by main government department delivery channels
- analysis of UK ODA spend by recipient country or multilateral organisation, as well as type of assistance and sector
- comparisons between the UK and other donor countries
Comparisons between 2018 and 2019 ODA figures are made, as well as trends over the last 5 years (2015 to 2019 inclusive as shown in most tables). This publication updates previous provisional figures of UK ODA for 2019 published in April 2020.
Notes to users
On the 2 September 2020 the Department for International Development (DFID) and Foreign and Commonwealth Office (FCO) merged to form a new department - the Foreign, Commonwealth & Development Office (FCDO). The UK ODA figures contained in this report are for 2019 ODA spending, when DFID and the FCO were separate departments, and as such, spend by these departments are reported separately.
What else is included as part of Statistics on International Development?
All data tables included in this report are available to download in spreadsheet format. A full micro-dataset is also available in Open Data Standard format on the Statistics on International Development webpage. If you require any other data or information, or if you have any thoughts about how to improve the publication, please contact the statistics team at: statistics@fcdo.gov.uk.
Further information on the technical terms, data sources, quality and processing of the statistics in this publication are found in Annexes 1-3 on the Statistics on International Development webpage.
Private spending or donations made to support developing countries, for example by the public, the voluntary sector or through remittances, are not part of the ODA definition and not covered in this publication. Information on this spend can be found in the Office for National Statistics, Living costs and Food Survey or the Charities Aid Foundation’s UK giving report.
UK ODA flows
This chapter provides an overview of UK Official Development Assistance (ODA). It covers the total amount of UK ODA spent in 2019, the calculation of the ODA:GNI ratio, longer-term spending trends, breakdowns of UK ODA spend by main delivery channel, and by Government Departments and other contributors.
The ODA:GNI Ratio
The ODA:GNI ratio presents the amount of UK Official Development Assistance (ODA) as a proportion of Gross National Income (GNI).
Key definition – 0.70% commitment
The ODA:GNI commitment of 0.7% was first agreed internationally in 1970 by the United Nations General Assembly. The UK government made a commitment to spend 0.7% of GNI on ODA from 2013. In 2015 the International Development (Official Development Assistance Target) Act placed the 0.7% commitment in UK law from 2015 and in each subsequent calendar year.
Table 1 shows that in 2019:
- the ODA:GNI ratio was 0.70%. The commitment to spend 0.7% of GNI on ODA has been met
- UK ODA was £15,197 million, an increase of £645 million (4.4% increase) on 2018
The Office for National Statistics (ONS) implemented a new methodology for calculating GDP in its September 2019 Blue Book (the UK National Account statistics), that in turn had an impact on Gross National Income (GNI). The GNI used to calculate the ODA:GNI ratio for 2019 is based on the pre-2019 Blue Book methodology. From 2020, the ODA:GNI ratio will be calculated according to the new methodology. For more details see background note on ODA spending and reporting.
Long-term trends in UK ODA spend
Figure 1 shows the total amount of UK ODA spending each year since 1970. Overall there has been a steady increase in the amount of UK ODA since 1970, with a spike in 2005 and 2006 which was driven by high levels of debt relief[footnote 2], and then a steep increase in 2013 (by £2.6 bn) when the UK Government first met the 0.7% ODA:GNI commitment.
Since 2013, UK ODA has continued to increase in line with growth in the UK’s GNI. The relatively larger increase in the level of ODA in 2016 (by £1.2bn) reflects the switch to the European System of Accounts (ESA) 2010 methodology for measuring GNI and the consequent increase in UK ODA to meet the 0.7% ODA commitment on that basis.
Figure 1: UK ODA levels (£ billions) and ODA:GNI ratios (%), 1970 - 2019
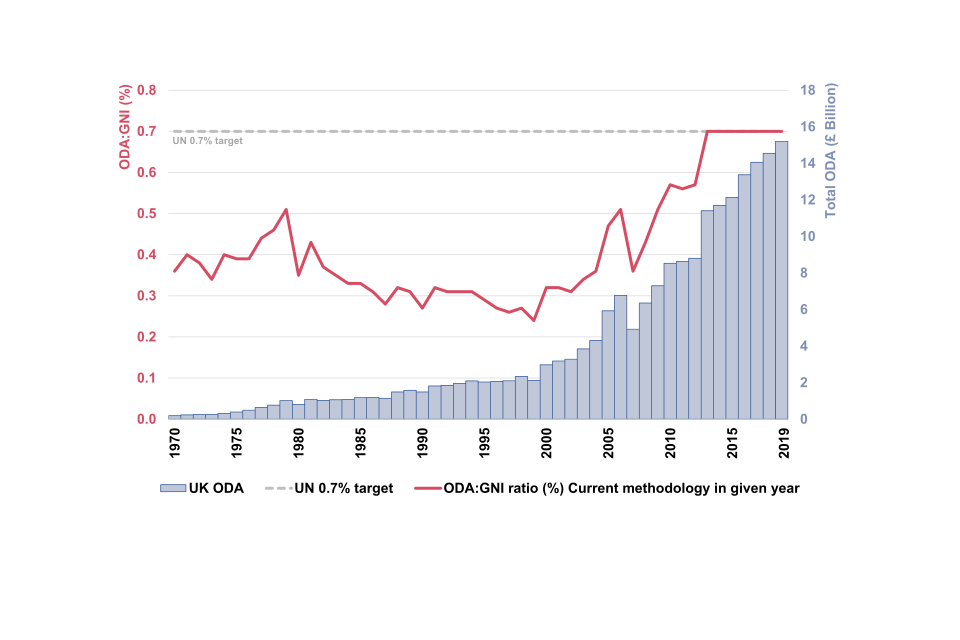
Figure 1: UK ODA levels (£ billions) and ODA:GNI ratios (%), 1970 - 2019
Figure 1 legend: The blue bars are the UK ODA spend from 1970 to 2019, the pink line is the calculated ODA:GNI ratio from 1970 to 2019 and the grey dashed line is the 0.7% ODA:GNI target set by the United Nations General Assembly in 1970. From 2018 onwards, ODA has changed from being measured on a cash basis to being measured on a grant equivalent basis, following a decision taken by the DAC in 2014[footnote 3].
UK ODA by main delivery channel
There are 2 main delivery channels for ODA: bilateral and multilateral (Figure 2).
Bilateral ODA is earmarked spend, i.e. the donor has specified where and/or what the ODA is spent on – this is usually ODA going to specific countries, regions or programmes. There are two types of bilateral ODA:
- ‘bilateral through multilateral’: this is earmarked ODA spent through multilateral organisations. For example, support to the World Food Programme’s (WFP) Emergency Operations in Yemen
- ‘other bilateral’: this is earmarked ODA spent directly by governments or through other delivery partners, such as Non-Governmental and Civil Society Organisations, research institutions and universities. For example, delivering family planning services across Malawi through an NGO
Core multilateral ODA is un-earmarked funding from national governments to multilateral organisations[footnote 4], which are pooled with other donors’ funding and disbursed as part of the core budget of the multilateral organisation[footnote 5]. For example the UK’s contribution to the World Bank International Development Association. Core contributions will fluctuate from year to year in part due to the payment schedules of the receiving multilateral organisation.
- £4,939 million of UK ODA spend was delivered through core contributions to multilateral organisations. This was a 7.0% fall (£374m) compared to 2018. in part due to decrease in the amount of UK core funding to the International Development Association (part of the World Bank Group). This reflects that core contributions to multilaterals, are in general, based on multi-year commitments which may not be uniformly spread across years
- £10,258 million of UK ODA spend was delivered through bilateral channels. This was a 11.0% increase (£1,019m) compared to 2018. The increase in bilateral spend was the largest increase seen since 2016, when the UK switched to the ESA 2010 methodology for GNI estimates
- £3,066 million of bilateral ODA was delivered through multilateral organisations, an increase of £294 million compared to 2018. The proportion of bilateral through multilateral slightly increased compared to 2018 - accounting for 20.2% of UK ODA
- bilateral ODA accounted for 67.5% of total UK 2019 ODA. In comparison, over the previous five years (2014 to 2018) bilateral ODA represented on average 62.4%. This shift in share was in part driven by the decrease seen in the UK’s core contributions to multilaterals as well as the actual increase in bilateral ODA spend.
Figure 2: Total UK ODA by main delivery channel (%), 2015-2019
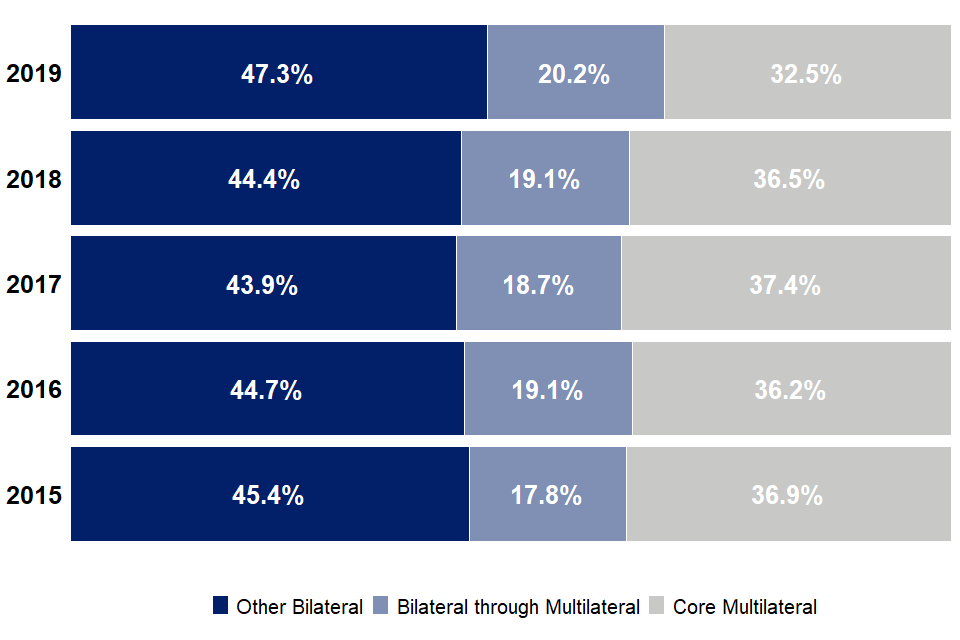
Figure 2: Total UK ODA by main delivery channel (%), 2015-2019
Figure 2 legend: Total UK ODA by main delivery channel. The bars for each year represent 100% of total UK ODA spend. The dark blue section represents the proportion of total UK ODA delivered through ‘Other Bilateral’ channels. The lighter blue represents the same measure but for ODA delivered through the ‘Bilateral through Multilateral’ channel. The grey section represents the proportion of total UK ODA that was channelled as core contributions to multilaterals, ‘Core Multilateral’. Note, percentages may not sum to 100 due to rounding.
Makeup of UK ODA by Government Department and other contributors of UK ODA
The overall amount of ODA spend is determined by the size of GNI, however shifts in departments and other ODA contributors’ share of ODA depends on their spending in the given year.
Figure 3 (and Table 2) shows 2019 ODA spend by government department and other contributors of UK ODA, as well as changes in ODA spend from 2018.
Contributors of UK ODA in 2019
- DFID spent £11,107 million of ODA in 2019. This was an increase of £211 million (or 1.9%) compared with 2018. In particular, DFID’s bilateral ODA spend increased by £711 million, to £7,064 million in 2019. An area of bilateral spend which increased in 2019 was DFID’s capital injection to CDC, the UK’s Development Finance Institution, which increased by £266 million. The increase in capital will be used to make investments in Africa and South Asia
- ODA spend by departments other than DFID (Other Government Departments - OGDs) and other contributors of UK ODA (referred to collectively in Table 2 as non-DFID spend) was £4,090 million in 2019, an increase of £434 million, or 11.9%, on 2018
- ODA spend by Other Government Departments was the driver behind the increase in non-DFID ODA, with the top 7 highest spending departments all spending more when compared with 2018. Other Government Departments spent £3,398 million of ODA in 2019, increasing by £434 million on 2018
The largest year on year increases were:
- Home Office spent £452 million of ODA in 2019, an increase of £115 million, or 34.0%, on 2018. This was due to a rise in spending to support asylum seekers in the UK, primarily reflecting an increase in Asylum Support volumes in 2019 when compared to 2018
- BEIS spent £960 million of ODA in 2019 – an increase of £110 million, or 12.9%, on 2018. Funding on research activities increased by £90 million while spending on climate-related programmes increased by £20 million
- the Cross-Government Prosperity Fund spent £176 million of ODA in 2019, this was an increase of £83 million, or 88.3%, on 2018. The Cross-Government Prosperity Fund has increased its ODA spend year on year, since the fund started spending ODA in 2016, as they move more programmes into implementation
Non-departmental ODA, for example Gift Aid claimed by charities carrying out ODA eligible activities and spend by Devolved Administrations, contributed £692 million in 2019, approximately the same compared to 2018. For the first time since 2014, there was no core contribution to the IMF-Poverty Reduction Growth Trust.
Contributors’ share of UK ODA
- despite DFID’s ODA spend increasing, DFID’s share of total ODA dropped from 74.9% in 2018 to 73.1% in 2019. This decrease contrasts with the direction of travel in 2018 when DFID’s share increased for the first time since 2013
- the share of total ODA spent by non-DFID contributors increased from 25.1% in 2018, to 26.9% in 2019. This share was still below the 2017 level of 28.1%
- of the non-DFID contributors, Other Government Departments’ (OGDs) ODA accounted for 22.4% of total UK ODA, their largest share over the last 10 years. The largest OGD shares of ODA were: the Department for Business, Energy & Industrial Strategy (BEIS) (6.3% of ODA); the Foreign and Commonwealth Office (4.5%), the Conflict, Stability and Security Fund (4.3%); and the Home Office (3.0%)
- the largest non-departmental sources (referred to as Other UK Contributors of ODA in Figure 3) were non-DFID EU attribution (3.2% of UK ODA) and Gift Aid claimed by charities working on ODA eligible activities (1.0% of UK ODA). These shares are similar to 2018
Figure 3: Breakdown of UK ODA by contributor (2015, 2018 and 2019)
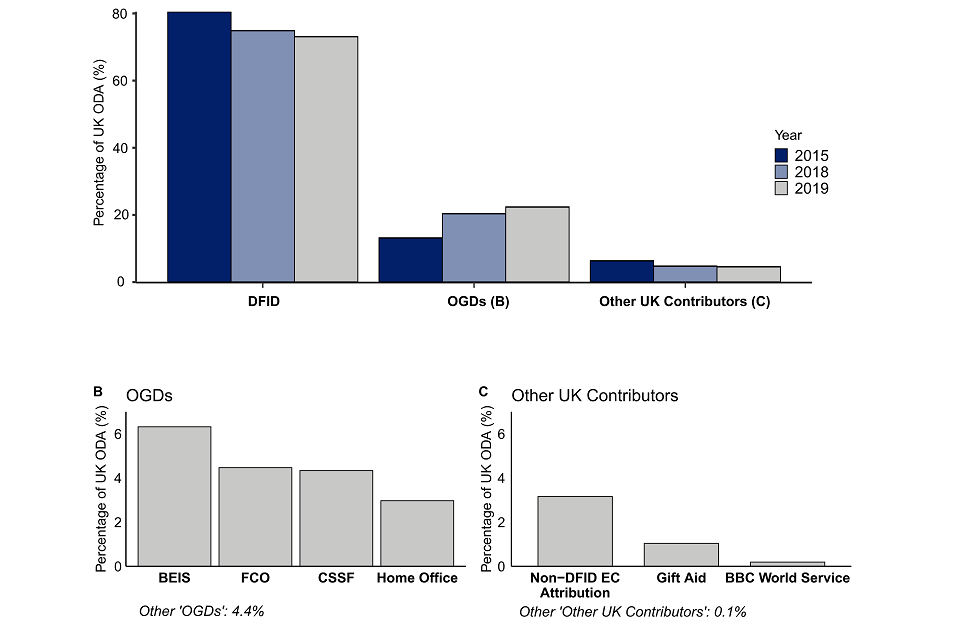
Figure 3: Breakdown of UK ODA by contributor (2015, 2018 & 2019)
Figure 3 legend: A) Percentage of UK ODA spend by DFID, Other Government Departments (OGDs) and Other UK Contributors (Other Contributors) in 2015 (dark blue), 2018 (light blue) and 2019 (grey). BEIS=Department for Business, Energy and Industrial Strategy; FCO=Foreign & Commonwealth Office.
B. Other = “Other government departments”: Department of Health and Social, Prosperity Cross-Government Fund, HM Treasury, Department for Environment, Food and Rural Affairs, Department for Work and Pensions, Department for Education, HM Revenue and Customs, Department for Digital, Culture, Media and Sports, Ministry of Defence, and Office for National Statistics, Department for International Trade.
C. Other = “Other contributors of UK ODA”, Scottish Government, Other In-Donor Refugee Costs, Colonial Pensions administered by DFID and Welsh Government.
Cross - Government Funds
There are 2 cross-government funds, the Conflict, Stability and Security Fund (CSSF) and the Cross-Government Prosperity Fund. These funds are overseen by the National Security Council (NSC[footnote 6]), that sets overall strategic direction. Individual departments that bid for funding are accountable for their own spending and delivery under the given fund.
Conflict, Stability and Security Fund
CSSF delivers ODA activities to tackle instability and prevent conflicts. In 2019, £659 million was delivered through the fund, an increase of £54 million compared to 2018. This was driven by increased spending by the Foreign and Commonwealth Office (FCO) and DFID. FCO remained the largest spender of CSSF ODA funds, (69.1% of total CSSF ODA). For the departmental breakdown see Table 4a.
Cross-Government Prosperity Fund[footnote 7]
The Cross-Government Prosperity Fund promotes economic reform and development in recipient countries. In 2019, £176 million was delivered through the Cross-Government Prosperity Fund. This was an increase of £83 million compared to 2018, reflecting increased spending by FCO and DFID. While FCO remained the largest spender of Cross-Government Prosperity Fund ODA (accounting for 49.7%), DFID’s share rose from 12.3% in 2018 to 36.9% in 2019. For the departmental breakdown see Table 4b.
Analysis of UK ODA spend
This chapter provides an overview of where UK ODA is spent. Section 4.1 provides a detailed breakdown of ODA spending by recipient region and country; section 4.2 provides a breakdown of ODA spending by sector (for example, health or humanitarian aid); and section 4.3 provides a breakdown of ODA spending to multilateral organisations.
Regional / Country Breakdowns of Bilateral ODA Spend[footnote 8]
Bilateral ODA is earmarked spend either through multilateral organisations or other delivery partners, compared with multilateral ODA which is un-earmarked funding to multilateral organisations[footnote 9]. Bilateral ODA includes spend to specific countries or regions (sections 4.1.1-4.1.4) as well as spend to multiple countries and/or regions[footnote 10]. Also included is spend within specific sectors for which there are no designated benefitting country or region or where benefitting countries are not known until the end of the programme[footnote 11] (section 4.1.5).
Bilateral ODA spend by region
In 2019, 57.6% (£5,908m) of the UK’s bilateral ODA was allocated to a specific country or region. This is an increase in spend (£5,659m in 2018) but a decrease in terms of percentage share from 2018 (61.3% in 2018). This was partly due to an increase in ‘Developing Country Unspecified’ spending in 2019. See SID 2018 p.35 case study for more information on ‘Developing Country Unspecified” spend.
Africa continues to be the region receiving the largest proportion of UK bilateral ODA allocated to a specific country or region (50.6%). ODA spend allocated to Africa increased by £125 million increase in 2019 to £2,989 million, whilst the percentage share remained similar to the share in 2018 (50.6%), (Figure 4).
Asia remains the second largest recipient of UK bilateral ODA in 2019 with 41.8% (£2,470m), followed by the Americas with 4.1% (£244m), Europe with 3.2% (£189m) and the Pacific with 0.3% (£16m).
Figure 4: UK Bilateral ODA by receiving region (£ millions), 2009-2019
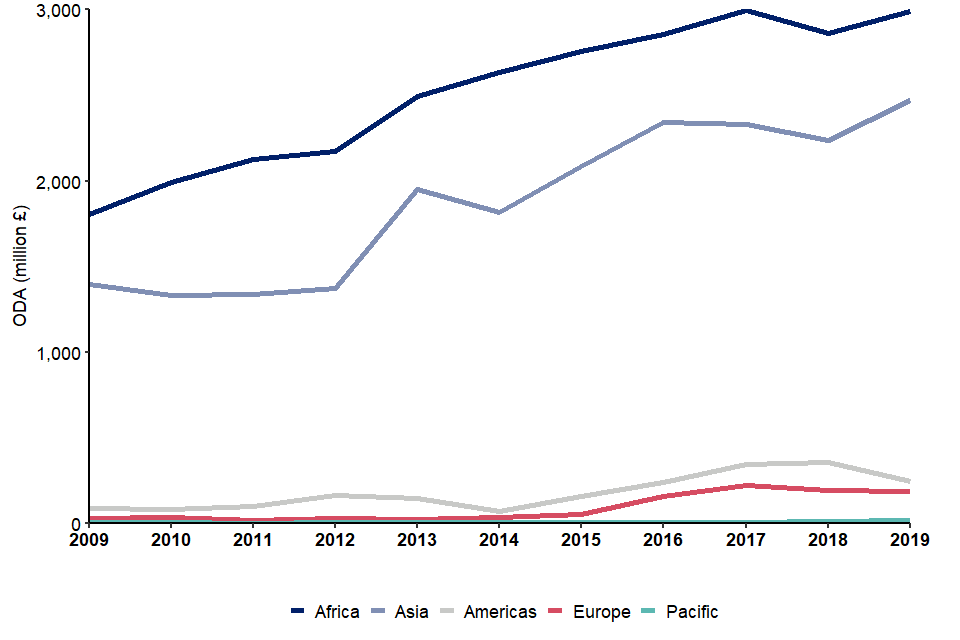
Figure 4: UK Bilateral ODA by receiving region (£ millions), 2009-2019
Figure 4 legend: UK bilateral ODA by receiving region (£ millions), 2009 – 2019. Dark blue = Africa, light blue = Asia, grey = Americas, pink = Europe, teal = Pacific.
Changes in the Regional Flow of UK Bilateral ODA
Africa
2019: Bilateral ODA to Africa increased by £125 million from £2,863 million in 2018 to £2,989 million in 2019, increasing by 4.4% (Figure 4). The majority of this increase was spent in the health sector, and the largest country-specific increase was to South Sudan (see 4.1.3.2 for more information).
Over 5 years: Africa has consistently received the largest amount of UK ODA. Bilateral ODA to Africa increased steadily from 2015 briefly dropping in 2018 to £2,863 million. This followed a ‘peak’ in 2017 as a result of high levels of humanitarian aid. While there has been an increase since 2018, the total bilateral ODA to Africa remains below this ‘peak’ (£7m less than levels in 2017).
Asia
2019: In 2019, the volume of bilateral ODA to Asia was £2,470 million, increasing by 10.5% or £235 million from 2018 (Figure 4). This was mostly due to an increase in humanitarian aid spend, with the largest country specific increase to Yemen (see Case Study 1, p. 32, for a more detailed look at the story in Yemen).
Over 5 years: Increasing from 2015, spend to Asia reached a ‘peak’ in 2016 before steadily falling by £109 million to £2,235 million in 2018. Spend in 2019 increased from 2018, with total bilateral ODA received by Asia being £126 million higher than the previous ‘peak’ in 2016.
The Americas
2019: The Americas received £244 million of UK bilateral ODA in 2019, a decrease of £111 million or 31.3% compared to 2018 (Figure 4). This decrease was partly due to smaller spend in the Caribbean.
Over 5 years: ODA to the Americas is on a smaller scale than spend to Africa and Asia, however despite the drop this year, it had been increasing steadily year-on-year from £159 million in 2015 to £355 million in 2018.
Europe
2019: Europe received £189 million of UK bilateral ODA in 2019, a decrease of £6 million compared to the previous year (Figure 4). The most significant reduction was seen in Turkey (£16.3m decrease since 2018) reversing previous increases in funding (2016 and 2017) to support displaced refugees during the Syria Crisis.
Over 5 years: Like the Americas, ODA spend in Europe[footnote 12] is small compared to Asia and Africa. Bilateral ODA to Europe has increased from £55 million in 2015 to £189 million in 2019.
Pacific
A small proportion of UK bilateral ODA goes to the Pacific (Figure 4). In 2019, UK bilateral ODA to the region was £16 million, 0.3% of total UK bilateral ODA spend allocated to a region or country. This is an increase of £5 million from last year, with Fiji being the largest country specific recipient.
Bilateral ODA spend by country
In 2019, the UK provided bilateral assistance to 136 countries (Figure 5), with spend primarily concentrated in East Africa and the Middle East.
Figure 5: Map of UK Bilateral ODA Spend by Recipient Country: 2019
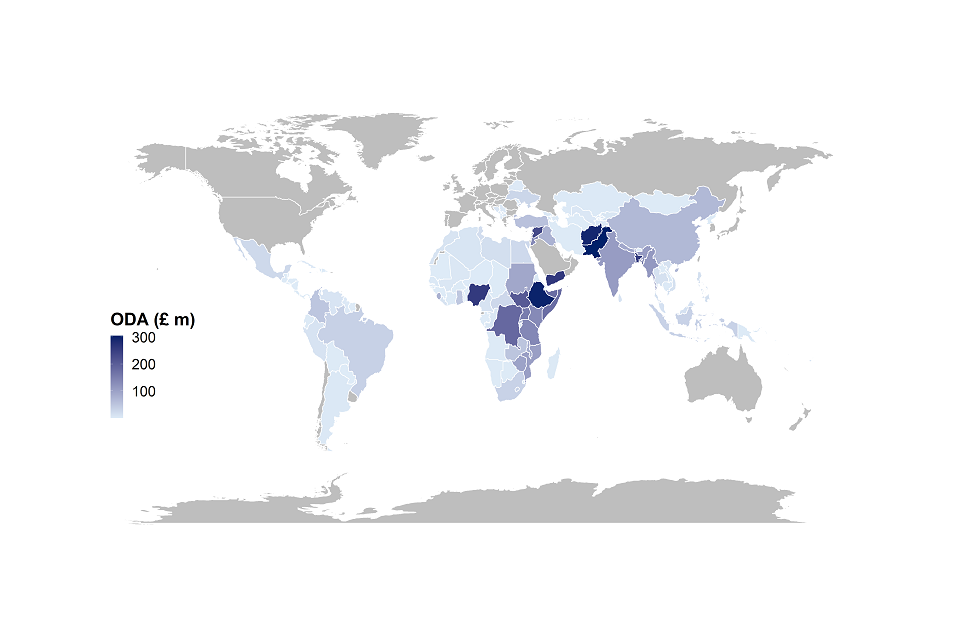
Figure 5: Map of UK Bilateral ODA Spend by Recipient Country: 2019
Figure 5 legend: World Map coloured by amount of bilateral ODA spend in recipient country (£ million) in 2019. Highlighted countries are those in receipt of UK bilateral ODA, and colours are based on amount received (dark blue=higher amounts UK Bilateral ODA received, light blue=lower amounts UK Bilateral ODA received).
Top 5 country-specific recipients of UK ODA
- UK bilateral ODA spend to the top 5 recipient countries in 2019 increased from £1,409 million in 2018 to £1,415 million in 2019. This spend in the top 5 countries represents 28.3% of the total country-specific UK bilateral ODA in 2019, a slight reduction from 2018 when they comprised 31.2% of the total (Figure 6)
- in 2019 the top 3 recipients of UK bilateral country specific ODA were Pakistan (£305m), Ethiopia (£300m) and Afghanistan (£292m) (Figure 6). Spend to these countries accounted for 17.9% of total country-specific UK bilateral ODA
- Pakistan has remained the top recipient of UK bilateral ODA for the fifth consecutive year. Spend in Pakistan was mainly focused on Education (38.4%) as well as Government and Civil Society (16.4%) (see Section 4.2.3 for more information on sector specific breakdowns)
- Ethiopia has remained the second largest recipient of bilateral ODA although spend slightly decreased in 2019 from 2018 - a decrease of £2 million. Despite the slight downward trend since 2015, spend is still higher than in 2012
- spend to Afghanistan has fluctuated over the last 10 years. In 2019, UK bilateral ODA received by Afghanistan increased compared with 2018 to £292 million (an increase of £43m) (Figure 6). This was partly driven by frontline diplomacy[footnote 13] and humanitarian aid
- Yemen (fourth largest recipient of UK ODA in 2019) saw the largest increase in bilateral ODA spend, increasing by 56.5% from £166 million in 2018 to £260 million in 2019, surpassing the spend in 2017 (£205m) (Figure 6). Programmes involved providing humanitarian assistance such as immediate relief and emergency food
- Nigeria saw the largest decrease in bilateral ODA compared to all other recipients, with spend decreasing from £297 million in 2018 to £258 million in 2019 (the next largest decrease was Pakistan by £26m). This drop in ODA, moved Nigeria from being the third largest recipient of UK country-specific bilateral ODA in 2018 to fifth in 2019 (Figure 7), Nigeria’s lowest position in 5 years. This follows a peak in 2017, in part driven by increased humanitarian assistance to conflict affected populations
Figure 6: Top 5 country-specific bilateral ODA recipients, 2009-2019
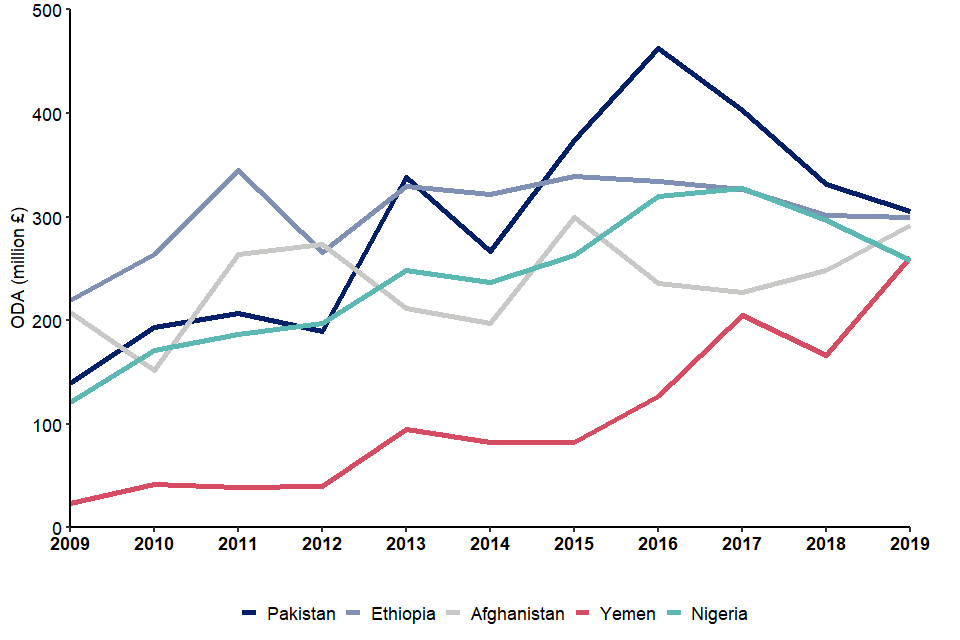
Figure 6: Top 5 country-specific bilateral ODA recipients, 2009-2019
Figure 6 legend: Top 5 Recipients of 2019 UK Bilateral ODA (£ millions), 2009 to 2019. Dark blue = Pakistan, light blue = Ethiopia, grey = Afghanistan, pink = Yemen, teal = Nigeria.
Other major changes in top 10 country-specific rankings
- South Sudan returned to the top 10 in 2019, becoming the third highest African recipient of UK bilateral country-specific ODA. Spend increased by £56 million on 2018 to £207 million in 2019. The majority of which went to the health sector, primarily for basic and reproductive healthcare
- in 2019, Bangladesh was the sixth largest recipient of UK bilateral country-specific ODA, up from eighth in 2018. This was primarily driven by an increase in humanitarian aid spending (£45m increase on 2018) with material relief assistance and services being provided for Rohingya refugees
- Tanzania moved out of the top 10 recipients of UK bilateral ODA, this was partly driven by a decrease in spend to programmes focused on social and economic infrastructure and services (Figure 7)
Figure 7: Rank of top 10 recipients of country-specific 2019 UK bilateral ODA
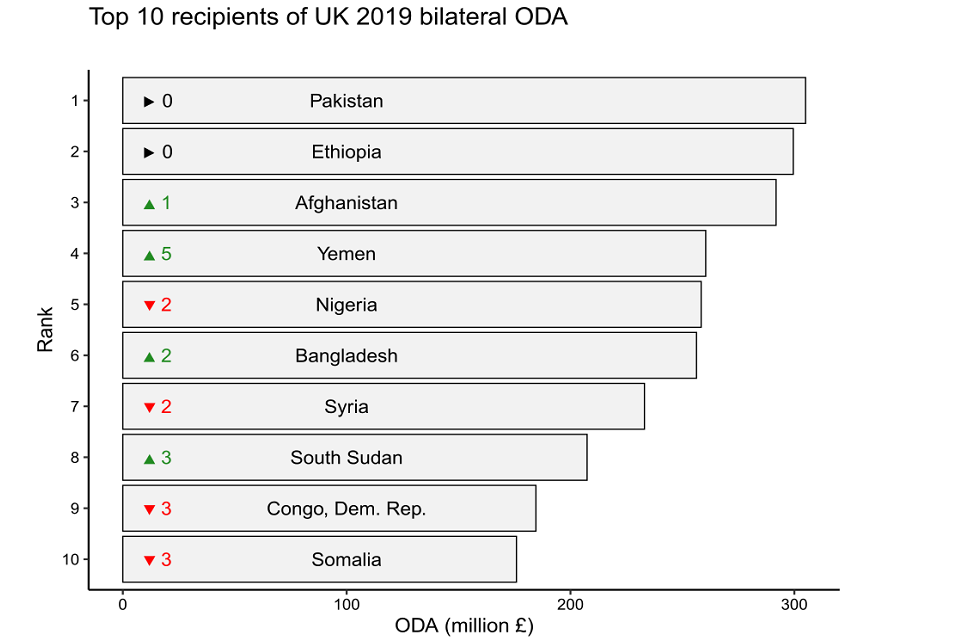
Figure 7: Rank of top 10 recipients of country-specific 2019 UK bilateral ODA
Figure 7 legend: Top 10 Recipients of UK 2019 Bilateral ODA[footnote 14]. The rank (1:10) is on the y-axis, ODA spend (million £) is on the x-axis. The country names and numbers inside each bar are how the rank for that country compared to last year (2018), coloured in red if it’s decreased (with a red downward pointing arrow), green if it’s increased (with a green upward pointing arrow) and black if its unmoving (with black horizontal pointing arrow). For example, Afghanistan in 2018 was in 4th position, and in 2019 is in 3rd position (a change of +1).
Income groups
ODA eligible countries are classified into 4 groups – Least Developed (LDC), Other Low Income (Other LIC), Lower Middle Income (LMIC) and Upper Middle Income (UMIC) Countries. These are based on gross national income per capita published by the World Bank. The list of countries is reviewed every three years by the OECD-DAC, and countries exceeding the high-income threshold for 3 consecutive years are no longer ODA eligible.
Income groups: country-specific ODA
- total UK bilateral ODA received by LDCs and Other LICs increased by 13.1% (£328m) from £2,496 million in 2018 to £2,823 million in 2019 (Figure 8). Seven of the top ten country-specific ODA increases from 2018 were seen in LDC/Other LICs (Yemen, Bangladesh, South Sudan, Uganda, Afghanistan, Mozambique and Zambia)
- LDCs and Other LICs continue to account for the largest proportion of bilateral country-specific ODA spend in 2019 – at 56.4%
- UK ODA to LMICs represented 29.7 per cent (£1,488m) of UK country specific bilateral ODA in 2019, compared to 32.3% (£1,458m) in 2018
- total UK bilateral ODA received by UMICs increased by £136 million to £694 million in 2019. The largest increase in UMIC country-specific spend was to Lebanon (increased by £52m), followed by Colombia (increased by £15m)
- UK ODA to UMICs represented 13.9% of UK country specific bilateral ODA in 2019 compared to 12.4% in 2018
Figure 8: Country-specific bilateral ODA by Income Group, 2009-2019
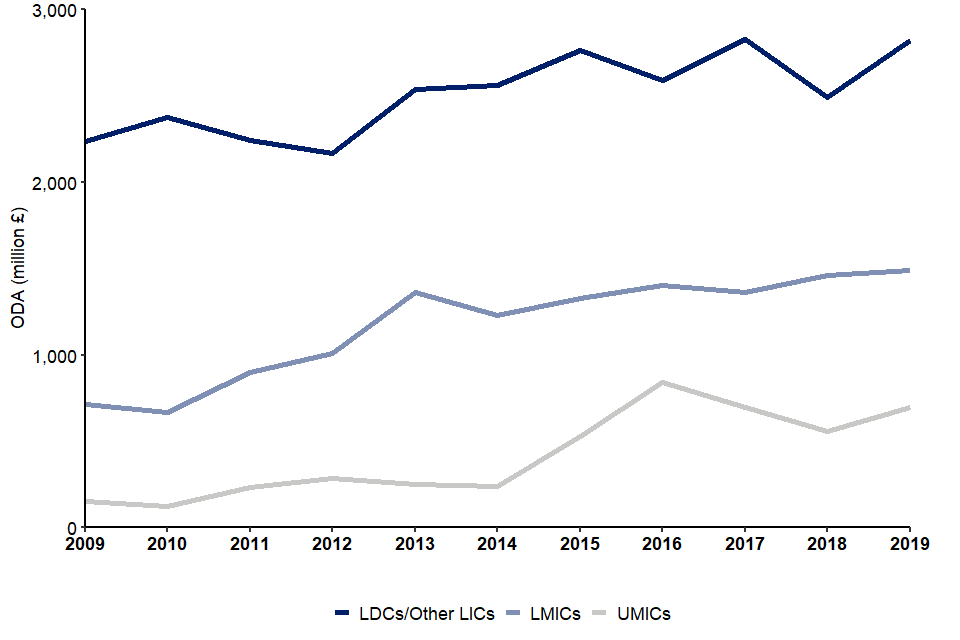
Figure 8: Country-specific bilateral ODA by Income Group, 2009-2019
Figure 8 legend: Breakdown of Country-Specific UK Bilateral ODA by Country Income Group, 2009-2019. Dark blue = LDCs/Other LICs (Least Developed Countries/Other Low Income Countries), light blue = LMICs (Lower Middle Income Countries), grey = UMICs (Upper Middle Income Countries).
Income groups: DFID - non-DFID comparison 2019
- DFID spent £3,815 million of UK bilateral country-specific ODA - accounting for 76.2% of total UK bilateral country-specific ODA in 2019 (Figure 9)
- the majority of DFID’s country-specific ODA was received by LDCs or Other LICs in 2019 – 65.1% (£2,485m)
- non-DFID contributors spent £1,190 million of UK bilateral country-specific ODA in 2019, a £308 million increase compared to 2018. The majority of non-DFID country-specific ODA was channelled to Middle Income Countries – 71.5% (£440m to LMICs and £412m to UMICs)
- LDCs and Other LICs received £339 million of non-DFID bilateral ODA in 2019, this was an increase of £112 million compared to 2018. This was the largest year-on-year increase compared to the other income groups
Figure 9: Breakdown of country-specific bilateral ODA by Income Group, 2019
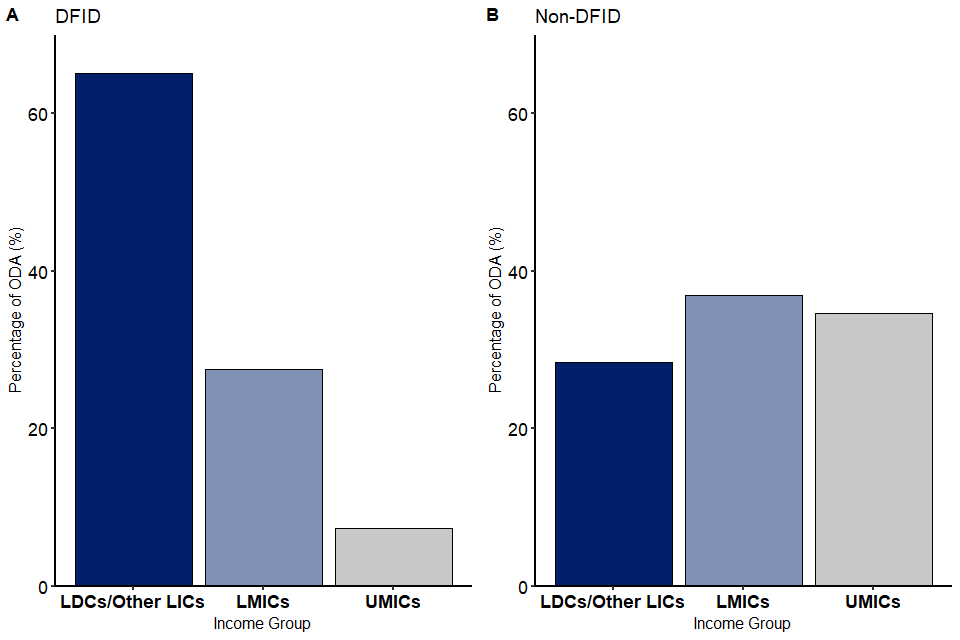
Figure 9: Breakdown of country-specific bilateral ODA by Income Group, 2019
Figure 9 legend: DFID (A) and Non-DFID (B) Breakdown of Country-Specific UK Bilateral ODA by Country Income Group, 2019. Dark blue = LDCs/Other LICs (Least Developed Countries/Other Low Income Countries), light blue = LMICs (Lower Middle Income Countries), grey = UMICs (Upper Middle Income Countries).
Bilateral ODA Spend by Region and Government Department and Other Contributors of UK ODA[footnote 15]
In 2019, 97.1% of DFID’s region-specific bilateral ODA went to countries in Africa and Asia (£4,224m). Africa has consistently been the largest recipient of DFID region-specific ODA since 2010, with a share of 56.4% in 2019 (see Figure 10A)
By contrast, the largest recipient of non-DFID region-specific ODA tends to be Asia (Figure 10B). In 2019, non-DFID ODA contributors spent £699 million in Asia, accounting for 44.8% of their total spend. Non-DFID contributors also spent a larger proportion of their ODA in Europe and the Americas (19.9%), compared to DFID (2.8%)
Compared with 2015, the percentage share of DFID’s region-specific bilateral ODA received by Africa has slightly decreased (by 3.3 percentage points) and the share received by Asia has slightly increased (by 2.2 percentage points).
The opposite pattern emerges from non-DFID contributors, with Africa’s share of non-DFID region specific bilateral ODA in 2019 increasing (by 8.0 percentage points) compared to 2015, while the share received by Asia decreased (by 10.2 percentage points) over the same period.
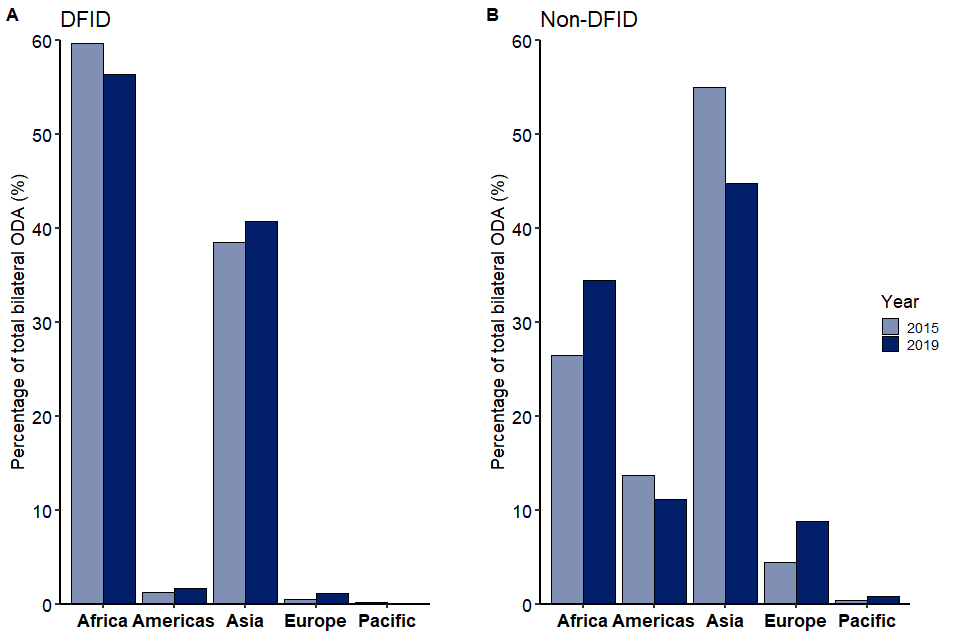
Figure 10: Breakdown of region-specific UK bilateral ODA, 2015 and 2019
Figure 9: Breakdown of DFID (A) and non-DFID (B), Country/region Specific proportion of Bilateral ODA by Region, 2015 & 2019. In dark blue are the proportions of UK bilateral ODA by region in 2015, in light blue are the proportions of UK bilateral ODA by region in 2019. Different world regions are on the x-axis (Africa, Americas, Asia, Europe, Pacific). ###Bilateral ODA Spend with No Single Benefitting Country or Region
In 2019, 42.4% (£4,350m) of UK bilateral ODA was made up of spend that was not assigned to a single benefitting country or region (i.e. developing country, unspecified ODA) (Figure 11). This is an increase compared to 2018 when 38.7% (£3,579m) of bilateral ODA was not assigned to a single benefitting country or region. Such spend comprises of, for example, centrally-funded research or programmes that develop policies which aim to benefit several developing countries. It also consists of ODA-eligible expenditure within donor countries, such as the ODA-eligible portion of costs to support asylum seekers and refugees in the UK. See the case study in SID 2018 (p. 34) for more information on ‘Developing country, unspecified’ ODA.
- 43.0% of spend within this category consists of project-type interventions and includes expenditure on multi-country or multi-region projects. As outlined above, these include programmes where there are designated benefitting countries or regions, but it is not possible to directly assign exact spend to them in the current administrative system
- 22.0% of spend within this category consists of expenditure in the UK or another donor country (e.g. support for international development work or asylum seekers/recognised refugees in the UK or another donor country), while 14.6% was for specific programmes or funds managed by international organisations in a specific sector with no designated benefitting countries. For example, DFID contributed £112 million to the Global Partnership for Education, a multilateral organisation supporting close to 70 developing countries to ensure that every child receives a quality basic education
- 11.8% was classed as ‘Other’, which includes Other Technical Assistance and Basket Funds. Other Technical Assistance includes training and research
- a further 8.6% consists of core support to Non-Governmental Organisations (NGOs) or other delivery partners, such as research institutions, where funds are not earmarked for a particular country/region and work may benefit a wide range of developing countries
Figure 11: Breakdown of UK 2019 bilateral ODA by Type of Aid
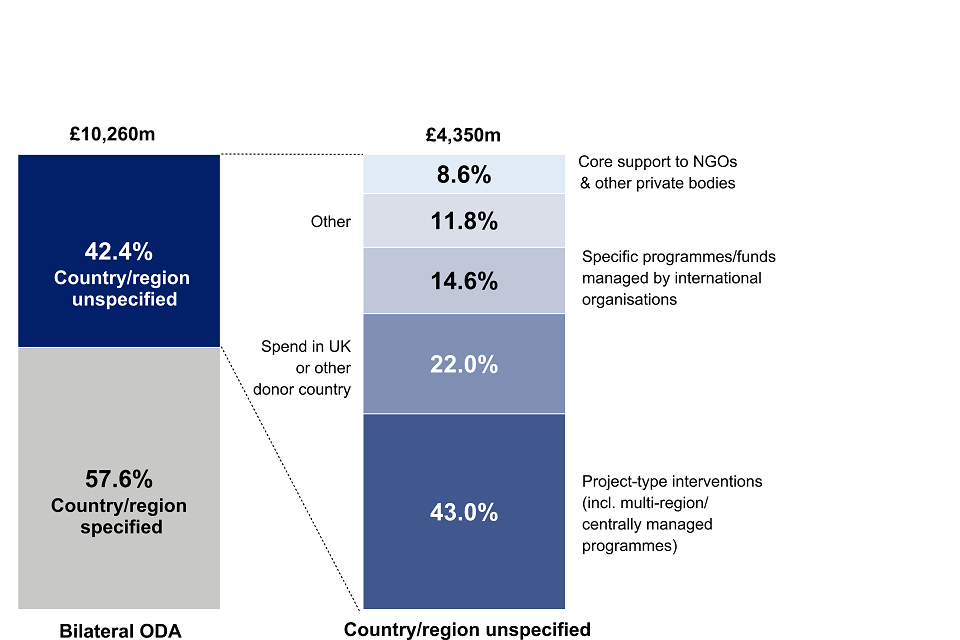
Figure 11: Breakdown of UK 2019 bilateral ODA by Type of Aid
Figure 11 legend: Breakdown of UK Bilateral ODA, 2019. Total bilateral ODA=£10.3 billion, of which £4.4 billion (42.4%) is spent in unspecified countries/regions.
View full size version of infographic: Case Study 1 - Yemen
Sector Breakdown of Bilateral ODA Spend
Bilateral ODA spend by sector in 2019
UK ODA can be classified into sectors depending on its purpose, e.g. the social, economic or humanitarian assistance area it aims to support. There are multiple levels of sector classification used: at the lowest level are sector codes[footnote 16] that describe specific areas, and these are then grouped together into OECD DAC broad sectors. These broad sectors can then be further grouped into major sectors, bringing together related themes to help simplify the key messages. See Annex 1 for more information on what is included in each sector level.
Figure 12 provides an overview of bilateral ODA by major sector in 2019, compared against 2018 spend. A more detailed breakdown of the broad sectors is given in Additional Table A7. The 5 largest sectors for bilateral spend in 2019 were:
- Humanitarian Aid - £1,536 million (15.0% of total UK bilateral ODA). Humanitarian Aid was the largest sector of ODA spend in 2019 (Figure 12). It has frequently been the top spend area in previous years, but in 2018 Humanitarian Aid was the third largest sector, after Health and Multisector/Cross-cutting. The top 3 recipients of Humanitarian Aid spend were Yemen (£219m), Syria (£194m) and Bangladesh (£125m). This sector has seen the largest increase in 2019 compared to 2018 - £237 million more than in 2018. See humanitarian factsheet (p. 35) for more background.
- Health - £1,431 million (14.0%). This was an increase of £101 million compared to 2018. Within Health, the top three spending areas in 2019 were Medical Research (£339m), Family Planning (£252m) and Infectious Disease Control (£182m).
- Multisector/Cross-Cutting - £1,325 million (12.9%). Within this major sector the top three spending areas were Research/Scientific institutions (£358m), Multisector Aid (£307m) and Environmental Policy and Administrative Management (£208m). Spend may be assigned to Multisector Aid in cases where contributions are split across a diverse group of sectors, such as Gift Aid donations to NGOs.
The largest recipient of Multisector/Cross cutting ODA was ‘Developing Countries Unspecified’ (£762m), this reflects that activities that span a range of sectors also tend to span multiple countries. An example of this would be research and environmental policy that benefit more than one developing country. - Government and Civil Society – £1,313 million (12.8%). The top 3 spending sectors in this area were ‘Public Sector Policy and Administrative Management’ (£217m), ‘Civilian Peace-Building, Conflict Prevention and Resolution’ (£199m) and ‘Media and free flow of information’ (£119m). Compared to 2018, Government and Civil Society had an increased spend of £118 million in 2019, with the majority of this coming from DFID (£90m).
- Economic Infrastructure and Services - £1,195 million (11.7%). This is an increase of £61 million in 2019 compared to 2018. Within this sector, the majority of spend in 2019 was on Financial Policy and Administrative Management (£746m).
Figure 12: Bilateral ODA by major sector, 2018 & 2019
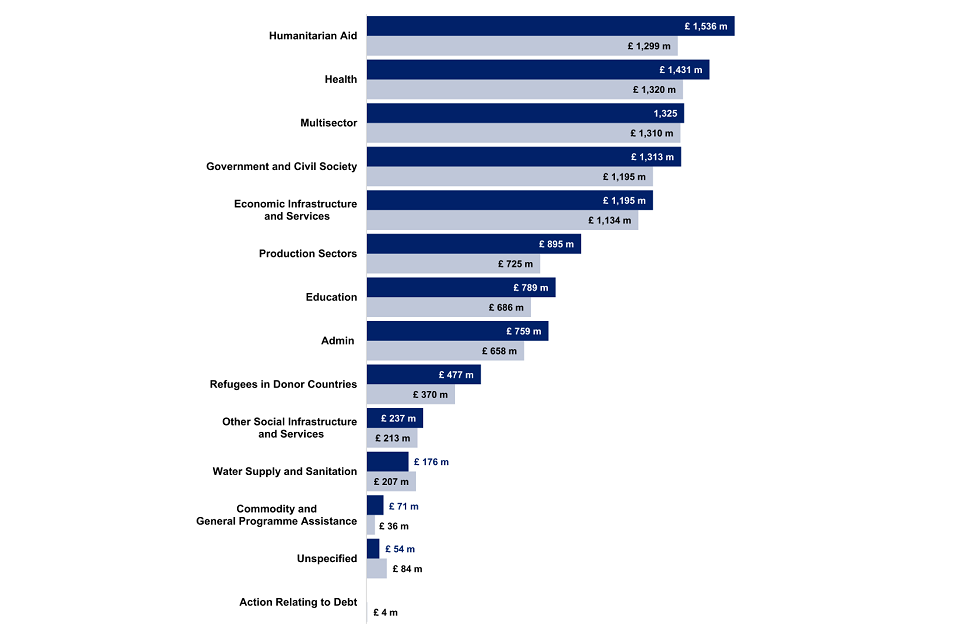
Figure 12: Bilateral ODA by major sector, 2018 & 2019
Figure 12 legend: Major Sector Spend – comparison between 2018 and 2019 bilateral ODA (£ millions). Major sectors are ordered from top to bottom by largest 2019 ODA spend. 2019 spend coloured in dark blue, 2018 spend in light blue. In 2018, there was £4 million of Debt Relief.
The percentage share of total bilateral ODA of the five largest sectors in 2019 was 66.3%, a slight increase from 2018 (67.8%). Outside of the top 5 sectors by bilateral spend, the largest changes between 2018 and 2019 were Production Sectors (increased by £171m) and support for asylum seekers in the UK – known as ‘Refugees in Donor Countries’ (increased by £108m).
Broad Sector Breakdown of Bilateral ODA Spend by Government Department and other contributors of UK ODA
Figure 13 provides a breakdown of sector spend by DFID and all Other Government Departments and other contributors of ODA (non-DFID).
- for DFID, the sector spend profile reflects greater spend in the social and disaster response sectors, such as Humanitarian Aid (£1,526m) and Health (£1,103m). DFID also contributed £1,050 million to ‘Economic Infrastructure and Services’[footnote 17]
- non-DFID spend is on a smaller scale and has a sector profile that reflects greater spend in broad sector areas such as research and policy, the largest sector spend being ‘Multisector/ Cross Cutting’ (£808m). Non-DFID contributors accounted for the total spend on ‘Refugees in Donor Countries’ (£477m) which consists of ODA eligible support for refugees in their first year of stay in the UK (for example food and shelter)
Figure 13: Bilateral ODA by Government Department and Major Sector, 2019
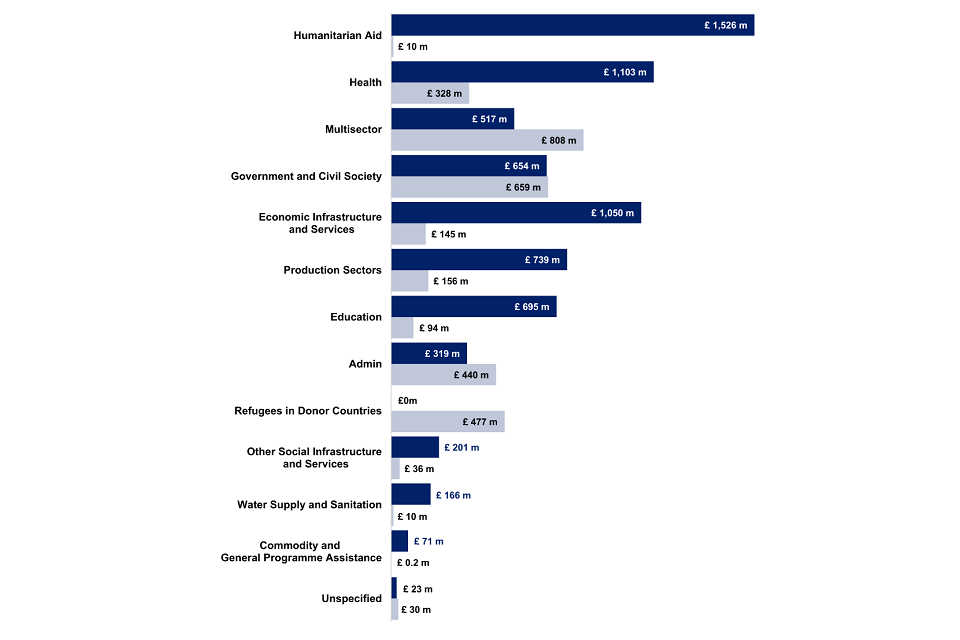
Figure 13: Bilateral ODA by Government Department and Major Sector, 2019
Figure 13 legend: DFID’s and Other Government Departments’ and Other Contributors of ODA (non-DFID) spend by sector, 2019 (£ million). Major sectors are ordered from top to bottom by largest 2019 0DA spend. DFID spend in dark blue and non-DFID spend in grey.
Sector Breakdown of Bilateral ODA Spend by top 10 recipients of UK bilateral ODA
Figure 14 provides an overview of the highest spending sector for each of the top 10 recipient countries of UK bilateral ODA in 2019. The size of the circles indicates the amount of ODA spent on that sector in that country relative to the other sectors and other countries.
Figure 14: Bilateral ODA by largest Major Sector for the top 10 country-specific ODA recipients, 2019
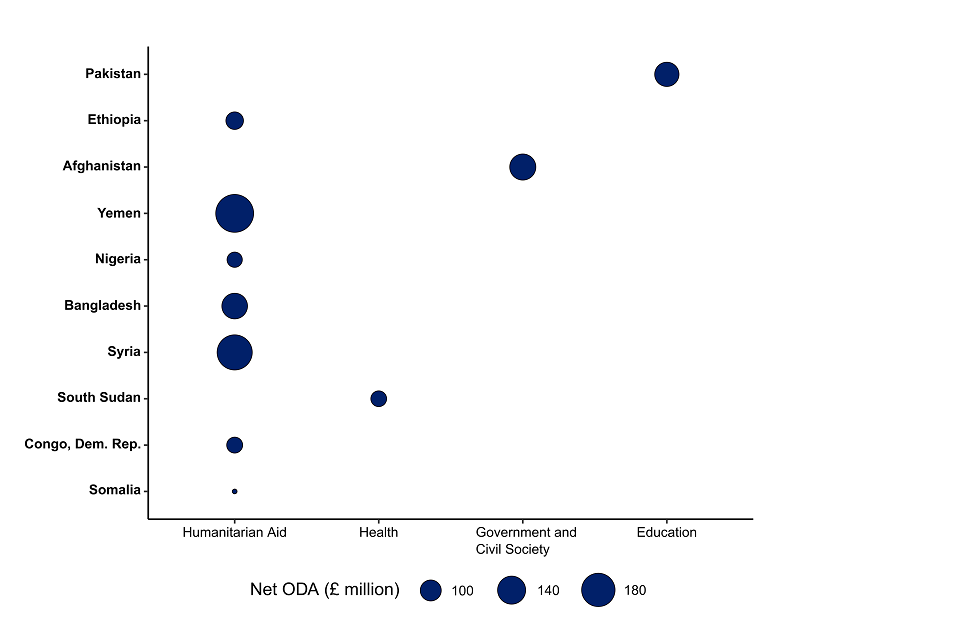
Figure 14: Bilateral ODA by largest Major Sector for the top 10 country-specific ODA recipients, 2019
Figure 14 legend: Top 10 recipients of UK country-specific bilateral ODA 2019 and largest sector spend (£ millions). The size of the circles corresponds to the total amount of ODA spent in each country sector.
- the sector ‘Humanitarian Aid’ received the largest amount of UK ODA in seven of the top 10 recipient countries in 2019, consistent with 2018
- in Pakistan, UK ODA spend on ‘Education’ has been consistently higher than any other sector over the past 5 years (over £100m per year)
- in Ethiopia, ‘Humanitarian Aid’ has consistently been the largest sector spend since 2017, in response to drought affected areas, giving access to food assistance and other immediate relief
- over the past 5 years in Afghanistan, the UK has consistently spent more in the ‘Government and Civil Society’ sector than any other. This is largely driven by contributions to a Reconstruction Trust fund
- Democratic Republic of Congo (Congo, Dem. Rep.) remains a top 10 recipient of UK bilateral ODA after entering in 2018 due to the increase in ‘Humanitarian Aid’ spend, which has been the highest sector spend in the country for the last 3 years
- South Sudan became a top 10 recipient of UK bilateral ODA in 2019 due to the increase in Health spend, which became the highest spend sector in the country in 2019, while Humanitarian Aid had been the highest sector for the previous 5 years
Figure 15: Bilateral ODA by Income Group for the Major Sectors, 2019
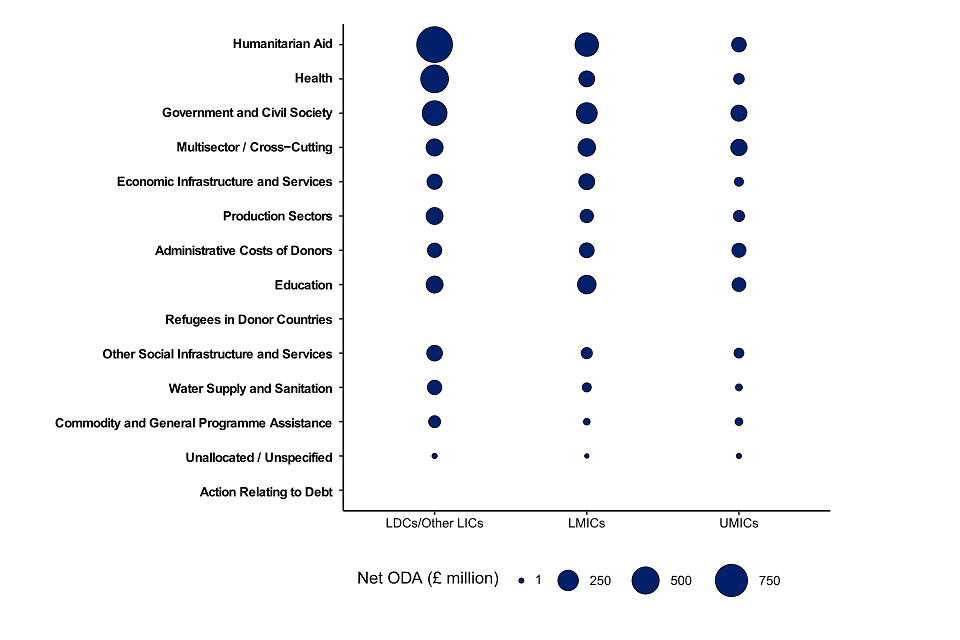
Figure 15: Bilateral ODA by Income Group for the Major Sectors, 2019
Figure 15 legend: Comparison of sector spend for 2019 UK bilateral ODA between countries of different income groups (£ million). The size of the dots corresponds to the total amount of ODA spent in each income groups sector.
Figure 15 summarises the differences in the main sectors of 2019 UK bilateral ODA spend between countries of different income groups. Least Developed Countries (LDCs/Other LICs) received more Humanitarian Aid (£949m, 33.6% of total bilateral ODA to LDCs/Other LICs) and Health support (£528m, 18.7% of total bilateral ODA to LDCs/Other LICs), whereas spend in these sectors was much lower for Upper-Middle Income Countries, where more ODA is spent on ‘Multisector/Cross-Cutting’ sectors (£140m, 20.1% of total bilateral ODA to UMICs) and ‘Government and Civil Society’ (£131m, 18.9% of total bilateral ODA to UMICs)
View full size version of infographic: Case Study 2 – Humanitarian
Multilateral Funding
UK Multilateral Funding by Organisation
Multilateral organisations[footnote 18] are an essential part of the international system for humanitarian and development ODA. The UK works with a wide range of organisations, for example to: respond to humanitarian need; develop infrastructure; support economic growth; or ensure that particular diseases are tackled in line with the best available evidence. Multilateral organisations offer economies of scale in their operations and expertise, and often have the mandate and legitimacy to work in politically sensitive situations. Accordingly, they enable individual donor governments, such as the UK, to support development and humanitarian work in a wider range of countries.
For example, the International Development Association (IDA), which is part of the World Bank Group, has been one of the largest recipients of UK multilateral ODA since 2013 and the UK remains its biggest donor. Through its donor contributions, IDA aims to reduce poverty by providing concessional loans and grants for programs that boost economic growth, reduce inequalities, and improve people’s living condition. Its activities include, among others, primary education, basic health services, clean water and sanitation, agriculture, business climate improvements, infrastructure, and institutional reforms.
Table 3 shows the 20 multilateral organisations that received the most core funding (Multilateral ODA) from the UK in 2018 and 2019.
- the amount of UK ODA to the top 5 multilaterals represented 68.7% of total multilateral ODA in 2019. IDA was replaced as the largest recipient of UK multilateral ODA by the UK’s share of the EU’s Development budget (referred to as EU attribution). The estimate for the UK’s EU attribution in 2019 was £983 million compared to £951 million in 2018
- EU attribution fluctuates from year to year because the EU works on a 7 year programming cycle and so EU disbursements in a given year can vary. Other reasons for fluctuations between years include the change in UK’s share of the EU budget in comparison to other member states and exchange rate variations
- in 2019, the UK’s core contribution to IDA was £891 million, a decrease of £1,040 million from 2018. It’s worth noting that, like other multilateral organisations, core contributions to IDA are based on multi-year commitments which may not be uniformly spread across years
- four of the top 5 receiving organisations of UK multilateral ODA in 2019 were among the top 5 multilaterals in 2018. The Central Emergency Response Fund is now in the top 5 recipients of UK multilateral ODA
Table 3: Top Twenty Recipients of UK Core Funding to Multilateral Organisations - Multilateral ODA 2018 and 2019 [footnote 19]
UK Multilateral Funding by Extending Agency
Table 4 shows multilateral UK ODA in 2015, 2018 and 2019 by government agency and delivery channel i.e. by bilateral through multilateral ODA (earmarked funding) and core contributions to multilateral organisations (un-earmarked funding).
Core contributions to multilateral organisations:
- DFID also provided the majority of the UK’s core multilateral ODA, accounting for 81.9% (£4,043m), a decrease on 2018 when DFID accounted for 85.5% (£4,544m)
- BEIS was the largest non-DFID department to provide core multilateral ODA in 2019, accounting for 3.4% (£167m), this includes their core contribution to the Clean Technology Fund (£166.5m)
- over the last 5 years, the share of UK core funding to multilateral organisations from non-DFID contributors has fallen from 21.6% (£967m) in 2015 to 18.1% (£896m) in 2019. This is partly due to there being no contribution to the IMF- Poverty Reduction Growth Trust Fund in 2019, compared to a contribution of £120 million in 2015
A full breakdown of UK ODA by Government Department and Other Contributors of UK ODA and delivery channel in 2015, 2018 and 2019 is available online in Table 10.
Table 4. Multilateral funding, by Government Departments and other contributors[footnote 20]
Multilateral Core Funding and Imputed Multilateral Shares
When DFID or other UK government departments provide core funding to multilateral organisations, the funding is pooled with other donors’ funding and disbursed as part of the core budget of the multilaterals. It is therefore not possible to directly track the use of UK core multilateral funding. However, to provide an indication of the destination and sector of UK multilateral ODA, overall percentages of ODA disbursements by the relevant multilateral organisations are used to impute a UK estimate.
The UK uses data on ODA spend by sector and country/region which is reported by each multilateral organisation to the OECD DAC to estimate what percentage of DFID and UK core contributions are spent in each country and sector. Where a multilateral organisation does not report to the DAC but the multilateral is only mandated to work in a particular country, region or sector, we allocate all of its core contributions to the relevant country, region or sector. If a multilateral organisation does not report to the DAC but works in multiple sectors and/or countries, then its core contributions are not allocated to a country or sector.
The DAC publish detailed information of the multilaterals’ country and sector spending in December. Because of this timing the latest estimates that are available are for 2018. These shares should be taken as indicative estimates rather than exact amounts of funding, and they are dependent upon multilateral organisations returning disbursement data to the DAC.
The estimates for 2018 can be found in our published Table A9 and A10.
Comparisons between the UK and other International Donors
The analysis in this chapter is based on provisional[footnote 21] 2019 ODA data from all 29 Development Assistance Committee (DAC) member countries[footnote 22] except the UK, for which final 2019 ODA data is used.
ODA Flows and ODA:GNI Ratios by DAC Donors
Total ODA from DAC country donors in 2019 was £119.7 billion (grant-equivalent measure), an increase from £115.1 billion in 2018. According to the OECD analysis of donors’ provisional 2019 ODA spend, the increase is attributable to bilateral aid to low income countries rising[footnote 23].
The introduction of the grant-equivalent[footnote 24] measure in 2018 primarily affects countries with a high proportion of loans in their 2019 ODA portfolio. The UK’s ODA spend is only slightly affected by this change as most of its ODA is issued through grants. For more detail on the grant-equivalent impact on other donors see Final SID 2018.
Figure 16 shows the UK remained the third largest DAC donor in 2019 at £15.2 billion, behind the United States (£27.1bn) and Germany (£18.7bn). The UK’s share of total DAC ODA was 12.7 per cent. This is unchanged from 2018.
Figure 16: Provisional ODA from DAC Donors, 2019
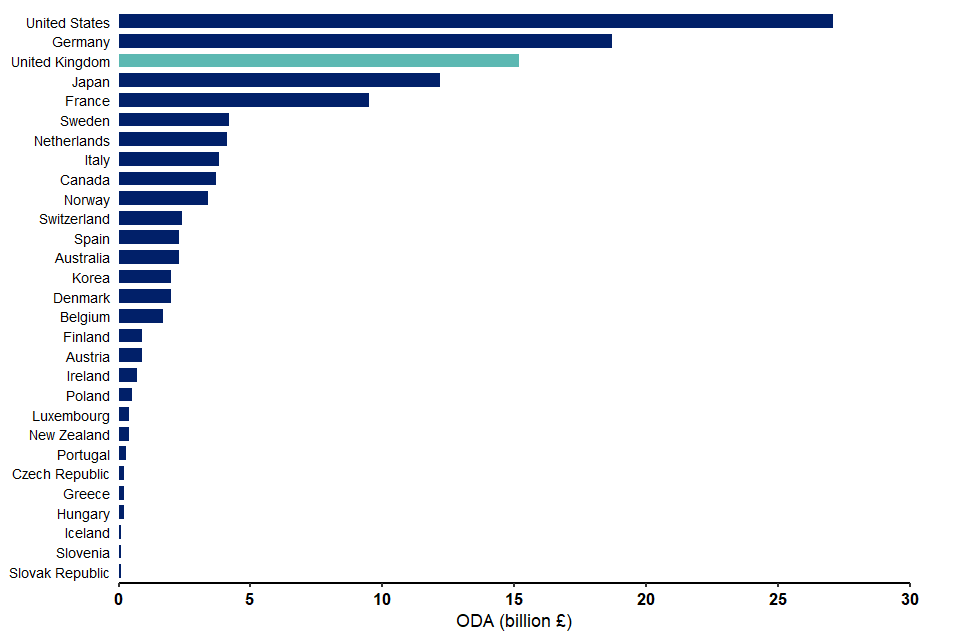
Figure 16: Provisional ODA from DAC Donors, 2019
Figure 16 legend: Comparing the UK ODA (billion £) spend with other DAC donor countries in 2019. The UK spend is highlighted in turquoise with the other donors in dark blue. Note that provisional 2019 spend from other DAC donors is used in this chart.
Figure 17 shows ODA spend as a proportion of gross national income (GNI) in 2019. It highlights that although the United States spent the greatest volume of ODA of any DAC donor (£27.1bn), this represented a smaller share of its national income when compared with most other donors (0.16% of its GNI). In comparison, Norway’s ODA spend (£3.4bn) was roughly an eighth of the United States’ but its ODA:GNI ratio was 1.02% showing that Norway spends a larger share of its national income on ODA.
In 2019, the UK was one of 5 DAC donors – along with Denmark, Luxembourg, Norway and Sweden – to either meet or exceed the UN’s target of an ODA:GNI ratio of 0.7%. The same countries also met or exceeded the target in 2018. In 2019, the UK remained the country with the fifth highest ODA:GNI ratio with 0.70%; Luxembourg had the highest with 1.05%. The countries within the top 10 remained unchanged from 2018[footnote 25].
Figure 17: DAC Donors’ Provisional ODA:GNI Ratio, 2018 and 2019[footnote 26]
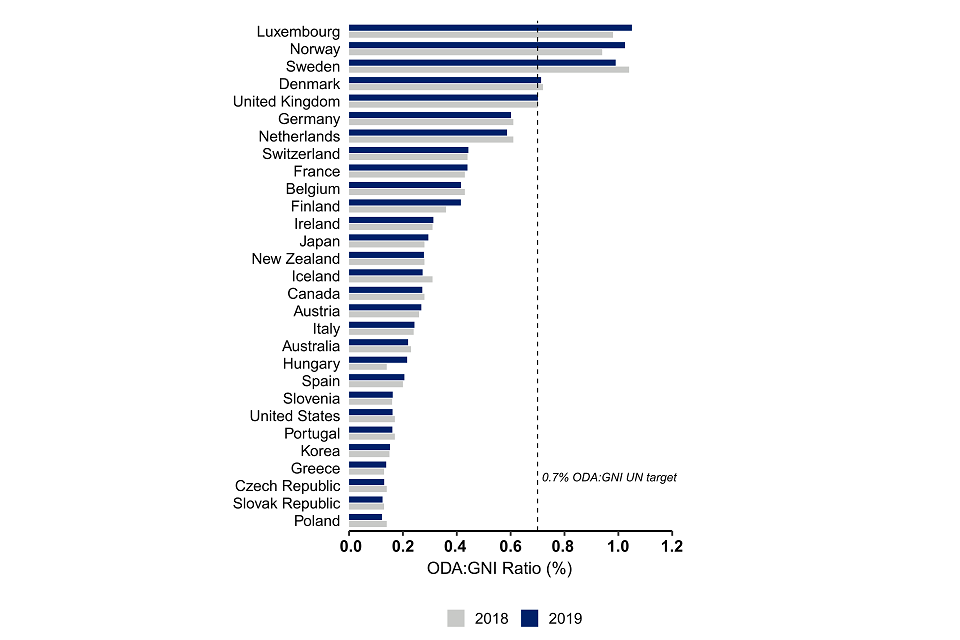
Figure 17: DAC Donors’ Provisional ODA:GNI Ratio, 2018 and 2019
Figure 17 legend: ODA spend in terms of GNI comparing 2018 and 2019 spend for each DAC donor country (ODA:GNI ratio). In dark blue is the 2019 ODA:GNI ratio and in grey is 2018 ratio. The vertical dashed line indicates the 0.7% ODA:GNI UN target. Note that provisional 2019 spend from other DAC donors is used in this chart.
ODA Flows by Recipient Countries
The data used for ODA flows by recipient countries is for 2018. For comparability, UK ODA data by recipient countries is also for 2018.
Figure 18 shows the top 15 recipient countries of total ODA from the DAC donor countries in 2018 and the UK’s share of ODA in these recipient countries. It shows:
- in 5 of the 15 top recipient countries, the UK contributed 15% or more of total DAC donor ODA: Ethiopia, Nigeria, Democratic Republic of Congo, Yemen and Pakistan. This is similar to 2017
- of the 5 countries receiving the greatest amount of total DAC donor ODA (Afghanistan, Syria, India, Bangladesh and Ethiopia), three (Ethiopia, Afghanistan and Syria) were among the top five recipients of UK ODA. The remaining top recipients of UK ODA were Pakistan and Nigeria
- Afghanistan remains the largest recipient of DAC country member’s ODA totalling £2.7 billion in 2018. The UK provided the largest share of total DAC donor ODA to Pakistan (34%)
- three of the top 15 DAC ODA recipients received 5 per cent or less of their total ODA from the UK[footnote 27] with Indonesia receiving 2.2% in 2018
Figure 18: Map of the top 15 highest recipients of total DAC Members bilateral ODA Spend and UK’s Share by Country, 2018
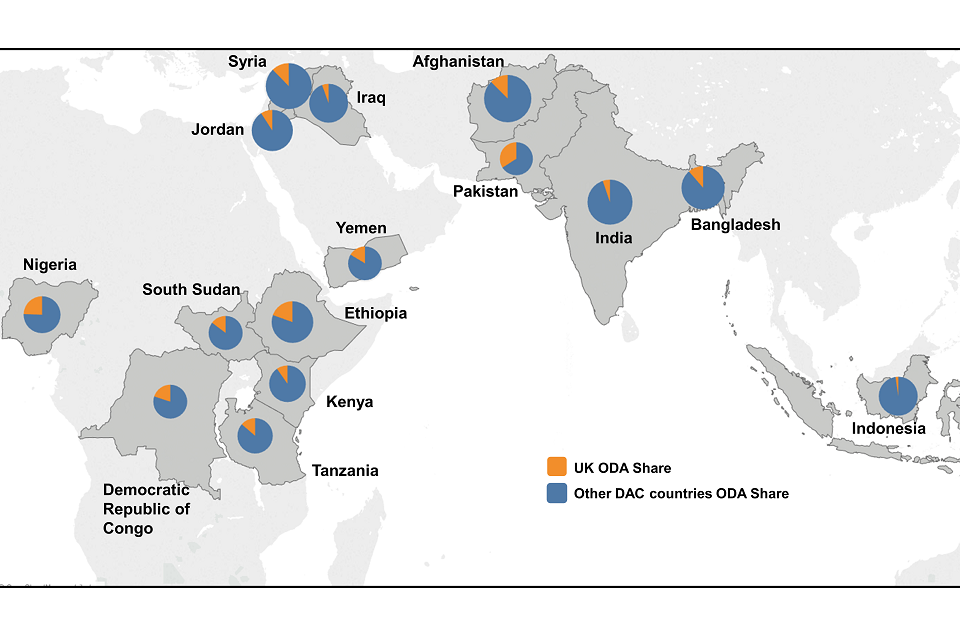
Figure 18: Map of the top fifteen highest recipients of total DAC Members ODA Spend and UK’s Share by Country, 2018
Figure 18 legend: Top 15 recipient countries of total ODA from the DAC donor countries in 2018 and the UK’s share of ODA in these recipient countries (orange) compared to other DAC countries ODA share (blue).
Background notes
Definitions and sources
Information on the main definitions and sources used in this publication can be found in Annexes 2 and 3 respectively of the Statistics on International Development publication
UK ODA spend figures for this publication are derived from:
-
DFID’s ‘ARIES’ database of financial transactions relating to DFID payments and receipts, which is quality assured centrally to ensure that data is complete, coding is correct and spend is in line with OECD definitions of ODA. This administrative source comprises 73.1% of total UK ODA in 2019
-
non-DFID sources, who also assess whether the spend is in line with the OECD definitions of ODA. These non-DFID sources account for around 29.6% in 2019 and are largely derived from financial transaction data. A small proportion of non-DFID spend is estimated, for example Gift Aid on ODA eligible activity
ODA spending and reporting
UK ODA spend includes DFID spend, ODA spend by government departments other than DFID and other sources of ODA (such as EU attribution and Gift Aid). In a calendar year, FCDO and HM Treasury will monitor spend by other departments and funds, and movements in GNI during the year[footnote 28]. The UK commitment to spend 0.7% of Gross National Income (GNI) on ODA is reported the year following the spend based on confirmed ODA outturn and GNI estimates published by the Office for National Statistics.
While FCDO will manage its own spending on ODA, FCDO has no control over GNI nor the spending by other government departments and other sources of ODA. After final decisions on UK ODA spending are made the GNI estimate can still shift due to later economic data for the year becoming available, so can the amount of ODA spent by other government departments and ODA contributions from non-departmental sources.
Between the spring and the autumn, the previous year’s ODA spending of government departments are finalised. Government departments other than FCDO will provide project-level details that allow the ODA spend to be quality assured by FCDO statisticians. The ONS will release further updates of GNI throughout the year. The final ODA data and an updated GNI estimate are then used to calculate the final ODA:GNI ratio in the autumn publication.
FCDO is responsible for collating data and reporting spend on ODA to the Organisation of Economic Development and Co-operation (OECD), including the 0.7% ODA:GNI ratio commitment.
Difference between Provisional and Final publications
The Statistics on International Development: Provisional Aid Spend 2019 publication outlines provisional ODA spend information and an estimate of GNI for 2019 published by ONS in March to calculate a provisional estimate of the ODA:GNI ratio. Between the spring and the autumn, the ODA spending of government departments and other ODA contributors are finalised.
As part of this, other government departments will provide project-level data which will have codes that allocate for each project: sectors, delivery partner, type of aid and other key variables. A project title and description are also provided. These extra details allow the ODA spend to be quality assured using guidance from OECD.
The final ODA data and an updated GNI estimate for 2019 released by the ONS in June have been used to calculate the final ODA:GNI ratio in this publication and to report to the OECD. Further information on the data sources, quality and processing of the statistics in this publication are found in Annexes 1-3 on the Statistics on International Development webpage.
ODA:GNI ratio
As mentioned above, the ODA:GNI ratio is based on confirmed ODA spend and estimates of GNI published by the Office for National Statistics (ONS). The ONS produce estimates for UK Gross Domestic Product (GDP) and Gross National Income (GNI) on a quarterly basis. The ONS publishes revisions to GNI estimates as more economic data becomes available. The 2019 final ODA:GNI ratio is based on a GNI estimate published by the ONS on 30 June 2020.
In the Blue Book 2019, the ONS implemented a major new methodology framework for GDP, which in turn had a sizable impact on GNI. For the 2019 ODA:GNI ratio, the GNI estimate is based on the pre-Blue Book 2019 framework since the first quarterly estimate of 2019 GNI under the new framework did not become available until 30 September 2019. This approach is in line with how DFID dealt with the last major GNI methodology change[footnote 29] and provides consistency between the in-year monitoring and reporting of the ODA:GNI ratio. DFID considered several factors and consulted with key stakeholders, ONS and HM Treasury when determining its approach for implementing the new framework for reporting on the ODA:GNI ratio.
To give users an understanding of the impact of the changes implemented in Blue Book 2019, the UK GNI measured on the new GDP framework leads to an ODA:GNI ratio of 0.70% in 2019, compared to 0.70% on the pre-Blue Book 2019 level.
FCDO will move to the new framework at the start of 2020, the next full calendar year, for managing and reporting 2020 ODA spend. For more information please see the explanatory note that was published in September 2019.
EU attribution
The estimate for the UK’s share of the EU ODA budget in 2019 is £983 million compared to £951 million in 2018. EU attribution fluctuates from year to year in part because the EU works on a 7 year programming cycle and so EU disbursements in a given year can vary. The estimate in 2018 and 2019 is based on published data from the European Commission on the UK’s share of development expenditure.
In Table 3, £27.5 million for the UK’s assessed contribution to ODA eligible EU civilian peacekeeping missions is reported in these statistics by the Conflict, Stability and Security Fund, as the fund responsible for spending. This avoids double counting in Table 3 and the total UK EU attribution is not affected.
Grant equivalent
From 2018 onwards, Official Development Assistance (ODA) has changed from being measured on a cash basis to a grant equivalent basis, following a decision taken by the DAC in 2014.
The headline grant equivalent measure of UK ODA for 2019 was £15,197 million, compared to £15,179 million on the cash basis measurement (a difference of 0.1%). The difference is due to official loan reflows not being included under the grant equivalent measure. See our technical note for more information.
Future developments
On 2 September 2020, DFID and FCO merged to form the new Department – Foreign, Commonwealth and Development Office (FCDO). Following the merger, the ODA statistics team will review the SID in light of this, including how to present and communicate ODA trends for reporting on 2020 ODA and beyond. We will be reaching out to users via the Statistics at FCDO page to help us plan future developments and meet users’ analytical needs as far as possible.
The UK is participating in the OECD DAC Peer Review process in 2019/20. This is an in-depth investigation of the UK’s development systems and policies. The date for the publication is still to be confirmed, owing to the impact of COVID-19 on the review’s completion. To understand further what a DAC Peer Review involves please see the OECD guidance.
On 28 August, the ODA statistics team published a note on the Gross Public Expenditure statistics (GPEX). The note sets out plans to discontinue the publication of the GPEX suite of tables due to (i) low public usage and (ii) being able to meet the main known needs by adding 3 pilot summary tables to Statistics on International Development (SID). For more information please see the published note which outlines a new approach in more detail and provides an opportunity for users to give feedback
Uses and users
The main purpose of this publication is to provide timely statistics of ODA expenditure by UK Official sources. They are published prior to the release of final ODA statistics by the OECD DAC for all OECD members.
During a consultation conducted in 2014, users told us that they use the statistics for a variety of purposes: preparing material for briefs; PQs and public correspondence; inclusion in reports and reviews and providing data for research and monitoring. The users represent the government, civil society and non-government organisations, students and academia and the media.
We are always keen to enhance the value of these statistics and welcome your feedback either via our Statistics User Group or via email statistics@fcdo.gov.uk
Data quality
Data for this publication comes from the following sources: i) DFID’s ARIES database that records financial transactions relating to DFID payments and receipts. It also includes information on the dates of transactions, where the transactions took place and in which sector. This information is primarily inputted by spending teams in DFID country offices and central departments, with some quality assurance carried out at input and centrally to ensure that spend is in line with OECD definitions of ODA ii) Other Government Departments and contributors some of which have similar databases to record ODA transaction data.
As the data in the publication is largely based on administrative data it is not subject to sampling error.
The DAC sets the definitions and classifications for reporting on ODA internationally. These are laid out in the DAC Statistical Reporting Directives[footnote 30].
Calendar year financial transaction data are used to compile UK ODA spend statistics. These are extracted from DFID’s ARIES database, and the detailed data is subject to input errors from spending teams. The risk of input error is relatively low for estimates of total spend, and by country/region, and relatively higher for spending by sector (where there is sometimes ambiguity, especially for projects or programmes that cut across sectors) and by funding channel. The quality assurance Annex 3 describes the steps that have been taken by FCDO statisticians to minimise these kinds of input errors, and to produce UK ODA statistics.
The figure presented for the Welsh Assembly Government represents their estimated spend for the financial year 2019/20 and are used as a proxy for their calendar year 2019 spend.
Data revisions
DFID data for this publication is based on an extract of the ARIES database taken in June 2019, after the end of the calendar year 2019 and financial year 2019/20. Other Government Department data (including FCO data) are collected during May and June, and are quality assured over the summer. Where we do have to revise information included in this publication, we will follow the procedures set out in our revisions policy.
Publication cycle
FCDO releases 2 editions of Statistics on International Development over the year:
-
provisional UK Aid spend will be published in the spring and includes a preliminary estimate of the UK’s ODA:GNI ratio for the previous calendar year. The latest edition of this publication can be found on GOV.UK
-
final UK Aid spend is usually published in the autumn. This publication confirms the UK’s ODA:GNI ratio for the previous year, as well as including more detailed analysis of the UK’s Bilateral and Multilateral ODA, and includes the microdata used to produce the publication
Related statistics and publications
The OECD statistics provide ODA breakdowns for DAC donors (including multilaterals). This source is useful when carrying out international comparisons. Figures for DAC donor’s final 2019 ODA will be published in December.
Private spending or donations made in support of developing countries, for example by the public, the voluntary sector or through remittances, are not part of the ODA definition and not covered in this publication. Information on this spend can be found in the Office for National Statistics’ Living costs and Food Survey or the Charities Aid Foundation’s UK giving report.
DFID’s results estimates show what DFID has achieved in international development between 2015 and 2020. DFID’s Annual Report provides information on DFID’s spending, performance and efficiency for 2019/20.
The Development Tracker can be used to explore details of the individual development projects that the UK is funding. This allows you to filter projects by country and sector and view further details about the project as published in documents such as the business case and annual review. The tracker uses open data on development projects, compliant with the International Aid Transparency Initiative (IATI) standard, to show where funding by the UK Government and its partners is going and ‘trace’ it through the delivery chain.
National statistics
The Office for Statistics Regulation (part of the United Kingdom Statistics Authority) designated these statistics as National Statistics in March 2016, in accordance with the Statistics and Registration Service Act 2007 and signifying compliance with the Code of Practice for Statistics. Designation means the statistics carry the National Statistics label and conform to the standards summarised below.
Office for Statistics Regulation published their finding from the compliance check of SID which confirmed that it is designated a National Statistics.
The Foreign, Commonwealth & Development Office is now responsible for producing the Statistics on International Development statistical series, the designation of National Statistics carries through to the new Department.
For information on the work of the UK Statistics Authority visit: https://www.statisticsauthority.gov.uk/.
Text box indicating the relevant figures have achieved the standards set by National Statistics and the National Statistics logo.
Contact details
For enquiries (non-media) about the information contained in this publication, or for more detailed information, please contact:
Alice Marshall
Telephone: 01355 84 36 51
E-mail:statistics@fcdo.gov.uk
For media enquiries please contact the FCDO Press Office on +44 (0)20 7008 3100. For further information on development issues and FCDO policies, please contact the Public Enquiry Point on 020 7008 5000.
Listing of main activities of UK Government Departments and other contributors of UK ODA other than DFID in 2019
| Non-DFID Government Department or other contributor of UK ODA | Main ODA funded activity in 2019 |
|---|---|
| Department for Business, Energy and Industrial Strategy (BEIS) | BEIS’s ODA includes spend on International Climate Finance, jointly managed with FCDO and DEFRA. This spending is helping developing countries reduce their emissions in line with the ambition set out in the Paris Agreement. It supports them to deal with the impacts of climate change by building their capacity to act themselves and by catalysing large scale public and private finance investments. BEIS funding supports large scale mitigation projects in the following thematic areas: unlocking clean and affordable energy for all and accelerating decarbonisation, building sustainable cities and transports systems, halting deforestation and preventing irreversible biodiversity loss, helping countries and communities to become more resilient to the damaging effects of climate change. BEIS also manages the Newton Fund and Global Challenges Research Fund (GCRF). The Newton Fund supports bilateral and regional research and innovation partnerships between the UK and selected middle income countries. The aim of this is to address specific global development challenges and build science and innovation capacity. GCRF provides dedicated funding to research focused on addressing global challenges which most significantly impact upon developing countries. It achieves this by supporting challenge-led disciplinary and interdisciplinary research, strengthening capability for research and innovation within developing countries, and providing an agile response to emergencies. |
| Foreign and Commonwealth Office (FCO) | In 2019 the Foreign & Commonwealth Office (FCO) used ODA from its core departmental budget and the Joint Funds (Conflict, Stability and Security Fund, and Prosperity Fund) to support and deliver the strategic objectives of the government’s 2015 Aid Strategy and support delivery of the UN’s Sustainable Development Goals (SDGs). The FCO ODA programmes concentrated on the strategic objectives of promoting global prosperity, and strengthening global peace, security and governance. This section covers ODA spend from the FCO’s core budget. The Joint Funds are covered separately as a whole, regardless of which Government Department spends the money. The FCO spent ODA in approximately 130 countries in 2019, in 5 ways: 1. Frontline Diplomatic Activity. In line with DAC criteria, the FCO, as a multi-purpose agency reports the costs related to diplomatic staff assigned wholly or partly to aid-related duties as ODA expenditure. The FCO also supports and enables the work of other Government Departments on our overseas platform. 2. Chevening scholarships and the International Leadership Programme. HMG is committed to building capacity through education, contributing to multiple SDGs. Chevening operates in about 160 countries and territories, and there are over 50,000 alumni around the world. 3. A portion of the subscription costs to certain international organisations, including the OSCE, Council of Europe, UN and Commonwealth. The eligible coefficient is determined by the DAC; 4. Grants to the BBC World Service, British Council, GB-China Centre, Wilton Park and Westminster Foundation for Democracy for their ODA eligible activities. 5. The International Programme formerly known as the Global Britain Fund supports the FCO’s wider diplomatic efforts and foreign policy in support of UK interests overseas. All our ODA-eligible policy programmes are aligned with FCO Priority Outcomes, National Security Strategy objectives and the Aid Strategy. Information on ODA project/programme expenditure and ODA project/programme objectives for FCO departmental policy programmes can be found on the FCO website at: https://www.gov.uk/government/collections/official-development-assistance-oda–2. Information is also available in the FCO’s Annual Report, Annual Human Rights report and (for work delivered on behalf of the Cross-Whitehall CSSF and Prosperity Funds) in the CSSF and Prosperity Fund Annual Reports. |
| Conflict, Stability and Security Fund (CSSF) | The CSSF is able to respond both to evolving security threats and unforeseen crises. Whilst the majority of funding is delivered via multi-year programmes or spending commitments, each year the CSSF reviews it’s spending via the allocations process. This allows regional teams to adjust funding to ensure they have a strategic fit with HMG objectives and are delivering effectively. In addition, the CSSF’s Rapid Response Mechanism allows funding to be released immediately, across government departments to respond to a crisis. CSSF’s main activities in 2019 were: tackling conflict and building stability overseas; improving capacity and accountability of security and justice actors; strengthening the rules-based international order and its institution, including women, peace and security; economic development; tackling serious and organised crime; preventing violent extremism. The CSSF supports and delivers programmes in over 70 countries including Afghanistan, Iraq, Syria, Pakistan and Lebanon. |
| EU Attribution (non-DFID) | This is the estimate for the non-DFID share of the EU ODA budget. EU attribution fluctuates from year to year because the EU works on a 7 year programming cycle and so EU disbursements in a given year can vary. Non-DFID EU contributions include ODA eligible spend in peace, security, democracy, human rights and civil society. |
| Home Office (HO) | In-donor spend on support to asylum seekers and the resettlement of vulnerable people. This primarily is linked to food and shelter for up to 12 months. Work upstream in ODA countries to build capacity and capability in recipient countries in order to improve security, protect children and tackle modern slavery. |
| Department of Health and Social Care (DHSC) | The National Institute for Health Research (NIHR) Global Health Research (GHR) portfolio was established to support high-quality applied health research for the direct and primary benefit of people in low and middle-income countries (LMICs). The portfolio aims are delivered through a mix of researcher-led and commissioned calls delivered by NIHR and through partnerships with other global health research funders, through initiatives to develop and advance global health research. The Global Health Security (GHS) Programme contributes to the UK Aid Strategy, specifically, ‘strengthening resilience and response to crises’, to ensure a world safe and secure from infectious disease threats and promotion of Global Health as an international security priority. The Framework Convention on Tobacco Control 2030: This support is helping to reduce the burden of death and disease from tobacco and enable countries to make better use of health system resources to improve health and well-being of their populations. The DHSC pays an annual subscription to the World Health Organisation (WHO) and takes the overall lead for the Government’s engagement with the organisation. The DHSC has funded the first twelve months of asylum seeker healthcare costs following their arrival in the UK. These are the estimated healthcare costs of asylum seekers classified as ‘Section 95’, ‘Section 98’ and Unaccompanied Asylum-Seeking Children by the Home Office. ODA admin – funding for all DHSC staff supporting ODA funded activities and their associated costs. It also funds overheads for IT, accommodation, and commercial and advisory legal support costs. |
| Cross-Government Prosperity Fund | The Prosperity Fund is an innovative cross-government fund, focused on Official Development Assistance (ODA) eligible middle income countries and emerging economies. It supports the UK’s aim of promoting global prosperity, creating the broad-based and inclusive growth needed for poverty reduction, contributing to the UN Sustainable Development Goals. It targets reforms that will remove barriers to economic growth, promote sustainable development, and create opportunities for business, including UK companies. Around 60% of the world’s poor live in middle-income countries; countries which, despite growth, still face considerable challenges such as rapid urbanisation, climate change and high and persistent inequality. To continue to grow, many countries need support to access world-class expertise and private sector investment which unlock constraints to growth. Through the Prosperity Fund, the UK is creating new partnerships with these countries, supporting inclusive growth, whilst sharing expertise and building mutually beneficial and prosperous relationships. Major projects supported in 2019, and amounts spent on projects; 1. The Currency Exchange Fund (TCX) which is designed to mitigate currency and interest rate risks in order to attract and lock in long-term private equity and private debt in local currencies to help developing countries finance their own development, spent £28.5m; 2. The Global Trade programme is helping to remove non-tariff barriers to trade in developing countries, improving their access to regional and international trade, promoting innovation and growth, and leading to increased employment and lower prices for consumers, spent £18.5m. |
| Gift Aid | The portion of Gift Aid claimed by UK based international development charities that is then used on ODA eligible activities. To understand more about ODA eligible Gift Aid, please see methodology note. |
| Department for Environment, Food and Rural Areas (DEFRA) | DEFRA’s ODA spend delivers against international climate, biodiversity and development objectives. Its International Climate Finance seeks to deliver climate mitigation and adaptation benefits focused on protecting the world’s most biodiverse forests, promoting sustainable livelihoods through improved land use and agricultural practices, and contributing to global food security. DEFRA’s ODA spend also supports the conservation and sustainable management of natural resources and biodiversity, both terrestrial and marine, through initiatives including the Darwin Initiative and the Illegal Wildlife Trade Challenge Fund. DEFRA’s ODA programming supports the delivery of all four UK Aid Strategy objectives by strengthening global peace, security and governance, strengthening resilience and response to crises, promoting Global Prosperity and tackling extreme poverty and helping the world’s most vulnerable. |
| HM Treasury (HMT) | HMT ODA relates to a core contribution to the Asian Infrastructure Investment Bank (AIIB) and development-related administrative costs. |
| BBC World Service | BBC World Service contributes to the BBC’s international news mission to address the global gap in provision of trusted news by broadcasting and distributing accurate, impartial and independent news and analysis in developing countries. The BBC World Service aims through journalism to contribute to accountability and good governance and improve the welfare and economic development of citizens in developing countries. |
| Department for Work and Pensions (DWP) | DWP pays an annual core contribution to the International Labour Organisation (ILO). DWP spend also includes ODA-eligible benefits to refugees within the first 12 months of stay in the UK as part of the Vulnerable Persons Resettlement (VPR) programme. |
| Department for Education (DfE) | DfE’s ODA covers support of asylum seekers in the first 12 months after they make a claim for asylum in the UK. This support relates to the provision of publicly-funded education services for asylum seekers of compulsory school age. |
| Scottish Government | The Scottish Government, though its £10M pa International Development Fund, supports development work in its partner countries Malawi, Zambia, Rwanda and Pakistan, in pursuit of the Global Goals. A separate £1m Humanitarian Emergency Fund also provides humanitarian funding to support crises as they occur, including during 2019 support for Mozambique, Malawi and Zimbabwe following Cyclone Idai, and for the Ebola crisis in the Demographic Republic of Congo. Finally, the Scottish Government’s Climate Justice Fund helps tackle the effects of climate change in the poorest, most vulnerable countries, with a £3m budget. |
| HM Revenue and Customs (HMRC) | HMRC supports developing countries revenue authorities to improve their tax administration functions and tax policies to increase revenue collection, providing economic integration, stability and growth. Provision of technical assistance in tax policy and administration issues to support the strengthening of tax systems in developing countries. Delivery of leadership and tax audit training to tax administration officials from developing countries. |
| Department for Digital, Culture, Media and Sport (DCMS) | DCMS’s Cultural Protection Fund supports developing countries, mainly in Middle Eastern conflict zones, to protect and restore their cultural heritage. |
| Other In-donor Refugee Costs | Education (for compulsory school age) and healthcare for asylum seekers based in Scotland, Wales and Northern Ireland. Only asylum seekers within the first 12 months after they make a claim for asylum in the UK are included. |
| Ministry of Defence (MoD) | MoD ODA spend includes training in human rights, rule of law, international humanitarian law, protection of civilians in conflict, maritime law, and the UK Hydrographic Office support to developing countries in maritime charting. |
| Department for International Trade | DIT’s ODA is administrative costs to support ODA capability and compliance. |
| Welsh Assembly | The Welsh Assembly supports the Wales for Africa programme, which aims to help deliver the Sustainable Development Goals. It also provides small grants to organisations based in Wales to promote development awareness. |
| Colonial Pensions administered by DFID | Pension payments made to ex-members of the UK Overseas Civil Service who were employed directly by developing country governments. |
| Office for National Statistics | Office for National Statistics technical assistance to build capacity of statistical systems in developing countries. |
-
A glossary, explaining key terms used throughout this report, is available in Annex 1 ↩
-
See commitments made by the UK and other donors at the 2005 G8 Summit in Gleneagles ↩
-
For more information on the grant equivalent measure and the impact on UK ODA, see background note 6.2 ↩
-
The multilateral must be on the OECD DAC list of eligible multilaterals in order to receive unearmarked funding. The list also states the proportion of a core contribution to each multilateral that can be counted as ODA, and is driven by proportion of ODA eligible work the multilateral carries out ↩
-
The UK contribution could be used for different programmes or initiatives as well as general operations of the organisation. See section 4.3.3 for information on how we estimate which countries and sectors the UK core contributions benefit ↩
-
In 2019, frontline diplomatic activity (the FCO’s administrative costs not included elsewhere, which are reported under FCO spend as ‘Aid-related frontline diplomacy in support of aid flows to …’) were reported at the country level compared to recent years when they were reported at the regional level. This could have an impact on the recent trends of some recipient countries. ↩
-
As defined on the OECD DAC list of ODA-eligible international organisations ↩
-
For some multi-country/region programmes, the current administrative system does not allow recording of spend by individual recipients. Improvements to the system are being considered but for this publication, where this is the case spend is reported as bilateral ODA spend with no single benefitting country or region (section 4.1.5). ↩
-
The Global Partnership for Education is an example of a sectoral-specific fund where amounts allocated to countries is not known in advance. ↩
-
European countries that received ODA in 2019 were: Albania, Belarus, Bosnia-Herzegovina, Kosovo, Moldova, Montenegro, North Macedonia, Serbia, Turkey and Ukraine. ↩
-
Frontline Diplomatic Activity (FDA) costs are administrative costs of core programme and operational delivery in or in favour of DAC-listed recipient countries that meet the primary ODA purpose. In 2019, frontline diplomatic activity (the FCO’s administrative costs not included elsewhere, which are reported under FCO spend as ‘Aid-related frontline diplomacy in support of aid flows to …’) were reported at the country level compared to recent years when they were reported at the regional level. This could have an impact on the recent trends of some recipient countries. ↩
-
For breakdowns of spend to the top 20 recipients, see Table 6 on the publication landing page. ↩
-
Please see Table C6 in Excel Tables: Statistics on International Development 2019 for underlying data ↩
-
From 2017, a single project could allocate spend to one or more sectors codes. See our note on Multiple Sector Codes for Project Activity – Analysis 2017 which looks at the impact of this methodology change ↩
-
Economic Services & Infrastructure include programmes that focus on Transport, Energy Generation, Banking & Financial Services and Business. See Annex 1 for more detail. ↩
-
Defined as ODA-eligible multilateral organisations for core (unearmarked) contributions by the OECD DAC, see http://www.oecd.org/dac/stats/annex2.htm ↩
-
The UK may also provide funding to these organisations for specific programmes, which would be recorded as bilateral spend through a multilateral organisation. ↩
-
“z” is not applicable, “0” is null and “~” is less than half the smallest unit displayed. For a full breakdown of UK-ODA by government department and other contributors to UK ODA by delivery channel for 2015, 2018 and 2019 please see Table 10. ↩
-
Finalised figures for DAC members will be published in December 2020, therefore we are using provisional figures in this chapter. To illustrate the impact of using provisional figures, DAC members’ provisional ODA for 2018 was £114.7 billion. This increased to £115.1 billion for final ODA for 2018 – an increase of 0.3 per cent. ↩
-
The EU is also a DAC member but has not been included in this chapter. ↩
-
For further analysis on DAC country donors, see the OECD report on donor’s provisional figures. ↩
-
From 2018 onwards, Official Development Assistance (ODA) has changed from being measured on a cash basis to a grant equivalent basis, following a decision taken by the DAC in 2014. For more information please see the Grant Equivalent Technical note. ↩
-
Statistics on International Development, Final UK Aid Spend, 2019, p. 18, Figure 5 ↩
-
Figure 18 is based on the provisional 2019 ODA data from all 29 DAC member countries, except the UK for which final 2019 ODA data is used. ↩
-
Iraq = 5 per cent; India = 5 per cent; Indonesia = 2 per cent. ↩
-
GNI is monitored using forecasts published by the independent Office for Budget Responsibility (OBR) to manage the 0.7% commitment ↩