Spring 2025 Immigration Rules Impact Assessment (Skilled Worker and Care Worker) July 2025 (accessible version)
Updated 9 December 2025

© Crown copyright 2025
This publication is licensed under the terms of the Open Government Licence v3.0 except where otherwise stated. To view this licence, visit nationalarchives.gov.uk/doc/open-government-licence/version/3 or write to the Information Policy Team, The National Archives, Kew, London TW9 4DU, or email: psi@nationalarchives.gov.uk.
Where we have identified any third party copyright information you will need to obtain permission from the copyright holders concerned.
This publication is available at https://www.gov.uk/government/publications/statement-of-changes-to-the-immigration-rules-hc-997-1-july-2025/spring-2025-immigration-rules-impact-assessment-skilled-worker-and-care-worker-july-2025-accessible-version
| Title: | Spring 2025 Immigration Rules Impact Assessment (Skilled Worker and Care Worker) – July 2025 |
|---|---|
| Type of measure: | Immigration Rules change |
| Department or agency: | Home Office and Department for Health and Social Care (DHSC) |
| IA number: | HO IA 1017 |
| Type of Impact Assessment: | Final |
| RPC reference number: | N/A |
| Contact for enquiries: | Migration and Citizenship Policy, Home Office |
| Date: | 01/07/2025 |
1. Summary of proposal
1. Changes are being made to implement some of the reforms to work visas set out in the white paper, “Restoring control over the immigration system”, published on 12 May 2025[footnote 1]
2. These changes will:
- Increase the skills threshold for occupations eligible for Skilled Worker and Health and Care visas from Regulated Qualifications Framework (RQF) level 3 (approximately A-level) to RQF level 6 (graduate level);
- Raise salary threshold and occupational going rate requirements for Skilled Worker, Global Business Mobility and Scale-up visas in line with 2024 ASHE data;
- Close Skilled Worker entry clearance applications for care workers (SOC code 6135) and senior care workers (SOC code 6136), while maintaining in-country switching applications until 22 July 2028;
- Expand the Immigration Salary List (ISL) and introduce a new, interim Temporary Shortage List (TSL), providing time-limited access to the Skilled Worker route for occupations below RQF 6, but with no ability for applicants to bring dependants; and
- Include transitional arrangements, allowing existing Skilled Worker visa holders to continue to extend their visas, bring dependants, change employment and take supplementary employment in occupations below RQF 6, while applying the new rules to applicants from overseas and those applying to switch from other routes. These transitional arrangements will not be in place indefinitely and will be reviewed in due course.
2. Strategic case for proposed regulation
3. Levels of net migration were approximately 200,000 per year throughout most of the 2010s and have risen from 224,000 in the year to June 2019 to a record high of 906,000 in the year ending June 2023 - a four-fold increase in the space of under four years.
4. At the same time as a significant expansion in overall levels of migration, driven particularly by non-EU nationals and their dependants coming to the UK for work and study, the mix of visa holders also changed – shifting increasingly away from higher-skilled migration, and towards lower-skilled migration.
5. The RQF is a system used to categorise qualifications based on their level of difficulty and complexity. Occupations which require an RQF 6 or above skill level are deemed highly skilled (jobs that people generally need at least an undergraduate degree to perform) such as architects, and physiotherapists. Occupations that require lower RQF levels of qualification are generally quicker and easier e to undertake.
6. The Skilled Worker visa introduced in 2020 lowered the skill threshold on the route from RQF 6 down to RQF 3. In August 2020, the Health and Care Worker route was introduced and expanded in February 2022 to include the social care workforce within which roles are generally below RQF 3.
7. In 2022 on the Skilled Worker route, only 16,200 visas were issued to people taking up lower skilled jobs. By 2023, this had increased to 27,900 following increases in people coming to work in food preparation and hospitality occupations. In 2023 a further 105,000 visas were issued to those in social care occupations representing 73 per cent of Health and Care Worker visas issued to main applicants. Figure 1 illustrates the share of skilled worker visas issued in RQF 3 and below, RQF 4 and 5 and RQF 6 and above occupations.
Figure 1: Share of skilled worker visas issued in RQF 3 and below, RQF 4 to 5 and RQF 6 and above occupations
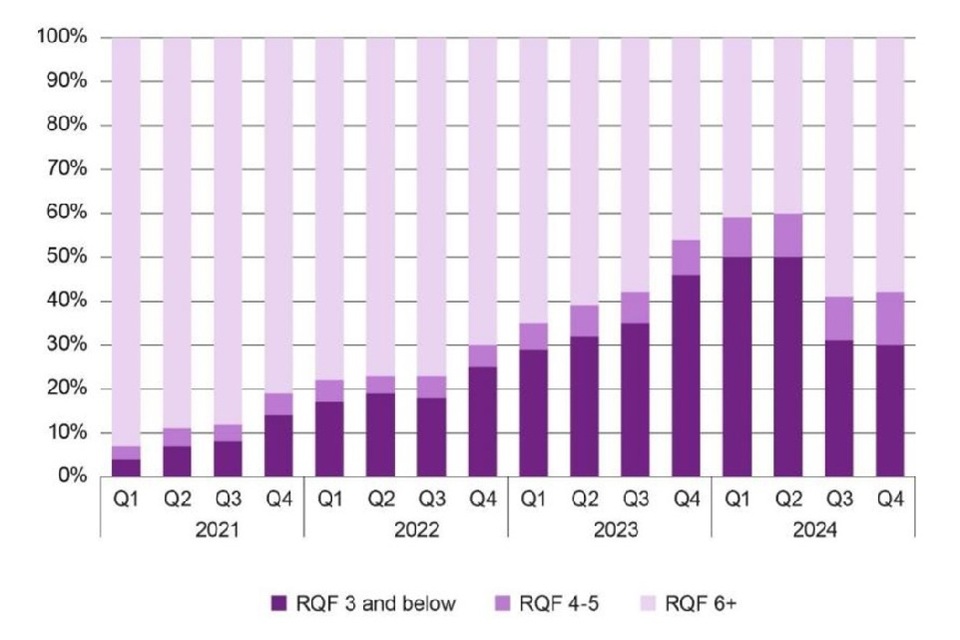
Source: Internal Home Office Analysis
8. Increases to salary thresholds in April 2024 have resulted in a decline in visas across all skill levels - but the average skill level is still lower than any year prior to 2023. Figure 2 illustrates the volume of entry clearance visas issued to skilled workers below and above RQF 6, using data after the changes to salary thresholds in April 2024. The stronger application of the genuine vacancy test for the social care sector from October 2023, based on extensive Home Office engagement with the Department for Health and Social Care, has also led to a decline in social care applications to around 7,800 in 2024, but care workers remain the only occupation eligible to come to the UK to work below RQF 3.
Figure 2: Skilled Workers, April to December 2024 by RQF level group, top 10 UK industries.

Source: Internal Home Office Analysis
9. Highly skilled migrants can have a significant positive impact on the labour market where they are able to fill skill-shortages, and where they bring a new set of skills to complement UK workers, increasing overall productivity.
10. However, at the same time as overseas recruitment, including of lower skilled workers, rose, labour market participation by UK residents has fallen. The overall employment rate for 16 to 64 year-olds from January to March 2025 of 75.0 per cent is lower than before the COVID-19 pandemic at 75.9 per cent in January to March 2020[footnote 2], reversing the previous long-run trend of declining rates of economic inactivity.
11. In turn the percentage of young people aged 16 to 24 who are not in employment, education or training in January to March 2025 was estimated at 12.5 per cent, up from 10.7 per cent in the same period in 2021 and 11.0 per cent in 2019[footnote 3]. It is this cohort specifically who are more likely to have been employed in lower-skilled jobs. According to the 2021 Census, 96 per cent of 16 to 24 year-olds in employment were working in occupations below RQF 6 level, compared to 73 per cent for the population as a whole.[footnote 4]
12. While there will be many reasons for this trend, including pay and conditions and wider economic conditions, access to the immigration system reduces the incentives to invest in domestic skills and training. Total apprenticeship starts have fallen from 393,000 in 2018/19 to 340,000 in 2023/24.[footnote 5] Total investment in training has fallen in real terms from around £2,200 per employee in 2011 to around £1,800 per employee in 2022.[footnote 6]
13. Against this context, the strategic objectives set out in the white paper for these changes are to:
- Ensure net migration comes down so the system is properly managed and controlled.
- Link the immigration system to skills and training requirements here in the UK so that no industry is allowed to rely solely on immigration to fill its skills shortages.
14. While these changes have a significant impact on the number of people able to come to, and remain in the UK, this should be seen in the context of the record levels of net migration set out in paragraph 3, and a return closer to levels of net migration seen in the decades prior. These impacts are a reduction from this temporary peak, and not a reduction significantly below the historical trend.
15. Whilst the analysis set out in this IA quantifies first order, direct and indirect, impacts associated with the modelled reduction in migration flows, it is the second order effects which drive the rationale for these rule changes. This includes creating an immigration system which provides broader incentives for employers to upskill the domestic workforce rather than importing workers, combined with workforce strategies to strengthen the UK economy and support growth.
16. First order impacts quantified in the appraisal below include the public sector and fiscal impacts associated with the modelled reduction in migration flows, overall representing a negative NPSV. Other unquantifiable first order effects include the impacts on GDP, but also on GDP per capita. Overall, evidence suggests that whilst the modelled reduction in migration flows will have a downward impact on GDP, the impact on GDP per capita is likely to be small in scale, and the direction of impact remains uncertain.
17. As set out above, the wider rationale for changes is to incentivise employers to upskill domestic workers; the impact of which are captured in second order effects as they are not an immediate consequence of the policy. Some academic literature (set out in the analysis and evidence section in more detail), including evidence by Manning et al, suggests high levels of net migration could lead to a reduction in training participation amongst workers, with the effect more pronounced at lower skill levels.[footnote 7] This evidence suggests employers might choose hiring overseas workers as a cost-minimisation strategy, particularly where ready-trained migrant workers exist. Restricting lower skilled migration could therefore provide incentives for employers to invest in the upskilling of the domestic population, with a body of academic literature showing the positive association between investment in training and growth.
18. Whilst the analysis in this IA presents a negative NPSV – associated with the quantifiable first order effects – this must be read in the context of the potentially significant unquantifiable benefits, including the second order effects which drive the rationale for changes.
19. The measures set out in the white paper, part of which are enacted in these immigration rules, form part of a broader government policy to get people back into work, set out in the “Get Britain Working” white paper.[footnote 8] Universal Credit, and legacy benefits, are forecast by the OBR to reach £102 billion a year by 2028/29.[footnote 9] As part of this policy, the government has committed to a Youth Guarantee to support young people into education, employment, or training, and has recently commissioned an independent review into the drivers of the rise in NEETs. The Department for Education has also recently published the post-16 Education and Skills white paper, setting out the government’s strategy on skills. Skills England will play an important role in the newly formed Labour Market Evidence Group, providing advice to the government on filling skills gaps in sectors that are reliant on the immigration system. So, whilst it has not been possible to quantify the second-order labour market impacts in this IA, they form an important part of the overall government strategy to improve labour market outcomes.
20. Sensitivity analysis set out in the Risks and Sensitivity Analysis section suggests that if more than 44% of deterred migrant volumes are replaced by inactive workers under the same assumptions, the package would result in a positive NPSV. This is equivalent to a long-term increase in flow of UK nationals into employment of around 15,000 per year, or around 75,000 over 5 years, out of the current pool of around 1.6 million unemployed people in the UK between February and April 2025.
21. Without government intervention, the business-as-usual scenario would mean that businesses, including the care sector, retain access to lower-skilled migration and increase the risks of not meeting the two strategic objectives above.
22. Further detail on the assessed impact of these changes in meeting these strategic objectives are set out in the Evidence Base section.
3. SMART objectives for intervention
23. As set out above, the strategic objectives set out in the White paper for these changes are to:
- Ensure net migration comes down so the system is properly managed and controlled.
- Link the immigration system to skills and training requirements here in the UK so that no industry is allowed to rely solely on immigration to fill its skills shortages.
24. The first objective will be measurable using the bi-annual ONS publication on Long Term International Migration, the latest of which is currently available for the year ending December 2024.[footnote 10] The policy will be considered successful against the first objective if the overall level of net migration continues to fall.
25. No specific target has been set for this reduction, however this set of policies will need to be considered alongside the wider package of measures in the white paper which will be implemented in due course, many of which will contribute to this objective of reducing net migration.
26. It is more difficult to measure the success of this package of measures against the second objective, given the longer time horizon necessary for these benefits to be realised, and the breadth of the objective across the economy. However, the Labour Market Evidence Group (LME Group), as set out in the White paper, will draw on the best data available about the state of the labour market and the role that different policies should play, rather than always relying on migration. This will enable informed policy decisions to be taken. This evidence produced by this body will provide one important indicator on the success of these measures in achieving this objective.
4. Description of proposed intervention options and explanation of the logical change process whereby this achieves SMART objectives
27. As set out in Section 1, the proposed policy interventions are to:
- Increase the skills threshold for occupations eligible for Skilled Worker and Health and Care visas from RQF level 3 (approximately A-level) to RQF level 6 (graduate level);
- Raise salary threshold and occupational going rate requirements for Skilled Worker, Global Business Mobility and Scale-up visas in line with 2024 ASHE data;
- Close Skilled Worker entry clearance applications for care workers (SOC code 6135) and senior care workers (SOC code 6136), while maintaining in-country switching applications until 22 July 2028;
- Expand the Immigration Salary List (ISL) and introduce a new, interim Temporary Shortage List (TSL), providing time-limited access to the Skilled Worker route for occupations below RQF 6, but with no ability for applicants to bring dependants; and
- Include transitional arrangements, allowing existing Skilled Worker visa holders to continue to extend their visas, bring dependants, change employment and take supplementary employment in occupations below RQF 6, while applying the new rules to applicants from overseas and those applying to switch from other routes. These will not be in place indefinitely and will be subject to review in due course.
28. By their nature, these measures restrict the eligibility requirements for those seeking to come to the UK, thereby directly contributing to the objective of reducing net migration. In turn, by reducing the inflow of RQF 3 to 5 workers to the domestic labour market, the incentive for business to invest in skills and training to fill the resulting shortages increases. Further detail on these channels of impact is set in the Evidence Base section.
5. Summary of long-list and alternatives
29. The government published the Immigration white paper “Restoring Control over the Immigration System” in May 2025.[footnote 11] This paper set out the direction of travel for the Government and was explicit that the measures set out in this IA would be delivered.
30. While significant analysis was undertaken to support the development of the white paper, including consideration of other options, there was no formal long-list appraisal process undertaken as part of this IA following the publication of the white paper.
6. Description of shortlisted policy options carried forward
31. The white paper set out that a new TSL would be created to provide time limited access to the Points-Based immigration system.
32. Requirements for being on the Temporary Shortage List will include having a proper workforce strategy which aims to maximise the use of the UK workforce and includes agreed training and broader plans with skills organisations, including Skills England and the Devolved Governments. The Migration Advisory Committee (MAC) will consider the workforce strategy before providing advice to the Home Secretary, looking at issues such as:
- How far the workforce strategy is underpinned by a skills strategy
- How far it is underpinned by a commitment to work with the Department for Work and Pensions on a domestic labour strategy
- How the sector will manage the risk of exploitation of workers, particularly migrant workers in the sector and
- Whether the strategy is sufficiently ambitious.
33. In the interim, the Immigration Salary List (ISL) will contain occupations that the MAC has recently considered to be in shortage, including those on the current ISL. The ISL is published on gov.uk.[footnote 12]
34. The ISL will be supplemented by the interim Temporary Shortage List (TSL), which is published as part of the Statement of Changes in Immigration Rules at SW 6.1a[footnote 13] and will consist of occupations which meet the following criteria:
- Occupations currently eligible for the Skilled Worker or Health and Care routes, which are at RQF 3 to 5
- Within this, occupations which:
- a. Have a significant proportion of the occupation (50%+) working in any of the eight Industrial Strategy sectors (Advanced Manufacturing, Clean Energy Industries, Creative Industries, Defence, Digital and Technologies, Financial Services, Life Sciences, Professional and Business Services) or Construction, or
- b. Have otherwise been identified by the Department for Business and Trade or HM Treasury as being important to one of these sectors.
35. In this IA, no further assumptions are made on the composition of the TSL, and the interim TSL is assumed to continue throughout the appraisal period. The impacts identified, both quantified and non-quantified, will ultimately depend on the future composition of the TSL.
7. Regulatory scorecard for preferred option
Part A: Overall and stakeholder impacts
| (1) Overall impacts on total welfare | Directional rating | |
|---|---|---|
| Description of overall expected impact |
Note more detailed discussion of quantified impacts and the methods, data and assumptions underpinning them is included in the Evidence Base section. The monetised impacts quantified in the appraisal below include the public sector and fiscal impacts associated with the modelled reduction in migration flows. Overall, this represents a negative NPSV of between -£10.8bn and -£2.2bn over the appraisal period. However, second order impacts encompass how an economy reacts and adjusts to changes more widely. The wider rationale for these changes is to incentivise upskilling of the domestic workforce to support growth. If these changes have an impact on productivity this effect is very important and likely to outweigh many or most other impacts. Within this context, whilst the quantified elements in this IA reflect a negative NPSV, it is plausible that this is outweighed by productivity gains in the longer term due to broader incentives created by these measures. |
Uncertain Based on all impacts (incl. non-monetised) |
| Monetised impacts | As set out above, the monetised impacts represent a negative NPSV of between -£10.8bn and -£2.2bn over the appraisal period, with a central estimate of -£5.4bn. This impact broadly comprises one direct and one indirect impact resulting from the reduction in inflows because of these changes. Specifically: - The direct reduction in public sector revenue (Fees, IHS) equivalent to between -£0.8bn and -£0.5bn over the appraisal period - The indirect reduction in estimated changes in income tax and public service pressures, equivalent to between -£9.5bn and -£1.4bn over the appraisal period Impact assessments are intended to measure the impact on public welfare and are not an official government macroeconomic/fiscal forecast. The fiscal analysis in this IA also does not reflect the methodology used by the OBR, the government’s official economic and fiscal forecaster, to assess the impact of migration on the overall fiscal position of the UK. |
Negative Based on likely £NPSV |
| Non-monetised impacts | Significant non-monetised impacts are considered. These include non-monetised costs to businesses that are expected to occur through the appraisal period, including: - The impacts to business in adjusting to the lower level of inflows As well as non-monetised impacts, primarily to households that might be expected to occur during or beyond the appraisal period, including: - The likelihood of displacement effects and incentives for training and investment resulting in UK nationals filling vacancies - The dynamic fiscal consequences of changes in migrant stock in the long term As these non-monetised impacts represent both costs and benefits, the overall direction of the non-monetised impacts is uncertain. Further detail is set out in the Evidence Base section |
Uncertain |
| Any significant or adverse distributional impacts? | No These changes are not expected to have a disproportionate impact on small to medium businesses, specific households or on specific nations and regions of the UK. There could be an impact on specific households – for example if the labour cost component of care costs increase as a result of changes – but in the context of the overall expected impact on the ASC sector (as discussed in the Evidence Base), this impact is thought to be minimal. Further analysis, particularly on regional impacts, is set out in the Evidence Base section. |
Neutral |
| (2) Expected impacts on businesses | Directional rating | |
|---|---|---|
| Description of overall business impact | While the modelled impact on inflows is expected to be significant, usage of the Skilled Worker route in RQF 3 to 5 occupations represent a relatively small proportion of the total resident workforce. Annual out of country inflows as a share of the overall sector workforce range from around under 0.01 per cent to 0.05 per cent depending on the sector. The labour market is dynamic and, as with any change in environment, markets are expected to adjust and reallocate resources to their most productive use – at least in sectors where output and wages are primarily influenced by market forces. How employers choose to adjust, the relative ease and length of time taken to do so will depend on the specific characteristics of an occupation and firms. These adjustments could include: - Altering the ratio of labour to capital within the firm’s production, such as automating the production line where possible, and substituting capital for labour, - Freezing recruitment, or substituting for domestic inflows into the workforce - Changing production levels. - Changing location of production or outsourcing parts of the production process Each of these adjustments may come with a cost to the firm, either in the form of higher wages, higher up-front investment costs or, in some cases, lower output. While it is not possible to quantify these as the ability of an employer to respond through each of these avenues is highly firm-specific, it is likely this policy represents, at least in the short-term, an overall negative impact on business. The monetised impacts set out below are likely to be small in comparison. |
Negative |
| Monetised impacts | There is a reduction in the liability to pay for a Certificate of Sponsorship to sponsor workers in RQF 3 to 5 occupations and a reduction in the liability to pay the ISC. However, there is also a larger indirect cost for firms who choose to pay higher salaries to meet the higher salary threshold. The quantified impact on business is almost certain to be significantly smaller than the indirect costs to business set out above. |
Negative Based on likely business £NPV |
| Non-monetised impacts | Non-monetised impacts include both the adjustments costs set out above, which are likely significant, as well as any familiarisation costs for firms to the new guidance, which are expected to be minimal. | Negative |
| Any significant or adverse distributional impacts? | None identified While the ability of Small and Medium sized firms to make the type of adjustments set out above may be more limited, they are on average less reliant on the migrant workforce. It is therefore not clear that there will be significant distributional impacts between firm sizes. |
Neutral |
| (3) Expected impacts on households | Directional rating | |
|---|---|---|
| Description of overall household impact | In line with previous Home Office analysis and following recommendations made by the MAC, this IA considers the impact of the proposals on the welfare of the UK resident population; considered to be UK nationals and migrants at the point of application for naturalisation as British Citizens. There are no negative impacts on households identified, either monetised or non-monetised. If these changes to the labour market have an indirect impact on the labour market, through increases in training opportunities, investment and substitution of migrant labour with domestic labour, this may have a positive impact on the resident labour force. Further, any Social and Community Impacts arising from reductions in migrant inflows may have an impact on domestic households. As such, even though the magnitude of these unquantified benefits is uncertain, the lack of any identified costs is likely to result in a positive overall impact on households. These impacts are considered in “Non-monetised Impacts” below and in the Evidence Base section. |
Positive |
| Monetised impacts | No monetised household impacts have been identified. | Neutral Based on likely household £NPV |
| Non-monetised impacts |
Labour Market Displacement and Wage Impacts As set out in the Evidence Base section, and throughout, the wider rationale for these changes is to incentivise upskilling of the domestic workforce to support growth. While there has not been sufficient time for a significant body of evidence to be developed, there is some literature that further explores the link between high net migration and training, with evidence suggesting employers might choose hiring overseas workers as a cost-minimising strategy, particularly where ready trained migrant workers exist, avoiding the need to hire and train the local workforce. In particular, as set out in the Evidence Base section, Manning et al explore the relationship between high levels of net migration and domestic upskilling. If this set of policies have a positive impact on investment, particularly in training, which results in greater opportunities for the domestic workforce, particularly in the context of the rising level of youth unemployment, to find jobs this will have a positive impact on households. Social and Community Impacts Recent Ipsos polling (April 2025) found that 67 per cent of British people surveyed believe immigration levels are too high, with 43 per cent reporting they are ‘much too high’.[footnote 14] Respondents were also more likely to perceive that immigrants have a negative rather than a positive impact on their local community. However, Skilled Workers were viewed more positively than other migrant groups in relation to their impact on local communities, though the specific nature of these impacts was not defined. This distinction is supported by research from the Migration Observatory which found that the British public tends to differentiate between migrant types, with high skilled migrants receiving greater support, although there were some differences in views across the cohort of low skilled migrants, with more positive views towards care workers for older people for example.[footnote 15] The MAC also reviewed evidence on social and community impacts and suggested “there is no evidence that migration has affected crime. There is no evidence that migration has reduced subjective well-being though some suggestion that this varies with attitudes to migration. Overall, there is no evidence that people are less satisfied with their neighbourhoods than in the past.” but also that “the impacts of migration on communities is hard to measure due to their subjective nature which means there is a risk they are ignored“. It is therefore uncertain whether there will be material impacts on social and community cohesion. |
Positive |
| Any significant or adverse distributional impacts? | This will benefit across a broad range of UK households where firms train domestic workers. | Positive |
Part B: Impacts on wider government priorities
| Category | Description of impact | Directional rating |
|---|---|---|
| Business environment: Does the measure impact on the ease of doing business in the UK? |
There is likely to be a cost to business over this appraisal period due to the adjustment costs set out above. However, if these policy proposals result in an increased pool of skilled labour and an increase in overall productivity, this could represent an overall net benefit to business in the long-run. | Neutral |
| International Considerations: Does the measure support international trade and investment? |
There are a number of channels through which immigration may affect trade and, in general, the external literature finds a positive relationship between the stock of migrants and trade However, the expected reduction in migrants in any appraisal year as a result of the preferred option is small compared to the total stock of migrants resident in the UK. Therefore, any trade impacts are be expected to be small. |
Neutral |
| Natural capital and Decarbonisation: Does the measure support commitments to improve the environment and decarbonise? |
No meaningful impacts have been identified. | Neutral |
8. Monitoring and evaluation of preferred option
36. The impact will be monitored by the Home Office, with support as appropriate from other government departments. This will be included as part of ongoing evaluations of the Skilled Worker and Health and Care routes.
37. A first-wave evaluation of the Skilled Worker and Health and Care routes was completed and published in May 2025. The research provided insights into the motivations, experiences, and activities of visa holders and sponsors, and was used to inform White paper proposals. A second-wave evaluation is planned to capture and assess the impact of policy changes and the extent of any post-implementation behavioural shifts.
38. The Home Office also publishes migration statistics quarterly, including for the Skilled Worker and Health and Care routes, and by occupation which will also provide evidence on the impact of these changes on inflows.
39. The Home Office will also maintain open lines of communication with applicants via email and may also receive feedback as part of its normal visa issuing processes, through its public enquiry lines, and through formal correspondence with interested parties.
40. In parallel, the Department of Health and Social Care (DHSC) monitors the adult social care workforce capacity through regular analysis of national workforce data, including information from Skills for Care’s Adult Social Care Workforce Data Set (ASC-WDS), the Capacity Tracker data collection and insight tool, and intelligence from key sector partners. This monitoring helps assess trends in recruitment, retention, and vacancy rates across the sector, and provides contextual evidence on the broader impact of immigration policy changes on the care workforce. Insights from this analysis support ongoing policy development.
9. Minimising administrative and compliance costs for preferred option
41. Administrative and compliance costs as a result of these changes are expected to be negligible. While there may be some small familiarisation costs being placed on Immigration Advisors and Lawyers, no additional compliance burdens are identified for UK businesses or citizens as any costs associated with complying with the Immigration Rules remain unchanged beyond reducing the scope of those eligible for the routes.
10. Main assumptions / sensitivities and economic / analytical risks
42. Further detail on the analysis presented in this IA is set out in the Evidence Base section below. This sets out the methods used to estimate potential impacts of the policy option, outlines the assumptions used and the sources of assumptions, explains the limitation of analysis and where well evidenced quantification of impacts has not proved possible has discussed impacts qualitatively.
43. The monetised impacts quantified in the appraisal below include the public sector and fiscal impacts associated with the modelled reduction in migration flows. The analysis presented for these factors has used ranges to illustrate the impact from varying important assumptions, and explanation of the inherent uncertainty.
44. Despite the use of ranges, the potential future volume of applicants who would have come to the UK in RQF 3 to 5 jobs and to work in care in the absence of these policy changes could reasonably be outside these ranges. Numerous external factors that drive the demand for people to come to the UK could have resulted in significantly more, or fewer, people wishing to come to the UK on these routes, and therefore a significantly larger, or smaller, impact resulting from the policy changes.
45. This impact is compounded by the potential for ineligible applicants to be displaced into other RQF3-5 occupations that remain on the TSL.
46. This IA illustratively assumes that 10 per cent of out of country and 20 per cent of in-country applicants who would have come on ineligible RQF 3-5 occupations find an alternative RQF 3-5 job rather than not come to, or leave, the UK.
47. Sensitivity analysis has been undertaken in the Risks and Sensitivity Analysis section to quantify the impact on the NPSV if a greater (50 per cent for both out of country and in country applicants) or a lower (0 per cent) proportion of applicants are displaced into alternative RQF 3-5 roles.
48. Further, as noted throughout, second order impacts encompass how an economy reacts and adjusts to changes more widely. The wider rationale for these changes is to incentivise upskilling of the domestic workforce to support growth. If these changes have an impact on productivity or on the substitution towards native employment this would be very important and could outweigh many or most other impacts.
49. Within this context, whilst the quantified elements in this IA reflect a negative NPSV in the central case, it is plausible that this is outweighed by productivity gains in the longer term due to broader incentives created by these measures.
50. It is not possible to mitigate this risk in the estimation of the NPSV, but it reflects the largest source of uncertainty. The long-term economic impact of this policy may be significantly different to what it has been possible to quantify and if there is sufficient economic adjustment, the overall economic impact may be positive.
51. However, to address this, sensitivity analysis has been undertaken in the Risks and Sensitivity Analysis section to quantify the impact on the NPSV if the policy changes result in an illustrative increase in employment of UK nationals.
52. Further detail on both the monetised and non-monetised elements, and further discussion on this risk is set out in the Evidence Base section below.
Declaration
| Department: | Home Office |
|---|---|
| Contact details for enquiries: | Migration and Citizenship Policy, Home Office |
| Minister responsible: | Minister Mike Tapp |
I have read the Impact Assessment, and I am satisfied that, given the available evidence, it represents a reasonable view of the likely costs, benefits and impact of the leading options.
Signed:
Date: 8 December 2025
Summary: Analysis and evidence
For Final / Enactment Stage Impact Assessment, please finalise these sections including the full evidence base. For a Consultation Stage Impact Assessment, these sections can be in less detail with evidence gaps highlighted.
| Price base year: | 2025/26 |
| PV base year: | 2025/26 |
Costs (£m)
| 1. Business as usual (baseline) | 2. Do-minimum Option | |
|---|---|---|
| Low | NA – no change in relation to baseline | £7.0 billion |
| High | NA – no change in relation to baseline | £14.4 billion |
| Best | NA – no change in relation to baseline | £9.6 billion |
| Non-Quantified Impacts | N/A | Additional non-quantified costs are likely to be incurred by business in adjusting to the reduction in migrant labour. How employers choose to adjust, the relative ease and length of time taken to do so will depend on the specific characteristics of an occupation and firms |
Benefits (£m)
| 1. Business as usual (baseline) | 2. Do-minimum Option | |
|---|---|---|
| Low | NA – no change in relation to baseline | £4.8 billion |
| High | NA – no change in relation to baseline | £3.7 billion |
| Best | NA – no change in relation to baseline | £4.2 billion |
| Non-Quantified Impacts | N/A | Second order impacts encompass how an economy reacts and adjusts to changes more widely. The wider rationale for these changes is to incentivise upskilling of the domestic workforce to support growth. If these changes have an impact on domestic employment or productivity this effect is very important and could outweigh quantified impacts |
Net present social value (£m)
| 1. Business as usual (baseline) | 2. Do-minimum Option | |
|---|---|---|
| Low | NA – no change in relation to baseline | -£2.2 billion |
| High | NA – no change in relation to baseline | -£10.8 billion |
| Best | NA – no change in relation to baseline | -£5.4 billion |
| 1. Business as usual (baseline) | 2. Do-minimum Option | |
|---|---|---|
| Public sector financial costs | NA – no change in relation to baseline | Public sector financial costs are included in the NPSV as changes to visa fee, IHS and ISC revenue. These are set out in detail in the Evidence Base section. |
| Significant un-quantified benefits and costs | NA – no change in relation to baseline | The wider rationale for changes is to incentivise employers to upskill domestic workers; the impact of which are captured in second order effects as they are not an immediate consequence of the policy. Academic literature (set out in the analysis and evidence section in more detail), including evidence by Manning et al, suggests high levels of net migration could lead to a reduction in training participation amongst workers, with the effect more pronounced at lower skill levels. This evidence suggests employers might choose hiring overseas workers as a cost-minimisation strategy, particularly where ready-trained migrant workers exist. Restricting low skilled migration is therefore likely to provide incentives for employers to invest in the upskilling of the domestic population, with a body of academic literature showing the positive association between investment in training and growth. Whilst the analysis in this IA presents a negative NPSV – associated with the quantifiable first order effects – this must be read in the context of the potentially significant unquantifiable benefits, including the second order effects which drive the rationale for changes. |
| Key risks | NA – no change in relation to baseline | Analysis presented in this IA has set out the methods used to estimate potential impacts of the policy option, outlined assumptions used and the sources of assumptions, explained limitation of analysis and where well evidenced quantification of impacts has not proved possible has discussed impacts qualitatively. Analysis presented has used ranges to illustrate the impact from varying important assumptions such as baseline volumes and elements of fiscal impacts. However there remain two key channels of impact not captured in the range of quantified impacts– that a significant proportion of in-country applicants are displaced onto other routes and that there is a significant increase in domestic employment as a result of any increase in training and investment. While the former remains an unquantified risk, the latter is set out in the sensitivity analysis below. |
| Results of sensitivity analysis | NA – no change in relation to baseline | If 50 per cent of future ineligible inflows are replaced by domestic labour, as a result of increases in training and investment by domestic firms, this would represent an additional benefit of £6.2bn in the central case (5 year PV, 2025/26 prices), not currently included in the NPSV. This would change the overall NPSV to a positive £0.8bn. The tipping point for the NPSV to become positive would assume around 44% of jobs are filled by domestic employment. |
Evidence base
Analytical Framework
1. An analytical framework is used to assess the impact of the first order effects associated with policy changes. As set out above, the analysis must be read in the context of the second order effects, which underpin the rationale for changes, but are unquantifiable. A discussion on these second order effects is included in the wider impacts section.
2. The framework for quantifying first order effects starts by constructing a baseline which estimates potential future migrant flows in the absence of any policy intervention, against which the policy options can be assessed.
3. Policy proposals are then modelled on this baseline to estimate how migrant flows may change as a result. These results are used to assess the population impact, which forms the basis for estimating the wider economic impacts. These principles apply both to where impacts can, and cannot, be quantified. Analysis assumes compliance from both migrants and employers. As such all discussion of flows and impacts do not consider illegal or irregular activity.
4. In line with previous Home Office analysis and following recommendations made by the MAC, this IA considers the impact of the proposals on the welfare of the UK resident population; considered to be UK nationals and migrants at the point of application for naturalisation as British Citizens. Determinants of this impact will include the estimated number of migrants coming to or leaving the UK under the policies, the characteristics of the migrants in scope (for example their age, income and health) and the choices and services available to them when in the UK.
5. Analysis is presented across a 5-year appraisal period from the start of 2025/26 financial year onwards. As noted throughout, it is not possible to quantify the main strategic objective of this set of policies, to upskill domestic workers. Given this limitation is likely to impact the NPSV more in the longer term when these benefits would be realised, a shorter 5-year period has been chosen, with a greater commitment to monitor and evaluate the extent to which this strategic objective is being met.
6. Adjustments are made for the implementation dates of individual policies which may not perfectly align to the financial year. Information is presented in 2025/26 prices and a 3.5 per cent discount rate is applied where appropriate, in line with HM Treasury Green Book guidance[footnote 16]. Where needed, GDP deflators have been used to adjust price years and salary information has been uplifted by real productivity growth.
7. Where necessary, information on the current operation of the Skilled Worker and Health and Care routes (including for Care Workers) is drawn from the 6 month period to March 2025. This is because significant changes were made to these routes in April 2024, and the impact of these changes was not immediate. This 6-month period is therefore likely to best reflect the operation of the routes once the effects of the Spring 2024 immigration rules changes had begun to stabilise, and in the absence of the Spring 2025 rules changes.
8. First order impacts include immediate, both direct and indirect, effects associated with modelled reductions in migration flows. These impacts are quantified in the appraisal under the following categories:
- Labour market impacts – this occurs due to the policies closing the Skilled Worker route to certain occupations and deterring some individuals for whom dependants will no longer be permitted. Sector-specific impacts relative to current workforce volumes are additionally quantified.
- Tax income and public services pressure - these arise from changes in volumes, and the characteristics of the cohort estimated. Changes in volumes result in fewer people residing in the UK, reducing tax income and public services pressure. Increased salaries offered by employers increases tax income. This indirect impact falls to the public sector.
- Fee and Charge revenue and processing cost impacts – these arise from changes in volumes, and the resulting change in visa applications / grants which affect the revenue and processing costs in these areas. This direct impact falls to the public sector.
9. Non-quantified impacts are discussed in the Cost Benefit Analysis section. This includes a discussion on other first-order impacts associated with the reduction in flows that have not been quantified in the appraisal, including impacts on GDP, but also on GDP per capita.
10. The wider rationale for these rule changes is to create an immigration system which provides incentives for employers to upskill the domestic workforce rather than importing workers, combined with workforce strategies to strengthen the UK economy and support growth. Although these are not an immediate consequence of the policy – and are therefore considered second-order impacts materialising throughout but also beyond the appraisal considered in the IA – they are likely to be substantial and are discussed in the wider impacts section. Therefore, whilst the IA sets out an overall negative NPSV, this must be read in the context of the significant unquantifiable benefits, including the second order effects of changes on growth which drives the rationale for changes.
Impact on volumes
Baseline Volumes
11. This section outlines the volume of visas issued under each of the affected routes in the absence of the policy changes. Discussion of estimated volumes within policy scenarios are compared to these counterfactual baselines.
12. The baseline is based on Home Office internal estimates of demand and should be considered as indicative. Estimates around future visa applicants’ behaviour is uncertain. Projections of main applicant and dependant visa demand use recent trends in volumes to estimate future volumes and are revised on an ongoing basis. The Home Office estimate applications up to the end of the 2028/29 financial year and the IA assumes that the baseline volumes remain constant at 2028/29 levels until the end of the appraisal period.
13. These volumes are reduced by 25 per cent in the low scenario and increased by 25 per cent in the high scenario to provide an illustrative range which accounts for uncertainty in future volumes. The MAC highlights that “migration is very susceptible to shock events which are, by their very nature, hard to predict, such as economic cycles, military conflict and policy changes. Changes in migration flows can be subject to extreme short-term fluctuations”.[footnote 17]
14. Grant rates, based on outcomes observed in the 6 months to March 2025 within Home Office management information, are applied to these application projections to estimate granted visa projections. As the grant rate varies considerably by occupation (for example, over the period, 42 per cent of SOC 5434 “Chefs” applications were granted, as compared to 96 per cent of SOC 2133 “IT business analysts”), and the policy primarily affects only a subset of occupations, this calculation is done at the occupation specific level, but estimates are provided in Table E1 below for the routes as a whole.
Table E1. Grant Rates for Skilled Worker visa routes, by previous location (In and Out of Country), October 2024 - March 2025. Main Applicants.
| Route | Grant Rate |
|---|---|
| Out of Country - Skilled Worker | 72% |
| In Country - Skilled Worker | 97% |
| Out of Country - Health & Care | 95% |
| In Country - Health & Care | 82% |
Source: Internal Home Office analysis
15. Combining the application demand estimates with the grant rates above, by occupation, Table E2 sets out the baseline annual visas issued by route. The Health and Care figures below do not include those in Care Worker occupations so are additive to the Care and Senior Care Worker volumes presented. Table E2 only considers In-Country visas issued to those switching onto the route, as those extending are assumed not to be affected by the policy changes.
16. The volumes of dependants estimated on the Skilled Worker and Health and Care route are estimated via two steps. The first takes the projected demand estimates for out-of-country dependants, assigning these predominantly to out-of-country main applicants aside from a share assigned to in-country main applicants (capturing out-of-country dependants joining main applicants already in the UK). The second step estimates the dependant ratio for those switching onto the routes from in-country. This ratio is less than the Skilled Worker and Health and Care route averages due to this cohort predominantly switching from the Student and Graduate routes.
Table E2. Baseline visas issued on Skilled Worker visa routes, by previous location (In and Out of Country) and financial year. Central scenario. Main applicants and dependants.
Out of Country
| Cohort | Main Applicant / Dependant | 2025/26 | 2026/27 | 2027/28 | 2028/29 Onwards |
|---|---|---|---|---|---|
| Skilled Worker | Main | 36,000 | 36,000 | 37,000 | 36,000 |
| Dependant | 37,000 | 38,000 | 39,000 | 38,000 | |
| Health & Care | Main | 13,000 | 13,000 | 13,000 | 13,000 |
| Dependant | 26,000 | 26,000 | 27,000 | 26,000 | |
| Care and Senior Care Workers | Main | 7,000 | 7,000 | 7,000 | 7,000 |
| Dependant | N/A | N/A | N/A | N/A |
In Country
| Cohort | Main Applicant / Dependant | 2025/26 | 2026/27 | 2027/28 | 2028/29 Onwards |
|---|---|---|---|---|---|
| Skilled Worker | Main | 41,000 | 41,000 | 41,000 | 41,000 |
| Dependant | 29,000 | 29,000 | 29,000 | 29,000 | |
| Health & Care | Main | 8,000 | 8,000 | 8,000 | 8,000 |
| Dependant | 9,000 | 9,000 | 9,000 | 9,000 | |
| Care and Senior Care Workers | Main | 21,000 | 21,000 | 21,000 | 21,000 |
| Dependant | N/A | N/A | N/A | N/A |
Source: Internal Home Office analysis
Note: estimates in 2028/29 are flatlined over the remainder of the appraisal period, so for brevity the table presents annual application estimates up until this year. Care and Senior Care Workers are removed from the wider Health and Care estimates
17. Since March 2024, care workers who apply out of country, or switch in country onto the Health and Care route are ineligible to bring dependants.[footnote 18] Existing care workers in the UK, including those applying to extend their stay, remain eligible to bring dependants. As internal insight suggests many existing care workers have continued to bring new out-of-country dependants, it is necessary to apportion the overall dependant volume between care workers and the remaining Health and Care route.
18. In the absence of data matching dependants to occupation, the overall dependant to main applicant ratio for the Health and Care route is applied to existing care workers, with the remaining dependants are assumed to be accompanying the remaining Health and Care occupations. As it will not be possible for new care workers to bring dependants, the volume that have been apportioned to care occupations are not included in the baseline above.
Policy Impact on Volumes
RQF 3 to 5 Restrictions on Skilled Worker and Health and Care
19. The proportion of those on the Skilled Worker and Health and Care routes below the proposed RQF 6 skills threshold are first estimated using Home Office administrative data. Whilst the policy impacts assessed in this wider section (RQF 3 to 5 restrictions, dependant restrictions and raising the salary threshold requirements) all come in concurrently, the RQF 3 to 5 restriction is the most significant policy change and so is modelled first. Table E3 below sets out the share of visas issued on each route between October 2024 and March 2025 estimated to be below RQF 6+, as well as the share of the RQF 3 to 5 visas issued in occupations not on the initial TSL or ISL which are exempt from any restrictions. After December 2026, when RQF 3 to 5 roles on the ISL are removed, the share of visas issued in occupations on the ISL are assumed to be no longer exempt from the restrictions. By combining these figures, Table E3 sets out the share of each route which are assumed to be affected by the policy. For Care and Senior Care workers, 100 per cent of the occupation is assumed to be restricted.
Table E3. Skill-level and proportion not on TSL by occupation for visas issued on Skilled Worker visa routes October 2024 to March 2025. Main Applicants.
| Route | (1) RQF 3 to 5 | (2) RQF 3 to 5 not on TSL or ISL | (3) RQF 3 to 5 not on TSL | (1) * (2) Policy Impact (until end of Dec 2026) | (1) * (3) Policy Impact (Jan 2027 onwards) |
|---|---|---|---|---|---|
| Out of Country - Skilled Worker | 41% | 53% | 55% | 22% | 23% |
| In Country - Skilled Worker | 55% | 62% | 62% | 34% | 34% |
| Out of Country - Health & Care | 8% | 43% | 93% | 3% | 7% |
| In Country - Health & Care | 62% | 66% | 98% | 41% | 59% |
| Out of Country - Care and Senior Care Workers | 100% | 0% | 0% | 100% | 100% |
| In Country - Care and Senior Care Workers | 100% | 0% | 0% | 100%* (From 2028) | 100%* (From 2028) |
Source: Internal Home Office analysis
20. This is applied to the volumes in Table E2 to give an estimate of the flow of migrants estimated to no longer arrive or remain in the UK as a result of the increase in the skills threshold. This analysis assumes any applicant who would otherwise have applied to switch onto the Skilled Worker or Health and Care routes who is now unable to do so leaves the UK.
21. Of those affected by the restrictions, it is likely that some will have sufficient skills to find an alternative RQF 3 to 5 role to come to or remain in the UK. The ONS’s occupation-level assessment of skills substitutability is used to estimate transferability from ineligible RQF 3 to 5 roles to those remaining eligible via the TSL or ISL (until December 2026).[footnote 19] A minimum transferability score of 96 per cent is applied, along with demand constraints on a small number of occupations based on UK median salary data against route thresholds. An estimated 34 per cent of those in now-ineligible roles on the Skilled Worker route and 36 per cent of those in now-ineligible roles on the Health and Care route are assumed to find an eligible job in a different occupation, on a similar salary, and are therefore removed from the analysis. Post-December 2026, when RQF 3 to 5 roles on the ISL are removed, these percentages are respectively 32 per cent and 5 per cent.
22. Of the remaining cohort, an estimate is made of the volume who may switch into care. Table E4 shows the out-of-country restrictions on Care worker occupations are estimated to lead to a reduction in around 7,000 migrants per year in these roles. Assuming sufficient motivation to remain in the UK, an in-country migrant with insufficient skills transferability to displace into an alternative RQF 3 to 5 role (as discussed above) may feasibly displace into a Care worker job until the in-country Care worker restrictions are introduced in 2028. The Skilled Worker route evaluation is used to estimate the proportion who, motivated by a desire to remain in the UK, could prepare for and seek a Care worker job.[footnote 20] The reduction in out-of-country migrants to care roles is viewed as the absolute demand constraint for this specific displacement effect.
23. This adjustment is very uncertain and should be considered illustrative. Sensitivity analysis has therefore been undertaken in the Risks and Sensitivity Analysis section to assess the impact of a greater or lower proportion of applicants displacing into alternative roles.
24. Long term, it is likely that rather than being unable to switch in-country, a proportion of applicants will instead choose not to come to the UK in the first place if they know it is not an option to switch into RQF 3 to 5 or Care or Senior Care employment. This could have a knock-on consequence, particularly on the UK education sector, which is not quantified in this IA.
Table E4. Change in visas issued on Skilled Worker visa routes as a result of the skill level and care worker policy changes, by previous location (In and Out of Country) and financial year. Central scenario. Main applicants and dependants.
Out of Country
| Cohort | Main Applicant / Dependant | 2025/26* | 2026/27 | 2027/28 | 2028/29 Onwards |
|---|---|---|---|---|---|
| Skilled Worker | Main | -5,000 | -7,000 | -8,000 | -7,000 |
| Dependant | -4,000 | -6,000 | -6,000 | -6,000 | |
| Health & Care | Main | 200 | 200 | -100 | -100 |
| Dependant | -400 | -1,000 | -1,000 | -1,000 | |
| Care and Senior Care Workers | Main | -5,000 | -7,000 | -7,000 | -7,000 |
| Dependant | N/A | N/A | N/A | N/A |
In Country
| Cohort | Main Applicant / Dependant | 2025/26* | 2026/27 | 2027/28 | 2028/29 Onwards |
|---|---|---|---|---|---|
| Skilled Worker | Main | -6,000 | -9,000 | -9,000 | -9,000 |
| Dependant | -2,000 | -3,000 | -3,000 | -3,000 | |
| Health & Care | Main | -200 | -1,000 | -4,000 | -3,000 |
| Dependant | -100 | -500 | -2,000 | -2,000 | |
| Care and Senior Care Workers | Main | 3,000*** | 5,000*** | 7,000*** | -12,000** |
| Dependant | N/A | N/A | N/A | N/A |
Source: Internal Home Office analysis
Note (1): estimates in 2028/29 are flatlined over the remainder of the appraisal period, so for brevity the table presents annual application estimates up until this year. *The policy is assumed to be implemented from August 2025, and so will only affect seven months of 2025/26 ** As the policy on in-country care workers also commences part-way through 2028/29, this is only a part-year figure. The full annual figure for 2029/30 and beyond is 21,000. Note (2): the substitution effect set out in paragraph 20 is modelled to result in a small volume of care workers moving into RQF 3-5 occupations. As they will not remain in Care and Senior Care, these substituted volumes are considered as reduction in volume in this sector in this table but are captured in subsequent modelling.
Note (3): ***In-country switching is only permitted for Care and Senior Care through to 2028 for those who have worked in the sector for 3 months or more. For the purposes of this modelling no impacts are modelled for in-country switching through to 2028. While some switchers may not be eligible under these rules, behavioural responses are expected where those intending to switch into care or senior care work after the Student or Graduate route will look to secure work for 3 months before they switch so that they can meet new requirements.
Dependant Restrictions on RQF 3 to 5 Skilled Worker and Health and Care occupations
25. The second policy change that is layered on top of this impact the restriction on those in exempt RQF 3 to 5 occupations bringing dependants. The 2025 Home Office Evaluation of the Skilled Worker route is used to estimate the proportion of Skilled Worker route users who bring dependants (40 per cent on the Skilled Worker route and 64 per cent on the Health and Care route) and the proportion of those who brought dependants who may not have come to the UK if they were unable to do so (67 per cent on the Skilled Worker route and 53 per cent on the Health and Care route ).[footnote 21]
26. Combined, this analysis suggests that for every dependant restricted, 0.27 and 0.34 main applicants could be deterred from coming on the Skilled Worker and Health and Care routes respectively. Table E.5 below sets out the additional volume of restricted dependants and deterred main applicants as a result of this policy. These volumes should be considered in addition to those in Table E4.
Table E5. Additional change in visas issued on Skilled Worker visa routes as a result of the RQF 3 to 5 dependants restriction, by previous location (In and Out of Country) and financial year. Central scenario. Main applicants and dependants.
Out of Country
| Cohort | Main Applicant / Dependant | 2025/26* | 2026/27 | 2027/28 | 2028/29 Onwards |
|---|---|---|---|---|---|
| Skilled Worker | Main | -1,000 | -2,000 | -2,000 | -2,000 |
| Dependant | -4,000 | -7,000 | -6,000 | -6,000 | |
| Health & Care | Main | -200 | -300 | - | - |
| Dependant | -1,000 | -1,000 | -300 | -300 | |
| Care and Senior Care Workers | Main | N/A | N/A | N/A | N/A |
| Dependant | N/A | N/A | N/A | N/A |
In Country
| Cohort | Main Applicant / Dependant | 2025/26* | 2026/27 | 2027/28 | 2028/29 Onwards |
|---|---|---|---|---|---|
| Skilled Worker | Main | -1,000 | -1,000 | -1,000 | -1,000 |
| Dependant | -3,000 | -4,000 | -4,000 | -4,000 | |
| Health & Care | Main | -500 | -1,000 | -100 | -100 |
| Dependant | -1,000 | -2,000 | -200 | -200 | |
| Care and Senior Care Workers | Main | N/A | N/A | N/A | N/A |
| Dependant | N/A | N/A | N/A | N/A |
Source: Internal Home Office analysis
Note: estimates in 2028/29 are flatlined over the remainder of the appraisal period, so for brevity the table presents annual application estimates up until this year. *The policy is assumed to be implemented from August 2025, and so will only affect seven months of 2025/26. “–“ denotes fewer than 100.
Raising the salary threshold requirements for Skilled Worker routes
27. Finally, the estimated impact of the increase in salary threshold is assessed. To allow for the impacts in this IA to be considered together, this impact is considered on a baseline where the policy impacts in Tables E4 and E5 have already been removed from the baseline in Table E2. This policy therefore only affects the sub-set of remaining RQF 6+ (or those on the TSL, or ISL until December 2026) occupations who are paid below the new minimum salary threshold.
28. As with previous updates of underlying salary data,[footnote 22] salary thresholds are updated using the methodology previously outlined by the MAC.[footnote 23] Using ASHE 2024 data, the general salary threshold for the Skilled worker route would increase seven per cent from £38,700 to £41,700 and seven per cent for the Health and Care route, from £29,000 to £31,300. The going rates for each occupation, as well as the implied salary floor would also increase in line with the ASHE 2024 data and will be published alongside the Immigration Rules. Unlike the increase to the skill threshold, these changes will also apply to those already on the routes, extending their visas.
29. Approximately 16 per cent of the remaining Skilled Worker and 21 per cent of the remaining Health and Care visas issued across both In and Out of country were estimated to be paid a salary below the revised thresholds up until December 2026 (with exemption for ISL roles), and 12 per cent and 19 per cent respectively thereafter (with ISL roles no longer exempt from the policies).
30. The impact of raising the salary thresholds in considered using a methodology consistent with that used in the 2024 Spring Immigration Rules.[footnote 24] This methodology is set out in detail in the 2024 IA but in summary, the total change in the cost of employment (salary costs and non-salary costs such as National Insurance Contributions and Employer Pension Contributions) required to meet new thresholds is estimated, and then applied to published research into the price elasticity of labour demand to estimate a change in demand for labour on the relevant visa routes.[footnote 25]
31. The impacts of the policy package can therefore be separated out into:
- a. The reduction in volumes of migrant workers coming to the UK as a result of the increase in salaries,
- b. The remaining flow of migrant workers who will receive salary increases.
32. As the reductions in volumes are relatively small as compared to the other measures, impacts are grouped in Table E6 below by route and are combined for In and Out of Country. The remaining volumes of Main Applicants set out in the same table are expected to receive a salary increase up to the new minimum.
Table E6. Estimated reduction in annual applications as a result of the increase in salary thresholds, by cohort and financial year. Central scenario. Main applicants and dependants.
Reduction in Inflows
| Cohort | Main Applicant / Dependant | 2025/26* | 2026/27 | 2027/28 | 2028/29 Onwards |
|---|---|---|---|---|---|
| Skilled Worker | Main | -1,100 | -1,600 | -1,600 | -1,600 |
| Dependant | -500 | -700 | -700 | -700 | |
| Health & Care | Main | -1,200 | -1,600 | -1,000 | -1,000 |
| Dependant | -700 | -900 | -600 | -600 | |
| Care and Senior Care Workers | Main | N/A | N/A | N/A | N/A |
| Dependant | N/A | N/A | N/A | N/A |
Volumes assumed to raise salaries to meet higher threshold
| Cohort | Main Applicant / Dependant | 2025/26* | 2026/27 | 2027/28 | 2028/29 Onwards |
|---|---|---|---|---|---|
| Skilled Worker | Main | 23,000 | 33,000 | 32,000 | 31,000 |
| Dependant | N/A | N/A | N/A | N/A | |
| Health & Care | Main | 26,000 | 35,000 | 19,000 | 18,000 |
| Dependant | N/A | N/A | N/A | N/A | |
| Care and Senior Care Workers | Main | N/A | N/A | N/A | N/A |
| Dependant | N/A | N/A | N/A | N/A |
Source: Internal Home Office analysis
Note: estimates in 2028/29 are flatlined over the remainder of the appraisal period, so for brevity the table presents annual application estimates up until this year.
*Care and Senior Care Worker volumes have been removed from the Skilled Worker – Health and Care volumes.
33. The increase in salary thresholds will also affect those on the Global Business Mobility route, where salaries are higher and less clustered around the minimum, and the Scale Up route, where overall volumes are low. As a result, it is the impact of the increase in the salary thresholds on these routes is likely to be small, and therefore no further analysis has been undertaken in this IA.
Overall combined impact on volumes
34. Tables E4, E5 and E6 represent the impact of the policy proposals against the baseline in Table E2. A summary table, E7 below, combines these individual impacts together to represent the overall impact of the policies in this IA. Together, from 2028/29 onwards this represents a reduction of 27,000 inflows annually, and a reduction of around 33,000 in country switchers annually.
Table E7. Total change in visas issued on Skilled Worker visa routes as a result of all policy proposals combined, by previous location (In and Out of Country) and financial year. Central scenario. Main applicants and dependants.
Out of Country
| Cohort | Main Applicant / Dependant | 2025/26* | 2026/27 | 2027/28 | 2028/29 Onwards |
|---|---|---|---|---|---|
| Skilled Worker | Main | -7,000 | -10,000 | -10,000 | -10,000 |
| Dependant | -6,000 | -8,000 | -9,000 | -8,000 | |
| Health & Care | Main | -200 | -300 | -400 | -300 |
| Dependant | -1,000 | -2,000 | -2,000 | -2,000 | |
| Care and Senior Care Workers | Main | -5,000 | -7,000 | -7,000 | -7,000 |
| Dependant | N/A | N/A | N/A | N/A |
In Country
| Cohort | Main Applicant / Dependant | 2025/26* | 2026/27 | 2027/28 | 2028/29 Onwards |
|---|---|---|---|---|---|
| Skilled Worker | Main | -7,000 | -11,000 | -11,000 | -11,000 |
| Dependant | -2,000 | -4,000 | -4,000 | -4,000 | |
| Health & Care | Main | -2,000 | -3,000 | -4,000 | -4,000 |
| Dependant | -1,000 | -1,000 | -2,000 | -2,000 | |
| Care and Senior Care Workers | Main | 3,000 | 5,000 | 7,000 | -12,000** |
| Dependant | N/A | N/A | N/A | N/A |
Source: Internal Home Office analysis
Note: estimates in 2028/29 are flatlined over the remainder of the appraisal period, so for brevity the table presents annual application estimates up until this year. ** As the policy on in-country care workers also commences part-way through 2028/29, this is only a part-year figure. The full annual figure for 2029/30 and beyond is 21,000.
Care and Senior Care Worker volumes have been removed from the Health & Care volumes. Out of country estimates of volumes affected do not match the illustrative estimates set out in the Technical Annex to the white paper this reflects more recent data and grant rates, and a wider set of exempt occupations modelled.
35. To assess the impact on the stock of people who are no longer in the country, as well as the impact on net migration, further analysis needs to be undertaken to estimate what the outflow profile would have been of those who are no longer able to come.
36. Table E.8 below uses internal analysis of Home Office Migrant Journey data to estimate the outflow profile of those who have come on the Skilled Worker route based on 2014-2019 arrivals. As the Health and Care route, and access for Care Workers specifically have been open for fewer than five years, the outflow profile of Skilled Workers is used for all routes in this IA. This is a limitation and may over or underestimate the rate at which those on the Health and Care route may choose to remain in the UK longer term.
Table E8. Outflow profile of Skilled Worker visas based on 2014- 2019 arrivals, Main applicants and dependants.
| Months | 0 | 12 | 24 | 36 | 48 | 60 | 72 | 84 | 96 | 108 | 120 |
|---|---|---|---|---|---|---|---|---|---|---|---|
| Skilled Worker Leave Rate | 0% | 0% | 5.7% | 8.7% | 3.4% | 7.3% | 0.9% | 0.4% | 0.3% | 0.2% | 0.2% |
Source: Internal analysis of Home Office Migrant Journey
Note: Those who remain in the UK beyond 120 months are assumed to remain indefinitely
37. Tables E.9 and E.10 use this outflow profile to set out the resultant change in the stock of migrants who are no longer in the UK and the net migration impact of these policies respectively. Estimates of the high and low stock and net migration impacts are set out in Annex A.
38. Table E.9 reflects the cumulative number of people who are assumed not to be present in the UK by year. For example, in year one, this impact is equivalent to the flow of people who are restricted from coming. By year 5, this represents the sum of all of the people who were restricted from coming but removing any who would have otherwise already left the UK had they been able to come. This is used to estimate the fiscal impact of people not working and consuming public services in the UK
Table E9. Stock of people not in the UK as a result of the policy restrictions, financial year, thousands, main applicants and dependants.
| Cohort | Main / Dependant | 2025/26 | 2026/27 | 2027/28 | 2028/29 | 2029/30 |
|---|---|---|---|---|---|---|
| Skilled Worker | Main | -14 | -35 | -55 | -73 | -91 |
| Dependant | -8 | -20 | -31 | -42 | -52 | |
| Health and Care | Main | -2 | -5 | -10 | -13 | -16 |
| Dependant | -2 | -5 | -8 | -11 | -14 | |
| Care and Senior Care Workers | Main | -2 | -4 | -4 | -22 | -50 |
| Dependant | N/A | N/A | N/A | N/A | N/A |
Source: Internal Home Office analysis. Stock not set out for the final part-year of the appraisal period as not comparable to previous years, but is included in NPSV calculations
39. Table E.10 reflects the net flow of people into and out of the UK. Unlike E.9 only the restricted inflows in that year are considered, and any people who would otherwise have left from any previous year are removed. For example, in year one, this impact is also equivalent to the flow of people who are restricted from coming. However, by year 5 this represents only the flow of people in year 5 restricted from coming but removing any people from previous years who choose to leave in year 5 (for example those restricted from coming in year 3 but would otherwise have left two years later). This is used to estimate the net migration impact.
Table E10. Net Migration impact as a result of the policy restrictions, financial year, thousands, main applicants and dependants. Note this table is in three parts, with total impacts in the final part.
Table E10.1 - Impact of out-of-country migrants
Change in inflows onto skilled worker routes
| Out of Country | Main / Dependant | 2025/26 | 2026/27 | 2027/28 | 2028/29 | 2029/30 |
|---|---|---|---|---|---|---|
| Skilled Worker | Main | -7 | -10 | -10 | -10 | -10 |
| Dependant | -6 | -8 | -9 | -8 | -8 | |
| Health and Care | Main | 0 | 0 | 0 | 0 | 0 |
| Dependant | -1 | -2 | -2 | -2 | -2 | |
| Care and Senior Care Workers | Main | -5 | -7 | -7 | -7 | -7 |
| Total | -19 | -27 | -28 | -27 | -27 |
Change in outflows from those who would have been on skilled worker routes
| Out of Country | Main / Dependant | 2025/26 | 2026/27 | 2027/28 | 2028/29 | 2029/30 |
|---|---|---|---|---|---|---|
| Skilled Worker | Main | 0 | 0 | 0 | -2 | -3 |
| Dependant | 0 | 0 | 0 | -1 | -3 | |
| Health and Care | Main | 0 | 0 | 0 | 0 | 0 |
| Dependant | 0 | 0 | 0 | 0 | -1 | |
| Care and Senior Care Workers | Main | 0 | 0 | 0 | -1 | -2 |
| Total | 0 | 0 | -1 | -4 | -9 | |
| Net migration | ||||||
| Total | -19 | -27 | -27 | -23 | -19 |
Table E10.2 - Impact on in-country migrants
Change in inflows onto skilled worker routes
| In Country | Main / Dependant | 2025/26 | 2026/27 | 2027/28 | 2028/29 | 2029/30 |
|---|---|---|---|---|---|---|
| Skilled Worker | Main | -7 | -11 | -11 | -11 | -11 |
| Dependant | -2 | -4 | -4 | -4 | -4 | |
| Health and Care | Main | -2 | -3 | -4 | -4 | -3 |
| Dependant | -1 | -1 | -2 | -2 | -2 | |
| Care and Senior Care Workers | Main | 3 | 5 | 7 | -12 | -21 |
| Total | -9 | -14 | -14 | -33 | -41 |
Change in outflows from those who would have been on skilled worker routes
| In Country | Main / Dependant | 2025/26 | 2026/27 | 2027/28 | 2028/29 | 2029/30 |
|---|---|---|---|---|---|---|
| Skilled Worker | Main | 0 | 0 | 0 | -2 | -4 |
| Dependant | 0 | 0 | 0 | -1 | -1 | |
| Health and Care | Main | 0 | 0 | 0 | 0 | -1 |
| Dependant | 0 | 0 | 0 | 0 | 0 | |
| Care and Senior Care Workers | Main | 0 | 0 | 0 | 1 | 2 |
| Total | 0 | 0 | 0 | -2 | -4 | |
| Net migration | ||||||
| Total | -9 | -14 | -14 | -31 | -37 |
Table E10.3 - Total combined impact (out-of-country and in-country)
Net migration impact
| Total | Main / Dependant | 2025/26 | 2026/27 | 2027/28 | 2028/29 | 2029/30 |
|---|---|---|---|---|---|---|
| Skilled Worker | Main | -14 | -21 | -20 | -18 | -14 |
| Dependant | -8 | -12 | -13 | -10 | -8 | |
| Health and Care | Main | -2 | -3 | -4 | -4 | -2 |
| Dependant | -2 | -3 | -4 | -4 | -3 | |
| Care and Senior Care Workers | Main | -2 | -2 | 0 | -19 | -27 |
| Total | -27 | -40 | -40 | -53 | -54 |
Source: Internal Home Office analysis
*2035/36 reports on a partial year, covering 1st April 2035 to 22nd July 2035
40. Table E.10.3 shows that the overall net migration impact of this package of policies is around -40,000 in 2027/28, rising to -54,000 in 2029/30 after restrictions on in-country care workers are introduced during the 2028/29 appraisal year. The equivalent net migration impact tables for the high and low scenarios are set out in Annex A.
Place-Based Analysis
41. The policies appraised in this Impact Assessment (IA) have no specific geographical dimension however the following analysis considers the potential place-based impacts of the proposals.
42. Home Office administrative data provides information on the region of the sponsor of those on the Skilled Worker route. Whilst this may not align to the migrant’s location in all cases, for example if a sponsor may operate multiple work locations around the UK, it provides an insight into the potential geographical implications of the policies.
43. Looking at this data for the period October 2024 to March 2025, the proportion of migrant workers assigned to sponsors in each region is multiplied by the estimated reduction in annual out of country applications in the central scenario in Table E7 to provide an estimate of the annual reduction in migrant workers by region. This is compared to ONS data on the stock of employees by region in January to March 2025 to discern the extent to which each UK nation and region may be impacted by the policies.
44. Table E11 sets out this place-based analysis. This place-based analysis suggests that for the Skilled Worker route, around half of all workers were employed by an employer based in London and the South East, with under 15 per cent based outside of England. While those on the Health and Care route were more evenly distributed across England, with concentrations in the North West and the West Midlands, there was a similar under 15 per cent based outside of England.
45. When considering the impact of the policies as a share of the stock of employees in each region, the most significantly affected area was London at 0.11 per cent with the remaining nations and regions of the UK at a similar level of between 0.02 per cent and 0.07 per cent. Even when considering the combined impact of the policy proposals on inflows over the 5-year appraisal period, this would not represent 1 per cent of total employment in London, and below this level across the rest of the country.
46. As with the rest of this IA, this reflects the first order reduction in employment of migrant workers. If, alongside the wider policy proposals in the Plan for Growth, this helps to push more UK workers into employment to fill vacancies by incentivising training and investment, the reduction in employment in each nation and region could be significantly smaller.
Table E11. Regional employment distribution of those affected by policy restrictions, 2026/27, main applicants out of country and total employment in that region, January to March 2025
Proportion of total migrant workers, by location of sponsor (October 2024 - March 2025)
| North East | North West | Yorkshire and The Humber | East Midlands | West Midlands | East | London | South East | South West | Wales | Scotland | Northern Ireland | |
|---|---|---|---|---|---|---|---|---|---|---|---|---|
| Skilled Worker | 2% | 8% | 5% | 3% | 8% | 7% | 41% | 10% | 5% | 3% | 7% | 3% |
| Health and Care | 1% | 10% | 5% | 5% | 11% | 10% | 14% | 17% | 15% | 5% | 7% | 1% |
| Care and Senior Care Workers | 1% | 7% | 6% | 4% | 9% | 11% | 17% | 16% | 15% | 4% | 5% | 5% |
| Total | 1% | 8% | 6% | 3% | 8% | 9% | 31% | 12% | 9% | 4% | 6% | 4% |
Estimated annual reduction in out of country migrant workers (2026/27)
| North East | North West | Yorkshire and The Humber | East Midlands | West Midlands | East | London | South East | South West | Wales | Scotland | Northern Ireland | |
|---|---|---|---|---|---|---|---|---|---|---|---|---|
| Skilled Worker | -200 | -800 | -500 | -700 | -800 | -700 | -4,000 | -1,000 | -500 | -300 | -700 | -300 |
| Health and Care | - | - | - | - | - | - | - | - | - | - | - | - |
| Care and Senior Care Workers | -100 | -500 | -400 | -800 | -600 | -800 | -1,200 | -1,100 | -1,000 | -300 | -300 | -300 |
| Total | -200 | -1,300 | -1000 | -500 | -1,400 | -1,400 | -5,200 | -2,100 | -1,500 | -600 | -1,000 | -600 |
Stock of workers, ‘000s (January to March 2025)
| North East | North West | Yorkshire and The Humber | East Midlands | West Midlands | East | London | South East | South West | Wales | Scotland | Northern Ireland | |
|---|---|---|---|---|---|---|---|---|---|---|---|---|
| Total | 1,193 | 3,694 | 2,661 | 2,455 | 2,891 | 3,317 | 4,831 | 4,894 | 3,017 | 1,464 | 2,662 | 897 |
Reduction in annual inflows as a proportion of workforce
| North East | North West | Yorkshire and The Humber | East Midlands | West Midlands | East | London | South East | South West | Wales | Scotland | Northern Ireland | |
|---|---|---|---|---|---|---|---|---|---|---|---|---|
| Total | -0.02% | -0.04% | -0.04% | -0.02% | -0.05% | -0.04% | -0.11% | -0.04% | -0.05% | -0.04% | -0.04% | -0.07% |
Source: Internal Home Office analysis
Sectoral Analysis
47. As these policy changes directly affect specific occupations, they will in turn have different impacts on individual sectors. Sectors with a greater volume of RQF 3 to 5 occupations which are not on the TSL will have a larger impact than those with a higher volume of RQF 6+ occupations. This section considers the potential sectoral impacts following the closure of the eligibility of RQF 3 to 5 roles on the ISL, after December 2026.
48. For the changes to the Health and Care route, including Care and Senior Care workers, affected RQF 3 to 5 occupations are almost exclusively (over 95%) in the Human Health and Social Work sector (like the sector as a whole). Applying this proportion to the 2027/28 volumes in Table E7 suggests an impact on this sector of around 11,700. However, for Skilled Workers, visas issued are more distributed across sectors, including for those affected by the largest policy change to restrict RQF 3 to 5 occupations.
49. Figure E1, below sets out the estimated volume of visas issued by skill level and by sector, for visas issued on the Skilled Worker route (excluding Health and Care). It multiplies the 2027/28 volumes in E7 by the sectoral distribution of granted visas between October 2024 and March 2025. Specifically, it shows that the majority of RQF 3 to 5 occupations not on the TSL are in the Accommodation and Food Services (30%), and Wholesale and Retail Trade (20%), and Other Service Activities (12%) sectors.
Figure E1. Estimated Skilled Worker sectoral employment distribution by skill level, 2027/28, main applicants

Source: Home Office internal analysis
50. Figure E2 presents similar information, showing the estimated share of inflows, rather than the absolute level, in each sector by skill level. This chart captures the relative use of lower skilled visas in each sector, but does not capture the magnitude of this use, as set out in Figure E1.
51. Figure E2 shows that while Accommodation and Food services is large as a share of all RQF 3 to 5 occupations (30% as above), RQF 3 to 5 occupations not on the TSL represent the vast majority of all visas issued in that sector (90%). Other sectors with a high use of RQF 3 to 5 occupations include Agriculture Forestry and Fishing (80%, although absolute numbers are low at 520 estimated in 2027/28) and Wholesale and Retail Trade (66%).
52. The figure also shows the relative impact of the TSL on each sector, with the TSL keeping RQF 3 to 5 occupations eligible particularly in the Construction (45%) and Activities of Households as Employers sectors (38%). However, this remains an initial TSL and the MAC will subsequently review the occupations in the list.
Figure E2. Estimated Skilled Worker sectoral employment share by skill level, 2027/28, Main Applicants
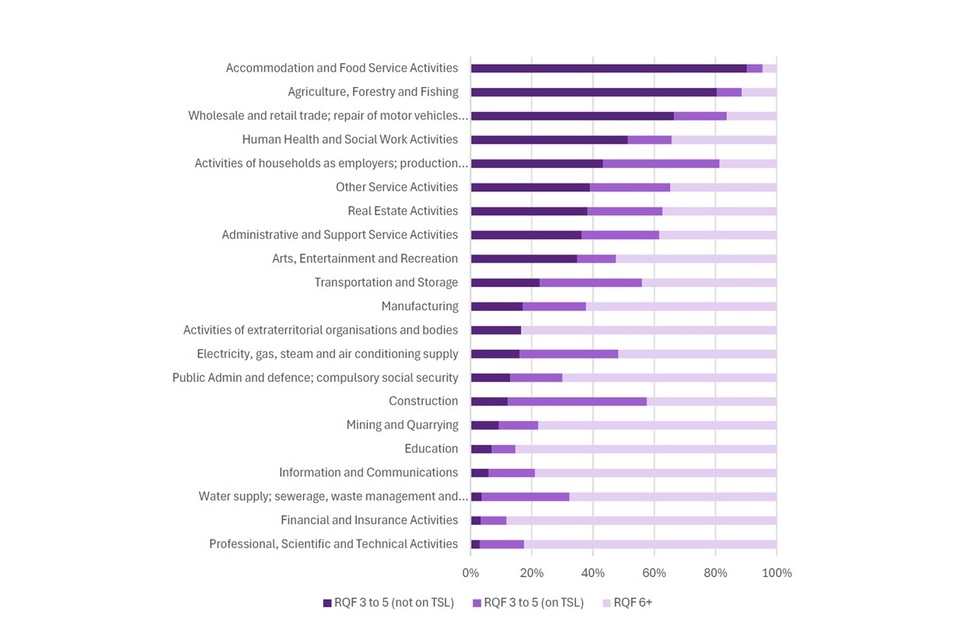
Source: Home Office internal analysis
53. These charts do not capture the movement of applicants who would have previously joined the route in a now-ineligible RQF 3 to 5 occupation to RQF 3 to 5 roles that remain eligible. Figure E3 shows the estimated movement of these individuals in 2027/28. The largest volume of workers that change sectors are estimated to move from the Human Health and Social Work Activities and Accommodation and Food Services sectors, with these workers primarily moving to occupations in the Human Health and Social Work Activities and Financial and Insurance Activities sectors.
54. The change in sectors is largely driven by movement into Care worker, Financial administrative and Pensions and insurance clerks and assistant occupations. Further occupations estimated to experience a relatively high influx of individuals include Authors, writers and translators and Advertising and marketing associate professionals. These occupations fall within industries identified in the UK’s Modern Industrial Strategy, through which the government is supporting key sectors including Financial Services and Creative Industries. It is important to note that the estimated movement into Care worker occupations ends with the 2028/29 in-country restrictions, after which the estimated net movement for the Human Health and Social Work activities sector is negative.
Figure E3. Estimated displacement of Skilled Worker and Health and Care workers across sectors, 2027/28
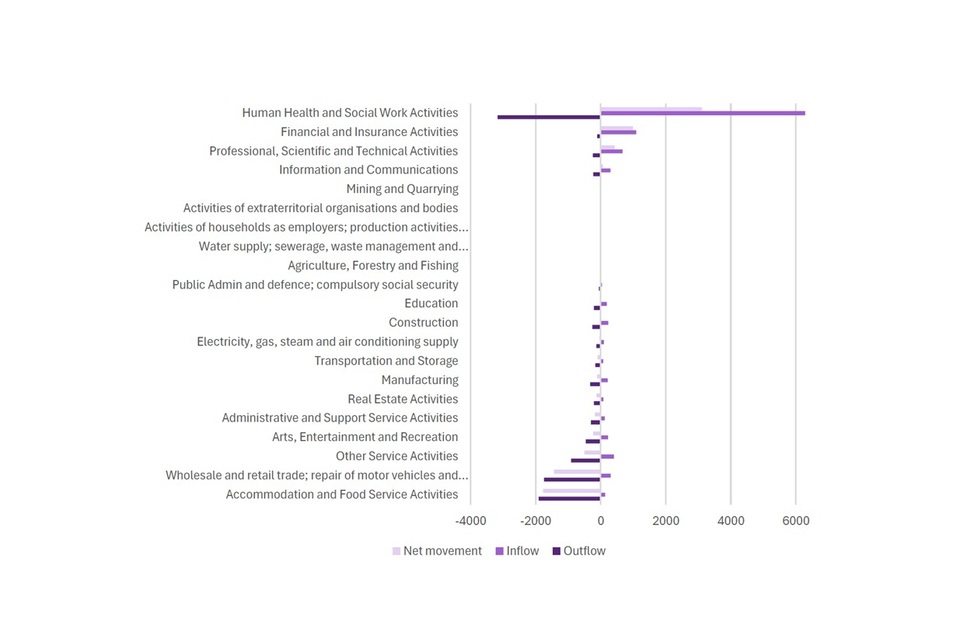
Source: Home Office internal analysis
55. The relative impact of these flows to each sector will be influenced by sector size. Whilst the number of visas restricted in the Human Health and Social Work sector, for example, may be large, this sector is the largest employer in the UK at almost 5 million people in January to March 2025. Conversely, the number of visas affected in the Agriculture, Forestry and Fishing sector on the Skilled Worker route may be relatively small however UK employment in this sector is also smaller, at around 275,000 people.
56. What these charts do not capture is the relative importance of these inflows to each sector. While the number of visas restricted in the Human Health and Social Work sector, for example, may be large across the Health and Care route, the sector is the largest employer in the UK at almost 5 million people in January to March 2025. Conversely the number of visas affected in the Agriculture, Forestry and Fishing sector on the Skilled Worker route may be small, the sector is the smallest employer at around 275,000 people.
57. Figure E4 multiplies the share of RQF 3 to 5 occupations not on the TSL between October 2024 and March 2025 by sector in 2027/28 (Table E7) to estimate the sectoral distribution of the impacts in that year. These estimates are then taken as a proportion of total employment between January and March 2025 in the UK in that sector. Figure E4 includes the volumes on the Skilled Worker route in Figure E1 as well as volumes on the Health and Care route.
58. The figure shows that by this metric, Accommodation and Food Services remains the largest sector impacted by these restrictions at around 0.27 per cent of total employment. Whilst the sectoral impact is largest in volume terms on the Human Health and Social Work sector (just over 10,000 in 2027/28 compared to just under 5,000 for Accommodation and Food Services), because of the size of the overall workforce in the Human Health and Social Work sector, the impact as a share of the sector is smaller, at around 0.21 per cent.
Figure E4. Estimated Skilled Worker and Health and Care sectoral employment for impacted volumes in Table E9, 2027/28, Main Applicants, as compared to total employment in that sector, January to March 2025
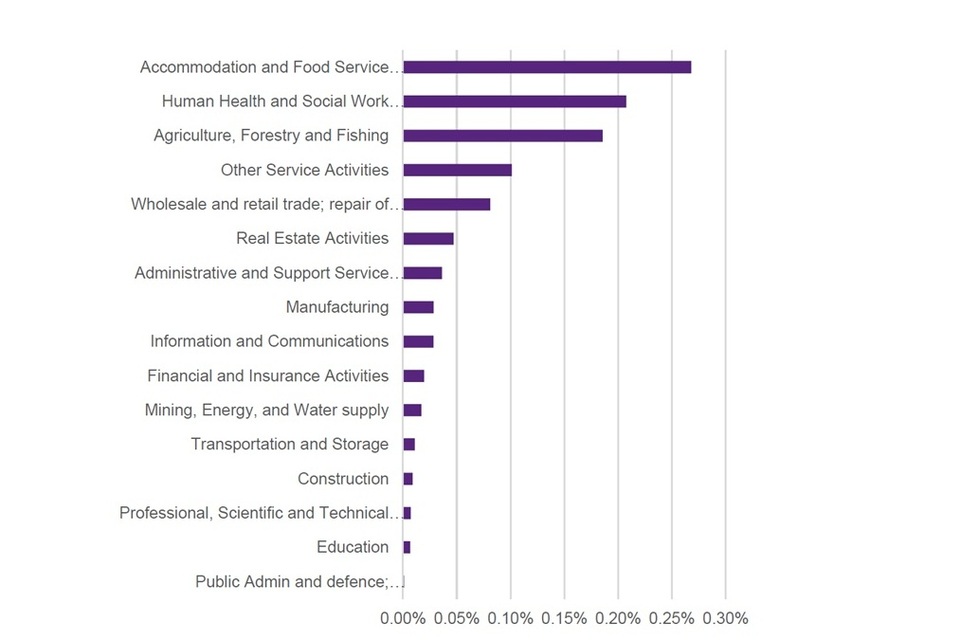
59. Despite estimated volume impacts being small in the context of the whole Human Health and Social Care sector, the impact of the restrictions will again be larger beyond 2028/29 when in-country care workers are restricted. These restrictions represent a more significant impact on the Adult Social Care sub-sector. Additional context on this sector has been provided in the Adult Social Care (ASC) sector section below.
Adult Social Care (ASC) sector [footnote 26]
60. As set out in Table E2, approximately 7,000 entry clearance visas are estimated to be issued to care and senior care workers in each year of the appraisal period. A further 58,000 visas are estimated to be issued each year to Health and Care visa holders working in these occupations already present in the UK, extending their permission to stay and on other immigration routes switching onto a Health and Care visa (to note- in-country figures in Table E2 capture only those switching onto the visa, not extending). These visa estimates represent a substantial drop from previous levels, with more than 105,000 visas granted to care and senior care workers in 2023. This reduction is likely associated with more scrutiny applied by the Home Office to employers in the social care sector, and compliance activity taken against employers of migrant workers, as well as the recent policy measures affecting care workers introduced in Spring 2024.
61. For a transition period until 2028, in-country switching to Health and Care will be permitted, so the changes will affect only overseas recruitment in the short term. In line with the methodology set out above, the IA models replacement effects where some workers no longer assumed to be in eligible occupations might choose to work in care. When accounting for replacement effects, the analysis estimates an annual reduction in care and senior care workers in the sector of approximately 2,000 in 2025/2026 and 2026/27, with replacement effects assumed to entirely offset the reduction in entry clearance visas in 2027/28. As set out above, the modelling of replacement effects is subject to a high degree of uncertainty, which includes the extent of skills substitutability, propensity to remain in the UK, sufficient full time vacancies and ability to work in care, in the context of recruitment challenges the sector is facing (although any recruitment challenges would likely apply to both the cohort of new overseas workers and those switching into these occupations within the UK).
62. In addition, more scrutiny applied to employers in the social care sector and compliance activity taken against employers of migrant workers has seen many affected by sponsorship revocation, many of whom are ready to rejoin the workforce. As of April 2025, approximately 43,000 workers have been impacted by sponsorship revocation. Of these, a significant proportion have switched sponsors or otherwise regularised their stay. There remains a pool of approximately 16,000 displaced workers without employment. The overall impact of the reduction in entry clearance visas is expected to be further reduced by the availability of workers in the redeployment pool.
63. In country switching will no longer be permitted after the end of the transition period. Between October 2024 and March 2025, an estimated 64 per cent of in-country grants to care workers and senior care workers were to main applicants previously on a Health and Care visa. The remaining 36 per cent, equating to approximately 21,000 in-country grants, were issued to visas holders on other immigration routes and might therefore represent ‘additional’ workers into the sector. This is likely to represent an upper estimate of additional joiners to the sector given some of those switching from other immigration products might have previously been working in care. Combined with the number of entry clearance visas issued in these occupations suggests an estimated reduction in approximately 28,000 new joiners in the sector, when the transition period for in-country switching eventually ends. This equates to a four per cent reduction in the count of full-time equivalents in the sector each year in the medium-term though the impact is larger if considered cumulatively over the full appraisal period of this IA.[footnote 27]
64. Previous measures taken, including increased scrutiny to employers in the social care sector, compliance activity taken against employers of migrant workers and the recent policy measures to reduce levels of net migration are likely associated with a substantial reduction in entry clearance visas issued. Despite this, current data shows that the ASC workforce continued to grow, from 1,615,000 filled posts in 2021/22 to 1,705,000 filled posts in 2023/24. This is despite a decrease in the proportion of the workforce with a British nationality, which decreased from 83 per cent in 2021/22 to 73 per cent in 2023/24. These trends suggest that the decrease in entry clearance visas could be associated, at least in the short term, with a less than one-to-one reduction in the overall workforce size.
65. Workforce shortages in the ASC sector can be due to poor pay and terms and conditions leading to low domestic recruitment. Similarly, engagement with the ASC sector suggests that whilst some migrant workers would be willing to take-up jobs in the sector, limited vacances exist that meet salary requirements and where there are a guaranteed number of hours worked.
66. In England, there are a number of policies which have been put in place to boost recruitment and retention of adult social care workers which will take effect by the end of the transition period and in turn may reduce dependence on migrant workers. The government has set out its commitment to a well-supported workforce who are recognised as the professionals they are. This includes the development and expansion of the Care Workforce Pathway – the first universal career structure for the adult social care workforce. The Pathway aims to provide clear progression and development for professionals in the adult social care sector by outlining the necessary knowledge, skills, values and behaviours they need to practice safely and effectively. It sets out how people can develop and progress across a long-term career, covering practice-based routes to progression, as well as traditional management roles; with support and training; attracting people to join and remain in the sector and support sustainable workforce growth.
67. Those with the opportunity to develop and progress in their role are far more likely to join or remain within the adult social care workforce. For 2023/24 the average turnover rate was 7.4 percentage points lower amongst care workers who had received some form of training (28.0%), compared to those who had not (35.4%).[footnote 28]
68. To support the implementation of the Pathway and promote professional development DHSC is providing up to £12 million this financial year through the Learning and Development Support Scheme. Eligible employers can claim funding towards certain training courses and qualifications so their staff can develop new skills and specialisms, this includes the new Level 2 Adult Social Care Certificate, which was developed and launched by DHSC in 2024.
69. To ensure the training courses and qualifications funded by the scheme meet the needs of the adult social care sector DHSC launched the Quality Assured Care Learning Service. This service will enable adult social care providers to easily identify high-quality learning and development opportunities.
70. DHSC are also developing a Digital Care Workforce Pathway (DCWP) to support frontline care workers and their managers to fully understand and apply the values, knowledge, skills, values and behaviours required across the different roles in adult social care. This will include a suite of tools to help understand staff skills levels and plan for their training and development.
71. This will further support the implementation of the Pathway and will be linked to the Skills Record, this and the DCWP will be developed together. This will provide a permanent and verifiable record of skills and achievements, supporting those working in adult social care to increase ownership of their training, skills and qualifications via a new digital platform. This new digital service will allow records to be shared with new or potential employers, which should help to reduce unnecessary duplication of training and make onboarding faster, acknowledging previously gained knowledge and skills to further professionalise and raise the profile of adult social care as a career, promoting recruitment, retention, professional development and career progression.
72. The first ever Fair Pay Agreement is being introduced to the Adult Social Care sector so that care professionals are recognised and rewarded for the important work that they do. Fair Pay Agreements will empower worker representatives, employers and others to negotiate pay and terms and conditions in a responsible manner, helping to address the recruitment and retention crisis in the sector. The Fair Pay Agreement will be brought in to make care jobs more attractive to domestic workers, and to move away from the dependence on overseas workers to fulfil care needs.
73. While the Fair Pay Agreement applies to England specifically, Wales have published a Social Care delivery plan through to 2027 which includes actions to support domestic recruitment and retention,[footnote 29] and Scotland published a national workforce strategy for the Health and Social Care sector through to the medium and long-term including on recruitment and retention in Adult Social Care.[footnote 30]
74. As such, whilst the number of Health and Care visa holders working in the sector are likely to fall, there are likely to be replacement effects, where UK nationals – or migrant workers with unrestricted rights to work in the UK – might take up jobs.
75. In summary, the impacts of the IWP rules changes on ASC workforce capacity are unclear at this stage but given replacement effects and the availability of workers in the redeployment pool,[footnote 31] the overall impact from the reduction in entry clearance visas on the sector is likely be minimal. Annual out-of-country visa grants for “Caring Personal Services” have also already fallen over 90 per cent from their peak of 108,000 in 2023, and as a result, the impact will be acting on a small base. The reduction in in-country grants equates to a less than five per cent reduction in the count of full-time equivalents in the sector. Importantly, these changes will take effect at the end of the transition period, when a range of policies aimed at improving pay and working conditions in the sector are due to be implemented. If effective, these measures could help offset migrant shortfalls by strengthening domestic recruitment and retention.
Economic Impact Assumptions
Home Office Fees and Charges
76. Visa fees are compulsory charges to individuals intending to come to the UK and businesses which sponsor migrants. They are reviewed and amended by the Home Office on a regular basis and, for this IA. The fees reviewed are:
- a. Visa fees. These are paid by applicants and vary by visa length, location of application (overseas or in-country), visa type, eligibility as a shortage list occupation and arrangements for expediting the processing of applications. For the purposes of this IA, they are assumed to remain at the level of the costs as of 01/05/2025 over the appraisal period.[footnote 32]
- b. The Immigration Health Surcharge (IHS). This is a direct contribution to the NHS paid by migrants (main applicants and their dependents) who make an immigration application to come to the UK for more than six months or who apply to extend their stay in the UK. The amount is dependent on the length of visa. For those on the Skilled Worker route, the yearly cost is £1,035 and the half yearly cost is £517.50 (and are assumed to remain at this level over the appraisal period). The average length of a Skilled Worker visas is three years. Those on the Health and Care visa route do not need to pay the surcharge.[footnote 33]
- c. The Immigration Skills Charge (ISC). This is paid by businesses each time they sponsor a migrant and assign a Certificate of Sponsorship. The amount is dependent on their organisation size, charitable status and length of sponsorship (in six month increments). The cost for small or charitable sponsors for the first 12 months is £364 and £182 for each additional six months thereafter, and the cost for medium or large sponsors is £1,000 and £500 for each additional six months thereafter (and are assumed to remain at this level over the appraisal period). The average length of a Skilled Worker visas is three years, and a Health and Care visa is 3.5 years. It is not applicable to dependants and certain occupations are exempt from the ISC alongside those who switch from the study route.[footnote 34]
77. Visa fee revenue is also affected by shares applying for priority or super priority services. These applicants pay an additional £500 per application for priority service or an additional £1,000 per application for super priority service to receive quicker decisions on visa applications. For example, for Skilled Worker main applicants, internal management information suggests 36 per cent of applicants apply for a priority service while 3 per cent apply for a super priority service. These figures are considerably lower (15 per cent and 1 per cent respectively) for dependants.
78. A reduction in the volume of those on the Skilled Worker route may reduce the visa fee processing costs incurred by the Home Office. Estimated visa fee unit costs vary by visa length, location of application (overseas or in-country), visa type, eligibility as a shortage list occupation and arrangements for expediting the processing of applications. For the purposes of this IA, they are assumed to remain at the level of the costs as of 01/05/2025 over the appraisal period.[footnote 35]
79. ISC and IHS fee revenue additionally incur a processing cost, which is paid by the Home Office through a third party retaining a percentage of the revenue collected. A reduction in the volumes of applications will again reduce processing requirements. Internal estimates suggest 2.09 per cent of ISC revenue, 2.14 per cent of IHS revenue if overseas, and 1.01 per cent of IHS revenue if in country is representative of the revenue retained by the third party.
Fiscal Methodology and Assumptions
80. The fiscal impact of immigration represents a balance between the tax income changes of migrants and the public services pressure they carry through their use of services like healthcare. This balance tends to vary across different migrant cohorts, influenced by factors such as employment rate, income level, age, and their propensity to use different types of public services. Impact assessments are intended to measure the impact on public welfare and are not an official government macroeconomic/fiscal forecast. The fiscal analysis in this IA also does not reflect the methodology used by the OBR, the government’s official economic and fiscal forecaster, to assess the impact of migration on the overall fiscal position of the UK.
Tax income changes
81. Tax income changes refer to the tax income that governments receive, including both direct and indirect taxes. In the context of migration, tax income changes capture the financial contributions made by migrants through their economic activity in the UK. A reduction in the volumes of visa holders residing in the UK is considered to result in lower contributions through decreased direct and indirect tax revenues. Accordingly, tax income changes are modelled based on estimated changes in volumes of those in employment in the UK and the associated tax revenue from their earnings. For non-working dependants, indirect tax contributions are assumed to be derived from the earnings of the main applicants and are therefore not estimated separately.
82. Sensitivity analysis is performed in economic appraisal and modelling to explore the sensitivity of expected outcomes to potential variations in key input variables. This approach has been adopted to try and present the uncertainty around the fiscal impact of migrants. The potential fiscal impact of migrants has a range of plausible values and the inclusion (or exclusion) of certain revenue and spend components is one aspect that can help demonstrate this uncertainty. In the low scenario, the components considered for tax income changes are Income Tax, National Insurance, Indirect Tax, Council Tax, and Corporation Tax. The central scenario additionally considers Businesses rates for revenue. The High scenario further considers Gross Operating surplus and other taxes for revenue, and Pure public goods for pressure.
83. To estimate these components for main applicants on the Sponsored Work routes, this IA uses projected earnings distributions for migrants and assumes that all main applicants are employed. In 2025/26 prices, the median salary of the restricted cohort is:
- Skilled Worker: £38,700
- Health and Care: £24,000
- Care and Senior Care Workers: £23,500
84. Further analysis is undertaken to assess what proportion of the remaining cohort of applicants would require their employer to raise their salaries to remain eligible to come to the UK or extend their visas. Internal analysis suggests 37% of Skilled Workers and 31% of Health and Care visa holders have salaries below the higher salary threshold and require an average increase in salary of £2,347 and £1,297 respectively to meet it.
85. Home Office internal management information provides estimates on the age distribution of dependant applicants for 2025 across key visa routes. On the Skilled Worker route, approximately 55 per cent of dependant applicants were aged 18 years or over. For the Health and Care route, the proportion of adult dependants was estimated at 44 per cent.
86. For adult dependants, data from the Skilled Worker evaluation[footnote 36] indicate that the average employment rate is approximately 71 per cent, with average earnings estimated at around £26,000.
87. Based on the proportion of adult dependants and their estimated employment rate, it is therefore estimated that around 25 per cent of dependants on Skilled Work and 20 per cent of dependants on Health and Care visas are in employment.
Public Services Pressure
88. Public services pressure refers to the public spending required to provide services to migrants. To ensure that the high scenario captures the maximum net benefit, while it includes the most components of tax income, it includes the fewest components of public services pressure. This is a departure from previous Home Office IAs where the high scenario considered the largest number of components of both revenue and pressure.
89. In the High scenario, the spending components considered for public services pressure are Health, Education, Personal Social Services, Wider Public services, and Core congestible public goods. The central scenario additionally considers non-Core congestible public goods for pressure, and the Low scenario further considers Pure public goods.
90. Changes in the volume and characteristics of migrants can also influence expenditure on services such as health and education. Demographic variations, such as age distributions, across nationality groups can lead to differences in the cost of delivering public services. For instance, younger populations may increase demand for education, while older or more vulnerable groups may require more healthcare or social assistance. The cost of healthcare is assumed to remain constant across individuals of the same age (group).
91. The scenarios outlined above do not account for welfare expenditure on migrants, as the vast majority of those on visas covered in this IA have ‘No Recourse to Public Funds’ (NRPF) attached to their leave to remain. The conditions effectively restrict their access to direct welfare payments.
92. Whilst most migrants are subject to NRPF during their visa period, they gain full access to welfare benefits upon applying for Indefinite Leave to Remain after at least five years in the UK on an eligible route. This IA covers a 5-year appraisal period and so assumes zero welfare expenditure throughout their stay, excluding welfare payments.
Fiscal Position
93. Under the central scenario, based on the assumptions around tax income changes and public services pressure, the following net balance between the two is estimated for an average individual in the first year of the appraisal period across each cohort affected by this set of policy measures. A positive value indicates a net financial gain for the exchequer from an individual’s presence in the country, while a negative value indicates a net cost.
Table E12: Illustrative Home Office tax income and public services pressure estimates by affected cohort, 2025/26 prices (£).
| Cohort | Main Applicant / Dependant | Tax income | Public Services Pressure | Tax income less public services pressure |
|---|---|---|---|---|
| RQF 3 to 5 Skilled Worker | Main | £23,000 | £6,000 | £16,000 |
| Dependant | £5,000 | £8,000 | -£3,000 | |
| RQF 3 to 5 Health & Care | Main | £15,000 | £6,000 | £9,000 |
| Dependant | £3,000 | £9,000 | -£5,000 | |
| Care and Senior Care Workers | Main | £14,000 | £6,000 | £7,000 |
| Dependant | N/A | N/A | N/A |
Source: Home Office internal analysis Note: Figures may not sum due to rounding
94. As such, it can be assumed that policy changes that restrict the volumes of dependants could have a net positive fiscal impact over the appraisal period, while policies that restrict main applicants could have a net negative fiscal impact.
95. However, this assumes that there is no substitution between migrant workers and the domestic workforce. As noted throughout this IA, one of the strategic objectives of this package of measures is to incentivise the training and upskilling of the domestic workforce to enable domestic workers to fill these jobs.
96. To understand the fiscal consequences of unemployed domestic residents moving into employment an additional net fiscal benefit is estimated. This figure includes the additional tax income from employment (income tax, NICs and others) and an assumed removal of eligibility for welfare payments.
97. Welfare payments can vary significantly between recipients. The mean Universal Credit payment was estimated at £1,000 per month in November 2024, but this varies considerably by characteristic including number of children, disability and whether or not they are a carer.[footnote 37] Further, a UK national moving into employment will not necessarily lose the entirety of their Universal Credit entitlement. As wages go up Universal Credit payments taper down. Typically for each additional £1 an individual earns beyond their work allowance their payments decreases by 55p.
98. For example, moving to the median salary of the affected RQF 3-5 cohort on the Skilled Worker route of £31,500:
- A single unemployed worker over 25 would lose 100% of their monthly £394 standard allowance.[footnote 38]
- A single unemployed worker over 25 with two children would lose 90% of their £1,000 monthly Universal Credit entitlement, equivalent to £900.
- A single unemployed worker over 25 who has two children one of whom receives the higher disabled child rate would lose 60% of their £1,500 monthly Universal Credit payment, equivalent to a £900 reduction.
99. The majority of household types receiving a Universal Credit payment of £800 or lower are estimated to receive zero entitlement at a salary of £31,500. As this is below the mean Universal Credit payment of £1,000, this analysis assumes that £800 is a reasonable upper monthly estimate for the foregone welfare receipt of an individual moving from unemployment or inactivity into work at £31,500. The £394 standard allowance represents a reasonable lower monthly estimate.
100. Using this range, alongside estimates of additional tax income from their salary, an inactive UK national moving into employment at the average salary of between £24,000 and £31,500 is assumed to represent a positive net fiscal benefit of between £13,000 and £22,000 per year, with a central estimate of £17,500.
101. These illustrative figures are estimated to be consistent with the wider methodology in this IA to enable direct comparison. The methodology has not been developed to assess the nuances of UK tax income changes or pressure and as such may not align with other internal or external estimates. It should be treated as highly illustrative for the purposes of sensitivity analysis in this IA only.
Lifetime Fiscal Position
102. The analysis in this IA considers the static contribution of migrants over the 5-year appraisal period. However, according to the 2024 Migrant Journey report, 55 per cent of people in the “Worker” category in 2019 still had valid leave to remain in the UK after five years and 28 per cent had been granted Indefinite Leave to Remain.
103. This means many migrants coming to the UK over the appraisal period are likely to remain in the UK into the long term. As they grow older, people stop earning, draw on the state pension and ‘consume’ a large amount of health and social care, so the value of tax income less use of public services from this cohort turns negative.
104. In September 2024, the OBR estimated the cumulative fiscal impact of a representative migrant coming to the UK at the age of 25.[footnote 39] This analysis was undertaken for an “average-wage” migrant earning the same as the UK average (assumed to be £38,200 using ASHE 2024 data[footnote 40]), a “high-wage” migrant earning 30 per cent more (£49,700) and a “low-wage” earning 50 per cent less (£19,100).
105. Given the median salaries set out in paragraph 78, the majority of Skilled Workers affected by this policy change are likely to be best approximated by the “average wage” migrant, while many in Care and Social Care, as well as some employed adult dependants are best approximated by the “low-wage” migrant category, or below in the case of adults not in employment. The OBR also assess that the fiscal impact of a child dependant is likely to be similar to that of the representative UK person, depending on their age at arrival to the UK.
Figure E5. OBR cumulative fiscal impact of representative migrants
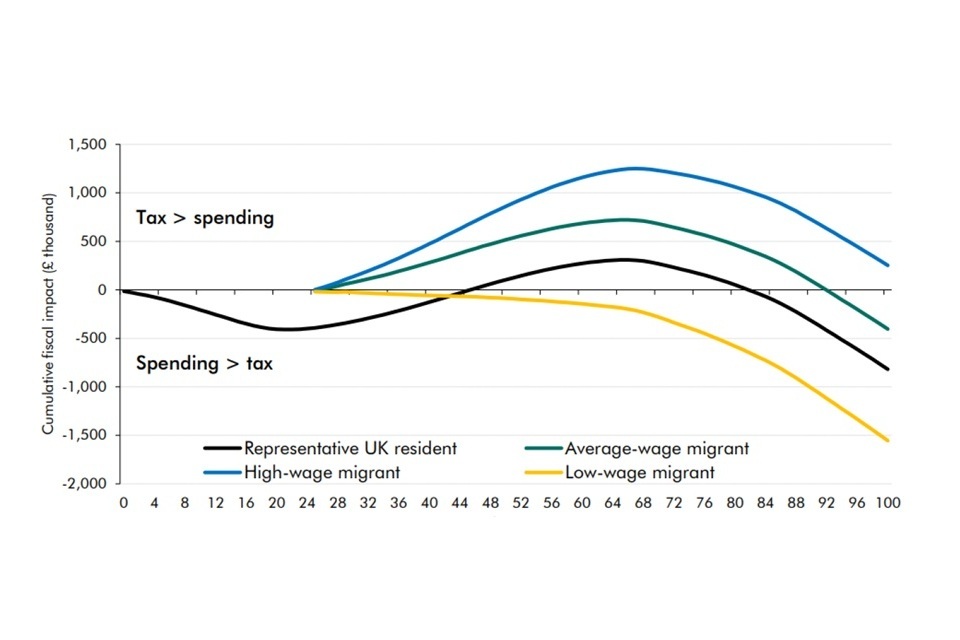
Source: Fiscal risks and sustainability – September 2024 - Office for Budget Responsibility
106. In practice, this means that while this IA will capture a net fiscal loss for many cohorts, this negative impact is likely to fall in the longer term for those that remain in the UK beyond retirement age. While this is likely to reflect a minority, where migrants remain in the UK beyond the age of 90, even some Skilled Workers may have represented a net fiscal cost over their lifetime.
GDP and GDP per Capita
107. GDP and GDP per capita impacts can be considered in stages. The first order impacts – as discussed in this section – illustrate the direct effects associated with the modelled reduction in migrants. Second order impacts capture how the UK economy might react to changes, including incentives created by measures to upskill domestic workers. These underpin the rationale for changes and a discussion on these effects is included in the wider impacts section.
108. The modelled reduction in migrant flows is likely associated with a reduction in GDP, due to the reduction in workers present in the UK economy. In a central estimate, the OBR estimate an annual 200,000 reduction in net migration reduces overall GDP by between 1 per cent and 2.5 per cent in 2028/29. In the context of the modelled annual reduction in net migration of around 70,000 in this IA, this equates to a reduction in GDP of between 0.35 per cent and 0.9 per cent. However, the impact of net migration on GDP per capita better reflect impacts on living standards of the resident population.
109. On the basis of labour income alone, the cohort of affected Skilled Worker visa holders are unlikely to reflect in a boost to per capita GDP. Replicating analysis published by the London School of Economics (LSE) with latest data, a migrant would need to earn a minimum of £22,200 to boost GDP per capita. [footnote 41], [footnote 42] However, if they brought with them one non-working dependant, this figure would increase to £44,400. Skilled Worker visa holders below RQF level 6 earned an average of £38,700 and brought an average of 1.0 dependants and would therefore earn a total income which is less than the threshold of £44,400, assuming their dependants are not in employment. Care and senior care workers earned a median salary of approximately £23,500.
110. The impact on economic growth is wider than changes to labour income, and factors such as productivity spillovers and capital investment can also have a positive impact on per capita GDP. Whilst the MAC acknowledge the significant degree of uncertainty associated with the impact of immigration on productivity, they found some evidence to suggest that high-skilled migrants have a positive, and larger, impact on productivity than lower skilled migrants.[footnote 43] Whilst this is the case, even at relatively lower skill levels, positive spillover effects can arise, particularly in growth-driving sectors. The TSL will be used as a basis for providing continued access to sectors that are key to the industrial strategy and therefore promoting growth.
111. Without adjustment to the capital stock, net migration can result in a fall in living standards. In a scenario where the capital stock does not adjust, the OBR estimate additional net migration of 200,000 could reduce GDP per capita by 0.4 per cent.[footnote 44] While net migration rose to a record high level of 906,000 in year ending June 2023, growth in the UK’s net capital stock in 2023 (1.2%) was well below the pre-2008 average (2.5%) and slightly below the pre-2019 average (1.3%).
112. Overall, evidence suggests that whilst the modelled reduction in migration flows will have a downward impact on GDP, the impact on GDP per capita is likely to be small in scale, and the direction of impact remains uncertain.
Cost Benefit Analysis
Quantified Costs
Set-up Costs
113. Set up costs arise from familiarisation with changes to Immigration Rules. These costs fall to Immigration Lawyers, Immigration Advisors, and where relevant sponsors of workers on relevant visa routes.
114. Costs are assumed to arise from reading changes to Immigration Rules and are limited to transitional costs as the extent of changes are assumed to be marginal for new sponsors / advisors / lawyers familiarising with Immigration Rules given the relatively small change in overall immigration guidance.
115. Home Office IAs have in the past, including in the 2024 Immigration Rules changes[footnote 45], quantified private sector familiarisation costs. In this example where the changes to Rules represented a 16 per cent change in the total volume of words in the sponsored work guidance documents, the overall cost was estimated at around £1.5 million (2024/25 prices) in the central case.
116. Considering the overall magnitude of the changes in this IA, further analysis on this transitional cost in the first year of the appraisal period have not been undertaken and are assumed to be broadly equivalent to the estimates in the 2024 Immigration Rules. As no specific estimate has been quantified, this is not included in the NPSV.
Home Office Fee and Charging Revenue.
117. As set out in the “Home Office Fees and Charges” section, costs from changes in the volumes of migrants applying for, and granted, relevant visas can accrue to the public sector through a reduction in visa fee, CoS fee, IHS and ISC revenue.
118. While these costs accrue to the public sector, CoS fee and ISC fee revenue is assumed to be a transfer from sponsors and so not included in NPSV estimates. These estimates are included in the “Transfers” section of the cost-benefit analysis.
119. Home Office fee revenue, excluding for CoS, is estimated by multiplying the relevant fee set out in the “Home Office Fees and Charges” section by the change in application volumes set out in Table E7. Totalling these impacts estimates a central change in fee revenue of -£0.2 billion across the appraisal period (2025/26 prices) with a range of around -£0.2 billion to -£0.3 billion.
120. IHS revenue is estimated by multiplying the relevant level of IHS by the average length of the visa, both set out in the “Home Office Fees and Charges” section by the change in application volumes set out in Table E7. Totalling these impacts estimates a central change in fee revenue of -£0.4 billion across the appraisal period (2025/26 prices) with a range of around -£0.3 billion to -£0.5 billion.
121. Combined, the change in fee and charging revenue is estimated at -£0.7 billion across the appraisal period (2025/26 prices) with a range of around -£0.5 billion to -£0.8 billion.
Tax income
122. Tax income estimates are affected by two factors impacting in opposite directions. The first is the estimated reduction in tax income resulting from estimated changes in stock of migrants in the UK. The second is an increase in tax income for the volume of migrants estimated to receive a pay increase as a result of the increase in salary thresholds.
123. The reduction in tax income is estimated by considering the tax income that would have been estimated to have accrued across the salary distribution of individuals affected by the policy change (which can be approximated using the average tax income of each cohort set out in the “Fiscal Methodology and Assumptions” section), and multiplying this by the stock of migrants assumed to no longer be in the UK set out in Table E7.
124. The increase in tax income is estimated by considering the additional tax generated as a result of the average 6 per cent increase in salaries for the affected cohorts and multiplying this by the stock of migrants that result from the volumes in Table E6.
125. In a central case, the net impact across both of these channels of impact represents a cost of foregone tax income of -£8.5 billion across the appraisal period (2025/26 prices) with a range of around -£6.1 billion to -£13.0 billion.
Employer Salary Adjustment Costs
126. Sponsors assumed to respond to the increase in salary thresholds may choose to bear an indirect cost of increased costs of employment from raising salaries to meet new thresholds. The volume of employees assumed to receive an average 6 per cent increase in salaries is set out in Table E.6, and this is considered over the length of their time in the UK, using the length of stay profile set out in Table E8.
127. In a central case, the indirect cost to business of choosing to pay these higher salaries is -£0.5 billion across the appraisal period (2025/26 prices) with a range of around -£0.4 billion to -£0.6 billion.
Unquantified Costs
Labour Market Adjustment Costs
128. Businesses who no longer able to recruit RQF 3 to 5 workers, or who choose not to increase salaries for those roles that remain eligible at a higher salary threshold have a number of different behavioural adjustments they could make.
129. The labour market is dynamic and, as with any change in environment, markets are expected to adjust and reallocate resources to their most productive use. How employers choose to adjust, the relative ease and length of time taken to do so will depend on the specific characteristics of an occupation and firms (in particular, whether they are influenced predominately by market forces) as well as wider factors. Adjustment could happen in various ways including:
- Altering the ratio of labour to capital within the firm’s production, such as automating the production line where possible, and substituting capital for labour,
- Freezing recruitment, or substituting for domestic inflows into the workforce
- Changing production levels.
- Changing location of production or outsourcing parts of the production process
130. The ability of an employer to respond through each of these avenues is highly firm-specific. As such these potential indirect adjustment costs are not quantified. For example, if a firm’s production process is more labour-intensive, it may struggle to substitute to capital and would be left with fewer adjustment options, and firm specific factors mean adjustment options may not only vary between location, sector, firm size but within these dimensions too.
131. Wider labour market factors can also influence adjustment options, and in the short-term labour market statistics and commentary highlight tightness in the labour market persisting, although some indicators suggest there may be easing in this tightness. Whilst latest data for between February to April 2025 indicates a relatively tight labour market – with the unemployment rate estimated at 4.6 per cent – the unemployment rate for those aged 16 to 24 years is significantly higher and increased from around 10 per cent in 2021 to approximately 13 per cent in 2024, suggesting a relatively looser labour market. It is this cohort of young people who are more likely to have been employed in lower-skilled jobs which could smooth potential adjustment.
Productivity and Innovation
132. Research has suggested inflows of skilled labour may have positive impacts on productivity and innovation, with the MAC summarising these impacts as “high-skilled immigrants make a positive contribution to the levels of innovation in the receiving country” and “there is a lot of uncertainty about the impact of immigration on productivity, although most studies conclude there is a positive impact”.[footnote 46]
133. The MAC review of evidence also highlights quantification of productivity impacts is an area requiring further research as current methods have not resulted in reliable quantification.
134. Given this, and the fact that most of the migrants restricted from coming to the UK as a result of these policies are towards the lower skilled of Skilled Workers, these impacts are not quantified. Further, assumed impacts may be relatively small given migrants affected would be assumed to make up a small share of the stock of migrants in employment in the UK.
Quantified Benefits
Public Services Pressure
135. Public services pressure reflects the marginal cost that would be incurred as a result of an additional person being in the UK with an age profile of those affected by the policy changes. Spending decisions are made by HM Treasury and an increase in the volume of migrants is not intrinsically linked to a proportionate change in spending as alternative decisions could be taken, for example to absorb this pressure within existing spending limits. However, this estimate reflects the pressure that this cohort would have placed on public services, either reflected in increased spending, or a lowering of the quality of the service provided by absorbing this pressure without increasing spending.
136. The reduction in public services pressure considers the public services pressure that would have been estimated to have accrued across the age distribution of individuals affected by the policy change (which can be approximated using the average public services pressure values for each cohort set out in the “Fiscal Methodology and Assumptions” section), and multiplying this by the stock of migrants assumed to no longer be in the UK set out in Table E7.
137. In a central case, the public services pressure impact represents a saving of £4.1 billion across the appraisal period (2025/26 prices) with a range of around £4.7 billion to £3.5 billion.
Fee and Charge processing costs
138. Direct benefits to the public sector can arise from reductions in processing costs of fewer visa applications. These are quantified by multiplying the unit cost of issuing a visa on the Skilled Worker and Health and Care route set out in the “Home Office Fees and Charges” by the estimated change in inflows in Table E7.
139. As well as processing fewer visa applications, the Home Office incurs a saving from processing fewer IHS and ISC payments. This impact is quantified by multiplying internal Home Office estimates of the cost of processing an IHS and ISC payment set out in the “Home Office Fees and Charges” by the estimated change in inflows in Table E7, accounting for the length of visa issued.
140. Totalling these impacts estimates a central change in processing costs of -£0.10 billion across the appraisal period (2025/26 prices) with a range of around -£0.07 billion to - £0.12 billion.
Unquantified Benefits
Labour Market Benefits – Displacement, Wages and Training
141. The wider rationale for these changes is to incentivise upskilling of the domestic workforce to support growth.
142. These second order effects could be substantial in scale. If reducing migrant inflows has an impact on productivity, this effect would be important and could outweigh many or most others impacts.[footnote 47] Within this context, whilst the quantified elements in this IA reflect a negative NPSV, this could be outweighed by productivity gains in the longer term due to broader incentives created by these measures, as discussed in this section.
143. In 2018, prior to the record levels of net migration, the MAC reviewed evidence on the impact of migrant workers on displacement, wages and training of resident labour.[footnote 48] Their review findings stated:
- Displacement: On average “the majority of studies find no or little impact of immigration on the employment and unemployment outcomes of the UK-born workforce” whilst distributionally “there is evidence of differential impacts across different UK-born groups, with more negative effects for those with lower levels of education and more positive effects for those with higher levels of education. However, as Home Office robustness checks show, these findings are subject to a significant degree of uncertainty”
- Wages: “Immigration is not a major determinant of the wage growth experienced by existing residents. There is some suggestion that the impact on lower skilled groups may be more negative than for higher-skilled groups, but again these estimates are imprecise and subject to uncertainty”.
- Training: “There is no evidence that migration has reduced the training of UK-born workers”
144. However, recent record high levels of net migration have been correlated with an increase in the youth unemployment rate and a decline in investment in training, although this does not on its own imply causality.
145. As shown in Figure E6, the proportion of young people who were Not in Employment, Education or Training (NEET) stood slightly above 10 per cent up until around mid-2022 where it increased to over 12 per cent, reaching above 13 per cent more recently from the third quarter of 2024. The cohort of young people are those who are more likely to have been employed in lower-skilled jobs, with the 2021 Census estimating 96 per cent of 16 to 24 year-olds in employment were working in occupations below RQF 6 level, compared to 73 per cent for the population as a whole.[footnote 49]
146. As shown in Figure E6, the increase in the proportion of young people who were NEET coincided with a sharp increase in the number of skilled worker visas issued to workers in occupations below RQF level 6.
Figure E6: Count of skilled worker visas issued below RQF level 6 and proportion of people aged 16-24 who were Not in Employment, Education or Training (NEET).
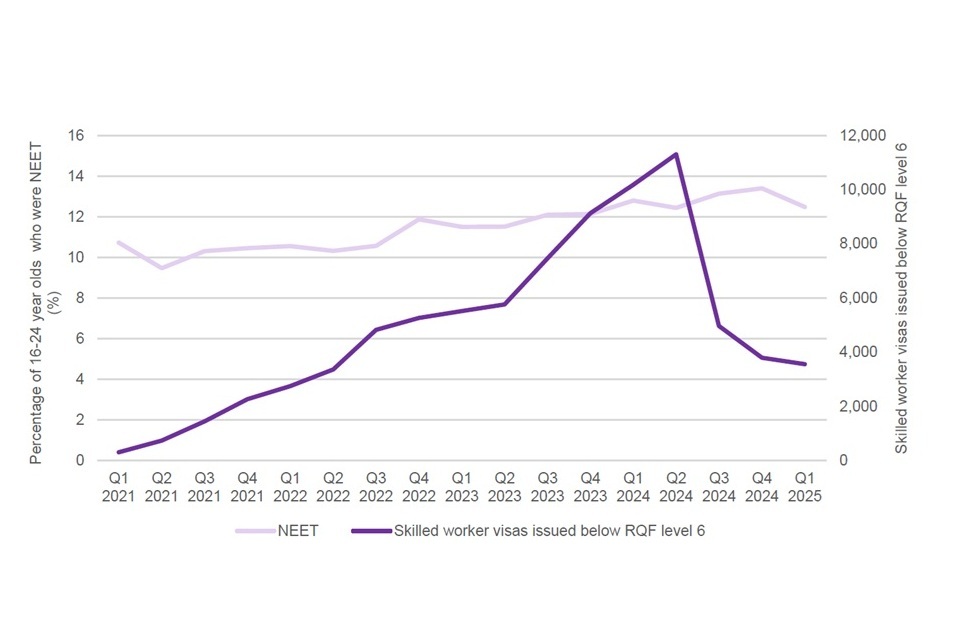
Source: Home Office internal analysis
147. Levels of net migration were approximately 200,000 per year throughout most of the 2010s and have risen to a record high of 906,000 in the year ending June 2023.[footnote 50] Over this time, total investment in training has fallen in real terms from around £2,200 per employee in 2011 to around £1,800 per employee in 2022, while total apprenticeship starts have also fallen from 393,000 in 2018/19 to 340,000 in 2023/24.
148. While there has not been sufficient time for a significant body of evidence to be developed, there is some literature that further explores the link between high net migration and training, with evidence suggesting employers might choose hiring overseas workers as a cost-minimising strategy, particularly where ready trained migrant workers exist, avoiding the need to hire and train the local workforce. In particular, Manning et al explore the relationship between high levels of net migration and domestic upskilling.[footnote 51]
149. They found evidence of a negative relationship between the migrant share and both training participation and training intensity; although they also found evidence that effects are concentrated in types of training that are less valuable and among workers who are less likely to benefit from it. Manning et al estimated an increase in migrant share from 14.6 to 20.3 per cent reduced the share of workers receiving training by nearly 1 percentage point. This is further supported by evidence from Mountford et al who find that a five percentage point increase in the skilled immigrant sector share reduces the sector share of native hiring by 0.02 percentage.[footnote 52]
150. Other countries have adopted similar approaches to restrict low skilled migration. A report produced by the Productivity Commission in New Zealand, advising on immigration policy settings to facilitate the country’s long-term economic growth, argue that without actively managing low skilled migration risks simply expanding the economy while harming long-term productivity growth.[footnote 53] This is especially the case where strong migration inflows restrict wage growth, making some jobs less attractive to local workers, which in turn encourages or reinforces some firms and industries to rely on low-cost and low-skill labour.
151. Providing incentives for employers to invest in the upskilling of the domestic population is likely to in turn have positive implications for UK productivity growth. A wide body of academic literature explores the link between training and productivity growth, with evidence from Dearden et al estimating a one per centage point increase in training associated with an increase in value added per hour of about 0.6 per cent.[footnote 54]
152. Therefore, whilst restricting low skilled migration is likely associated with a net fiscal cost in the short term – as quantified and captured in the first order effects – it is these second order effects that drive the rationale for changes given their potential to boost UK productivity growth, especially in the longer-term.
153. No quantification has been possible to account for this impact as there has not been sufficient time to understand the long-term impacts of the record levels of net migration on substitution and productivity. However, to account for the plausibility of this impact, sensitivity analysis has been undertaken in Sensitivity Analysis to examine the impact on the NPSV if the reduction in migrant labour results in sufficient training and upskilling for half of the reduction in labour to be filled by native workers.
Spill-over benefits
154. The Migration Advisory Committee (MAC) reviewed evidence on social and community impacts and concluded that “there is no evidence that migration has affected crime. There is no evidence that migration has reduced subjective well-being though some suggestion that this varies with attitudes to migration. Overall, there is no evidence that people are less satisfied with their neighbourhoods than in the past.” However, the MAC also noted that “the impacts of migration on communities is hard to measure due to their subjective nature which means there is a risk they are ignored”. [footnote 55]
155. Recent Ipsos polling (April 2025) found that 67 per cent of British people surveyed believe immigration levels are too high, with 43 per cent reporting they are ‘much too high’.[footnote 56] Respondents were also more likely to perceive that immigrants have a negative rather than a positive impact on their local community. However, Skilled Workers were viewed more positively than other migrant groups in relation to their impact on local communities, though the specific nature of these impacts was not defined. This distinction is supported by research from the Migration Observatory which found that the British public tends to differentiate between migrant types, with high skilled migrants receiving greater support.[footnote 57]
156. Overall, benefits are uncertain and may be negligible in relation to the social or community level impacts of the changes discussed in this IA, noting estimated fiscal impacts account for use of public services.
Transfers
Home Office Fee and Charging Revenue.
157. The ISC[footnote 58] and CoS[footnote 59] are assumed to be part of the cost of sponsoring workers within the immigration system borne by employers, and the fees associated with these represent a transfer from the private sector to the public sector. Changes in flow volumes can affect the extent of these transfers
158. These charges apply to sponsoring of main applicants only; and this impact is quantified by multiplying the cost of the CoS and ISC set out in the “Home Office Fees and Charges” by the estimated change in inflows in Table E7, accounting for the length of visa issued for the ISC.
159. This results in estimated reduction in transfers from the private to public sector of -£0.4 billion across the appraisal period (2025/26 prices) with a range of around -£0.3 billion to -£0.6 billion.
NPSV, BNPV, EANDCB
160. The Net Present Social Value (NPSV) captures the expected net economic benefit to society over the appraisal period and are the present value of the future costs and benefits to UK society discounted over the 5-year appraisal period by the appropriate Green Book social time preference rate of 3.5 per cent.[footnote 60]
161. However, as noted throughout, this only considers the first-order impacts of this policy change on the reduction in labour supply. If these policies, alongside the other measures in the Plan for Change, result in a significant increase in training and investment, and an increase in the employment of native workers, these impacts would likely significantly outweigh costs identified in this IA and in the NPSV assessment. Sensitivity analysis has been undertaken in the Risks and Sensitivity Analysis section to highlight one element of this impact if it were to happen, but even this does not account for the impact if the policy were to result in a significant increase in overall productivity.
162. The central estimate for the NPSV of policy changes is estimated at -£5.4 billion (2025/26 prices) over the 5-year appraisal period, and between -£2.2 billion and -£10.8 billion in the low and high scenarios as set out in Table E12.
163. However, this impact is not linear as a result of the increasing stock of people affected over the appraisal period. The NPSV over the 4-year period to the end of 2028/29 is estimated at -£3.2 billion in the central case (PV 2025/26 prices).
Table E13. Costs, benefits and NSPV of changes, in low, central and high scenarios relative to the baseline (summed across appraisal period, discounted, 2025/26 prices, £ billion)
Costs
| Low | Central | High | |
|---|---|---|---|
| Reduction in visa fee and IHS revenue | -£0.5 | -£0.7 | -£0.8 |
| Reduction in tax income | -£6.1 | -£8.5 | -£13.0 |
| Indirect Employer Adjustment - Salaries | -£0.4 | -£0.5 | -£0.6 |
| Total | -£7.0 | -£9.6 | -£14.4 |
Benefits
| Low | Central | High | |
|---|---|---|---|
| Reduction in visa fee, CoS fee, ISC and IHS processing costs | £0.1 | £0.1 | £0.1 |
| Reduction in public services pressure | £4.7 | £4.1 | £3.5 |
| Total | £4.8 | £4.2 | £3.7 |
NPSV
| Low | Central | High | |
|---|---|---|---|
| Total | -£2.2 | -£5.4 | -£10.8 |
Source: Home Office internal analysis
Table E14. Annual Costs, benefits and NSPV of changes, in the central scenario relative to the baseline (discounted, 2025/26 prices, £ billion)
Costs
| 2025/26 | 2026/27 | 2027/28 | 2028/29 | 2029/30 | 2030/31* | |
|---|---|---|---|---|---|---|
| Reduction in visa fee and IHS revenue | - | -£0.1 | -£0.1 | -£0.1 | -£0.1 | - |
| Reduction in tax income | -£0.4 | -£0.9 | -£1.4 | -£2.1 | -£2.8 | -£0.9 |
| Indirect Employer Adjustment - Salaries | - | -£0.1 | - | - | - | - |
| Total | -£0.6 | -£1.2 | -£1.6 | -£2.3 | -£3.0 | -£0.9 |
Benefits
| 2025/26 | 2026/27 | 2027/28 | 2028/29 | 2029/30 | 2030/31* | |
|---|---|---|---|---|---|---|
| Reduction in visa fee, CoS fee, ISC and IHS processing costs | - | - | - | - | - | - |
| Reduction in public services pressure | £0.2 | £0.5 | £0.7 | £1.0 | £1.3 | £0.4 |
| Total | £0.2 | £0.5 | £0.7 | £1.0 | £1.3 | £0.4 |
NPSV
| 2025/26 | 2026/27 | 2027/28 | 2028/29 | 2029/30 | 2030/31* | |
|---|---|---|---|---|---|---|
| Total | -£0.4 | -£0.7 | -£0.9 | -£1.3 | -£1.7 | -£0.5 |
Source: Home Office internal analysis. “-“ represents an impact of less than £0.1bn. 2025/26 is only the period to 22 July 2026. *2030/31 represents only part of a year to complete a full 5-year appraisal.
164. The Business Net Present Value (BNPV) accounts for estimated quantified impacts that affect businesses. Aside from those identified in the NPSV above, the BNPV also reflects changes in the incidence of transfers where that has a net impact on business.
165. As such an additional business benefit resulting in an estimated reduction in transferred CoS and ISC fee revenue from business to the public sector, as set out in the “Transfers” section is included in the BNPV, but not the NPSV. However, the main driver relates to additional indirect costs to employers from raising salaries under assumed behavioural response to the increased salary thresholds.
166. The central estimate for the BNPV of the policy changes is estimated at -£0.04 billion (2025/26 prices) over the 5-year appraisal period. In the low scenario, the BNPV is estimated at -£0.03 billion and in the high scenario, the BNPV is estimated at -£0.05 billion (2025/26 prices).
Risks and Sensitivity Analysis
Risks
167. Analysis presented in this IA has set out the methods used to estimate potential impacts of the policy option, outlined assumptions used and the sources of assumptions, explained limitations of the analysis and where well evidenced quantification of impacts has not proved possible has discussed impacts qualitatively.
168. Analysis presented has used ranges to illustrate the impact from varying important assumptions such as baseline volumes and elements of fiscal impacts. The high and low scenarios presented helps to illustrate the risks around the central scenario derived from variation in those assumptions.
169. As such, further consideration of analytical risk is limited. For analysis of sponsored work visas, the largest uncertainty remains potential behavioural response from both employers and migrants to changes, both in terms of the share that choose to pay higher wages as a result of the salary threshold changes, but more importantly on how businesses react to the reduction in migrant labour supply from the skill restrictions, salary threshold changes and to no longer having access to migrant care workers.
170. As set out throughout the IA, there are a number of ways businesses can react, one of which is to invest in the upskilling of the domestic workforce. While this may come at a cost to business, the impact of this on replacing the reduction in migrant labour supply with the domestic workforce is likely to have a significant impact on mitigating the negative impacts set out in the NPSV.
Sensitivity Analysis
Domestic Worker Replacement Effects
171. While no evidence is available on the extent, and the time horizon, through which this replacement of domestic labour may occur, illustrative sensitivity analysis has been undertaken to estimate the extent to which a 50 per cent replacement of domestic employment for the foregone migrant labour mitigates the negative NPSV.
172. An illustrative assessment on the fiscal benefit of a domestic worker moving from long-term unemployment to employment in RQF 3 to 5 jobs at an average salary of £31,500 for an in country Skilled Worker and £24,000 for those on Health and Care is set out in the Fiscal Methodology and Assumptions section above.
173. In a purely illustrative scenario where 50% of migrant volumes deterred in the central estimate are replaced by long-term unemployed workers claiming Universal Credit at £9,600 per annum, who enter the labour market in occupations equivalent to those filled by the deterred migrant cohort, Home Office modelling suggests this would result in a net positive fiscal impact of £6.1 billion over a 5-year appraisal period (2025/26 prices).
174. In the context of the negative NPSV estimated as a result of this policy over the same period of -£5.4 billion (2025/26 prices), this would result in an overall positive NPSV of £0.8 billion.
175. Additional tipping point analysis suggests that if 44% of deterred main applicant migrant volumes are replaced by long-term unemployed workers under the same assumptions the package would have a neutral NPSV. This is equivalent to an increase in flow of UK nationals into employment of around 15,000 per year, or around 75,000 over the 5-year appraisal period, out of the current pool of around 1.6 million unemployed people in the UK between February and April 2025.
RQF 3 to 5 Substitution Effects
176. An additional sensitivity is carried out on the assumption on the substitution of lower-skilled workers to RQF 3 to 5 occupations on the TSL, ISL or Care worker roles (discussed in paragraphs 21 and 22).
177. In a high impact scenario, the proportion of applicants switching from ineligible RQF 3-5 occupations to eligible RQF 3 to 5 occupations on the TSL or ISL is assumed to be half, and the remaining proportion switching into Care worker roles assumed to be zero (further increasing the magnitude of the reduction of flows onto the Skilled Worker routes compared to the central scenario). This results in roughly a 15 per cent increase in the magnitude of the reduction in the flow estimates affected by the policy changes set out in Table E4.
178. In a low impact scenario, the proportion of applicants switching from ineligible RQF 3 to 5 occupations to eligible RQF 3-5 occupations on the TSL or ISL is unchanged, and the proportion switching to Care Worker roles assumed to be replace the loss of out-of-country migrant workers to the occupation (reducing the magnitude of the reduction in demand on the Skilled Worker routes compared to the central scenario). This results in roughly a 4 per cent decrease in the magnitude of the reduction in the flow estimates affected by the policy changes set out in Table E4.
179. The low impact scenario is modelled to increase the NPSV by £1.0 billion, as compared to the central scenario of -£5.4 billion, and the high impact scenario to reduce the NPSV by -£1.0 billion (2025/26 prices).
Wider Impacts
Gender
180. Analysis of sponsored work visas allows disaggregation by gender. The impact of the estimated reduction in stocks, presented in Table E9, will vary based on the expected gender-split of the cohorts in our baseline scenario. For the six-month period to March 2025, likely to best reflect the ongoing operation of the routes in the absence of policy change, the gender split on the Skilled Worker and Health and Care route were:
- Skilled Worker: around 63 per cent of granted applications were to male main applicants and 37 per cent of granted applications were to female main applicants,
- Health and Care: around 33 per cent of granted applications were to male main applicants and 67 per cent of granted applications were to female main applicants.
Environment
181. The estimated fall in visas granted under the package of changes, albeit proportionately small when compared to the wider immigration system, represents a reduction in the demand for travel to the UK, resulting in fewer carbon dioxide equivalent (CO2e) emissions. As this impact is relatively small, no further quantification has been undertaken as part of this IA.
Small and Medium Businesses
182. Impacts by business size are discussed within the differing groups affected by policy changes. Note data defines business size as:
- Micro: 0-9 employees
- Small: 10 – 50 employees
- Medium: 51 – 499 employees
- Large: 500+ employees
183. In the baseline data, for the period October 2024 to March 2025, around 94 per cent of affected Skilled Workers were estimated to be sponsored by a medium, small or micro business, as were around 89 per cent of workers sponsored on the Health and Care route and 78 per cent of care or senior care workers.
184. It would not be possible to apply differential requirements based on the size of business without complicating the system and undermining its policy objectives. It could also create perverse incentives, for example for larger organisations to structure their sponsor licensing as several smaller organisations, to benefit from preferential policies.
185. The Home Office does, however, provide support to smaller sponsors where possible – including through lower licence application fees and a reduced ISC. The evidence required from sponsors, and the systems which they must have in place to manage their sponsor duties, are also designed to be flexible – these can be appropriate to the size of the organisation, rather than “one size fits all”.
Trade Impact
186. There are a number of channels through which immigration may affect trade and, in general, the external literature finds a positive relationship between the stock of immigrants and trade. At a macro-level high immigration to the UK increases the UK population and consequently aggregate demand and the demand for imports. UK exports may also increase if immigration can enhance the international competitiveness of the UK. For example, Gould (1994)[footnote 61] argues that immigrants have individual-specific knowledge of home-country markets which could enhance trading opportunities. For example, immigrants may have a greater a knowledge of foreign languages which helps improve communication in trading relationships, and immigrants may have a greater understanding of legal arrangements which may help lower the fixed costs of trade.
187. Other mechanisms through which immigrants may affect trade include a preference for home-country goods, which could increase the demand for UK imports through an increase in consumption.
188. As outlined above, while not negligible, the expected reduction in the stock of migrants in any appraisal year as a result of the preferred option is small compared to the total stock of migrants resident in the UK. Therefore, any trade impacts are be expected to be small.
Monitoring and evaluation plan
189. The impact will be monitored by the Home Office, with support as appropriate from other government departments. This will be included as part of ongoing evaluations of the Skilled Worker and Health and Care routes.
190. A first-wave evaluation of the Skilled Worker and Health and Care routes was completed and published in May 2025.[footnote 62] The research provided insights into the motivations, experiences, and activities of visa holders and sponsors, and was used to inform white paper proposals. A second-wave evaluation is planned to capture and assess the impact of policy changes and the extent of any post-implementation behavioural shifts.
191. The Home Office also publishes migration statistics quarterly, including for the Skilled Worker and Health and Care routes, and by occupation which will also provide evidence on the impact of these changes on inflows.
192. The Home Office will also maintain open lines of communication with applicants via email and may also receive feedback as part of its normal visa issuing processes, through its public enquiry lines, and through formal correspondence with interested parties.
193. In parallel, the Department of Health and Social Care (DHSC) monitors the adult social care workforce capacity through regular analysis of national workforce data, including information from Skills for Care’s Adult Social Care Workforce Data Set (ASC-WDS), the Capacity Tracker data collection and insight tool, and intelligence from key sector partners. This monitoring helps assess trends in recruitment, retention, and vacancy rates across the sector, and provides contextual evidence on the broader impact of immigration policy changes on the care workforce. Insights from this analysis support ongoing policy development.
Annex A
Stock of people not in the UK as a result of the policy restrictions, financial year, thousands, main applicants and dependants. High and low scenario.
High scenario
| Cohort | Main / Dependant | 2025/26 | 2026/27 | 2027/28 | 2028/29 | 2029/30 |
|---|---|---|---|---|---|---|
| Skilled Worker | Main | -18 | -43 | -69 | -92 | -113 |
| Dependant | -10 | -25 | -39 | -53 | -65 | |
| Health and Care | Main | -2 | -6 | -12 | -17 | -20 |
| Dependant | -2 | -6 | -10 | -14 | -18 | |
| Care and Senior Care Workers | Main | -2 | -5 | -5 | -28 | -62 |
| Dependant | N/A | N/A | N/A | N/A | N/A | |
| Total | -34 | -84 | -135 | -203 | -278 |
Low scenario
| Cohort | Main / Dependant | 2025/26 | 2026/27 | 2027/28 | 2028/29 | 2029/30 |
|---|---|---|---|---|---|---|
| Skilled Worker | Main | -11 | -26 | -41 | -55 | -68 |
| Dependant | -6 | -15 | -24 | -32 | -39 | |
| Health and Care | Main | -1 | -4 | -7 | -10 | -12 |
| Dependant | -1 | -3 | -6 | -9 | -11 | |
| Care and Senior Care Workers | Main | -1 | -3 | -3 | -17 | -37 |
| Dependant | N/A | N/A | N/A | N/A | N/A | |
| Total | -21 | -51 | -81 | -122 | -167 |
Source: Internal Home Office analysis.
Net Migration impact as a result of the policy restrictions, financial year, thousands, main applicants and dependants. High and low scenario.
High scenario
| Total | Main / Dependant | 2025/26 | 2026/27 | 2027/28 | 2028/29 | 2029/30 |
|---|---|---|---|---|---|---|
| Skilled Worker | Main | -18 | -26 | -25 | -22 | -18 |
| Dependant | -10 | -15 | -15 | -13 | -10 | |
| Health and Care | Main | -2 | -4 | -6 | -4 | -2 |
| Dependant | -2 | -4 | -4 | -4 | -3 | |
| Care and Senior Care Workers | Main | -2 | -2 | 0 | -23 | -33 |
| Dependant | N/A | N/A | N/A | N/A | N/A | |
| Total | -34 | -50 | -50 | -66 | -67 |
Low scenario
| Total | Main / Dependant | 2025/26 | 2026/27 | 2027/28 | 2028/29 | 2029/30 |
|---|---|---|---|---|---|---|
| Skilled Worker | Main | -11 | -15 | -15 | -13 | -11 |
| Dependant | -6 | -9 | -9 | -8 | -6 | |
| Health and Care | Main | -1 | -2 | -4 | -3 | -1 |
| Dependant | -1 | -2 | -3 | -2 | -2 | |
| Care and Senior Care Workers | Main | -1 | -1 | 0 | -14 | -20 |
| Dependant | N/A | N/A | N/A | N/A | N/A | |
| Total | -21 | -30 | -30 | -40 | -40 |
Source: Internal Home Office analysis
Annex B
| Mandatory specific impact test - Statutory Equalities Duties | Complete |
|---|---|
|
Statutory Equalities Duties The Home Office assess that there may be some indirect impacts as a result of the changes including raising the skills threshold and salary requirements. These are more likely to affect younger people who are likely to be earlier in their career and therefore less likely to have reached the higher salary of more experienced colleagues. It may also affect those where there is still evidence of lower pay including women and those with disabilities. However, the Home Office consider that these changes are justified for legitimate policy aims of lowering net migration and reducing reliance on overseas workers. In relation to social care, the Home Office assess that there may be some indirect impact of closing the route on those from countries which make up the majority of care workers including Nigeria, Zimbabwe, Ghana, India and Pakistan. This may indirectly affect characteristics including ethnicity, religion, race. The department also know that the sector is more commonly occupied by women so likely to have a greater impact on women than men from those countries. The Home Office also recognise that this may have an impact on user of care services who are likely to be older people and those with disabilities. The Home Office believes that despite these points the changes are justified for a number of policy reasons including reducing net migration and ending reliance on overseas recruitment. The SRO has agreed these summary findings. |
Yes |
-
Restoring control over the immigration system: https://www.gov.uk/government/publications/restoring-control-over-the-immigration-system-white-paper. ↩
-
A02 SA: Employment, unemployment and economic inactivity for people aged 16 and over and aged from 16 to 64 (seasonally adjusted) - Office for National Statistics. ↩
-
Young people not in education, employment or training (NEET), UK - Office for National Statistics. ↩
-
Occupations of those in employment, by age and sex, England and Wales, Census 2021 - Office for National Statistics. ↩
-
Further education and skills, Academic year 2024/25 - Explore education statistics - GOV.UK. ↩
-
Investment in training, Data set from Employer Skills Survey - Explore education statistics - GOV.UK. ↩
-
Immigration and vocational training: Evidence from England. ↩
-
Welfare spending: universal credit - Office for Budget Responsibility. ↩
-
Long-term international migration, provisional - Office for National Statistics. ↩
-
Statement of changes in immigration rules - HC 997 - Immigration Rules Changes. ↩
-
Two thirds of Britons say the total number of people entering the UK is too high: Ipsos. ↩
-
UK Public Opinion toward Immigration: Overall Attitudes and Level of Concern - Migration Observatory - The Migration Observatory. ↩
-
The Green Book: appraisal and evaluation in central government - GOV.UK. ↩
-
Migration Advisory Committee (2015) ‘Evaluation of existing migration forecasting methods and models’. ↩
-
https://www.gov.uk/health-care-worker-visa/your-partner-and-children. ↩
-
https://www.ons.gov.uk/employmentandlabourmarket/peopleinwork/labourproductivity/adhocs/2563skillstransferabilityforoccupationsbasedontheirrequirements. ↩
-
From respondents stating ‘I wanted to live in the UK’ and ‘Both were equally important’ in Table A1. ↩
-
From respondents stating ‘Yes, my partner and/or child(ren) are dependants on my current Skilled Worker visa’ in Table 55 and respondents stating ‘I would have looked for a visa in another country that allowed dependants’ or ‘I would have remained in my home country/country of residence at the time’ in Table 63. ↩
-
Immigration Rules salary impact assessment for example. ↩
-
A review of evidence relating to the elasticity of demand for visas in the UK - GOV.UK. ↩
-
Figures on the size of the ASC sector in this section relate to England only while figures on visas relate to the UK as a whole. Percentages which compare visa impacts to the scale of the sector are therefore slightly overestimated. ↩
-
Similar uplifts to reflect hours worked of migrant workers, as set out in footnote 2, are made. ↩
-
The State of the Adult Social Care Sector 2024 – Skills for Care. ↩
-
Social care workforce delivery plan 2024 to 2027: Social Care Wales. ↩
-
Health and social care: national workforce strategy - gov.scot. ↩
-
Some of these workers might represent retained capacity rather than new additions to the workforce. ↩
-
Pay for UK healthcare as part of your immigration application: Overview - GOV.UK. ↩
-
Universal Credit statistics, 29 April 2013 to 11 April 2024 - GOV.UK. ↩
-
Universal Credit is reported in 24/25 rates. ↩
-
Fiscal risks and sustainability – September 2024 - Office for Budget Responsibility. ↩
-
Earnings and hours worked, UK region by age group - Office for National Statistics. ↩
-
The link between growth and immigration: unpicking the confusion - British Politics and Policy at LSE. ↩
-
This assumes migrants’ earnings generate the same levels of profitability than the average resident worker, and therefore only changes in labour income are captured. The share of labour income is estimated at 60% for Q1-Q3 2024, see here: https://www.ons.gov.uk/employmentandlabourmarket/peopleinwork/labourproductivity/timeseries/fzln/ucst. ↩
-
Migration Advisory Authority, EEA migration in the UK: Final report. ↩
-
Economic and fiscal outlook – March 2024 - Office for Budget Responsibility. ↩
-
Migration Advisory Committee (MAC) report: EEA migration - GOV.UK. ↩
-
Migration Advisory Committee, A Points-Based System and Salary Thresholds for Immigration. ↩
-
All quotes in this paragraph are taken from Migration Advisory Committee (MAC) report: EEA migration - GOV.UK. ↩
-
Occupations of those in employment, by age and sex, England and Wales, Census 2021 - Office for National Statistics. ↩
-
Long-term international migration: Year ending June 2012 to year ending 2024, Table 1, Office for National Statistics published 28th November 2024. ↩
-
Immigration and vocational training: Evidence from England. ↩
-
Centre for Economic Performance, Discussion paper No. 1618 - Trainspotting: ‘Good Jobs’, Training and Skilled Immigration. ↩
-
Oxford Bulletin of Economics and Statistics - The Impact of Training on Productivity and Wages: Evidence from British Panel Data. ↩
-
Migration Advisory Committee (MAC) report: EEA migration - GOV.UK. ↩
-
Two thirds of Britons say the total number of people entering the UK is too high: Ipsos. ↩
-
UK Public Opinion toward Immigration: Overall Attitudes and Level of Concern - Migration Observatory - The Migration Observatory. ↩
-
‘How much it costs’ Processing cost assumptions are the 2024/25 average. ↩
-
Gould (1994) ‘Immigrant Links to the Home Country: Empirical Implications for U.S. Bilateral Trade Flows’. ↩