State-funded schools inspections and outcomes as at 31 December 2018
Updated 21 September 2020
Applies to England

© Crown copyright 2020
This publication is licensed under the terms of the Open Government Licence v3.0 except where otherwise stated. To view this licence, visit nationalarchives.gov.uk/doc/open-government-licence/version/3 or write to the Information Policy Team, The National Archives, Kew, London TW9 4DU, or email: psi@nationalarchives.gov.uk.
Where we have identified any third party copyright information you will need to obtain permission from the copyright holders concerned.
This publication is available at https://www.gov.uk/government/statistics/state-funded-schools-inspections-and-outcomes-as-at-31-december-2018/state-funded-schools-inspections-and-outcomes-as-at-31-december-2018
This release contains:
- schools’ most recent inspections and outcomes as at 31 December 2018
- provisional data for inspections completed between 1 September and 31 December 2018
- revised data for inspections completed between 1 April and 31 August 2018
85% of schools are good or outstanding.
At the end of December 2018, we had judged 85% of schools good or outstanding at their most recent inspection, compared to 86% in August 2018 and 87% in August 2017.
The proportion of schools that improved at the inspection following a ‘requires improvement’ judgement has fallen.
The number of inspections of schools previously judged to require improvement has decreased since the academic year 2014 to 2015 and the academic year 2015 to 2016. This year 58% of these schools improved compared to 71% in the academic year 2015 to 2016.
Only 23% of exempt schools inspected remained outstanding.
Only 23% of exempt[footnote 1] schools inspected remained outstanding. We have inspected 117 exempt schools so far this year.
Figure 1: Overall effectiveness of state-funded schools at their most recent inspection, as at 31 December 2018
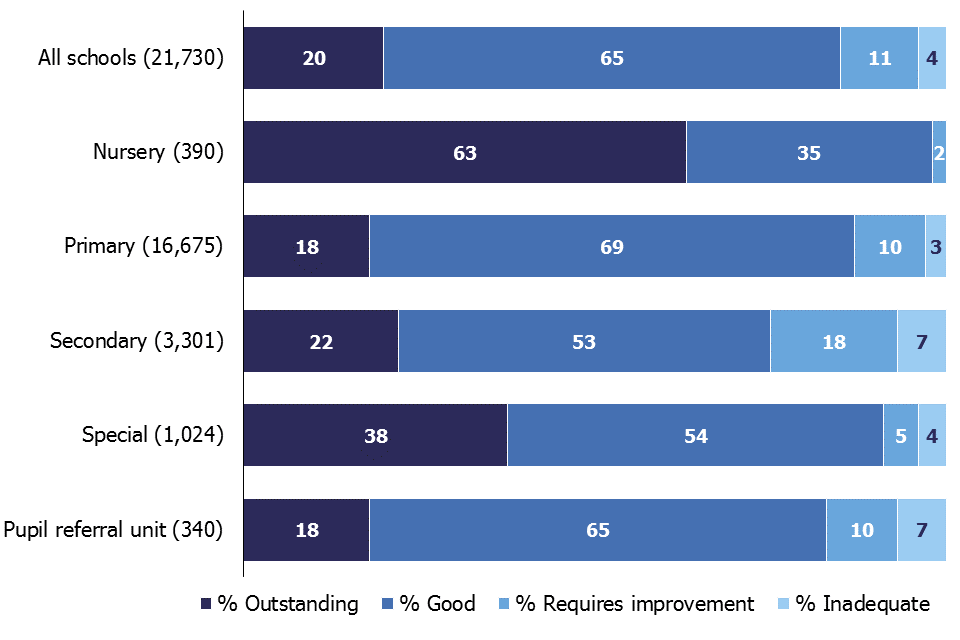
At their most recent inspection, 20% of all schools were outstanding, 65% were good, 11% were judged to require improvement and 4% were inadequate.
1. Introduction
The purpose of these official statistics is to disseminate the data on school standards collected through Ofsted’s role as an inspectorate. They provide information about how the judgements of schools have changed over time and vary across different phases of education and different parts of the country.
This official statistics release reports on the outcomes of state-funded school inspections carried out under sections 5 or 8 of the Education Act 2005. These inspections were carried out between 1 September 2018 and 31 December 2018. This release also includes the most recent inspections and outcomes for all schools that have been inspected, as at 31 December 2018.
Following a consultation, in June 2018 we made some changes to the way in which we report on schools’ most recent inspection grades. See the consultation and an analysis of the responses.
Throughout this release, the term ‘schools’ is used to cover all local authority maintained schools, state-funded academies and non-maintained special schools in England that Ofsted is required to inspect under section 5 of the Education Act 2005.
2. Inspections between 1 September 2018 and 31 December 2018
There have been 695 full inspections which resulted in an overall effectiveness judgement. Of these, 123 were conducted under section 8 of the Education Act 2005 and became full inspections part way through. There were also 10 short inspections that converted to a full inspection where there were serious concerns on safeguarding, behaviour or the quality of education.
There have been 1,021 short inspections which did not convert to a full inspection and the school maintained its previous grade of good or outstanding.
Eighty-three per cent of the 1,716 schools receiving a full or short inspection were judged good or outstanding. In most cases, either the current school or its predecessor had been inspected previously[footnote 2]. There have been just 19 schools that had not been inspected previously in any form, and of these 16 were judged to be good or outstanding.
Figure 2: Overall effectiveness of schools inspected between 1 September 2018 and 31 December 2018 (including short inspections that did not convert)
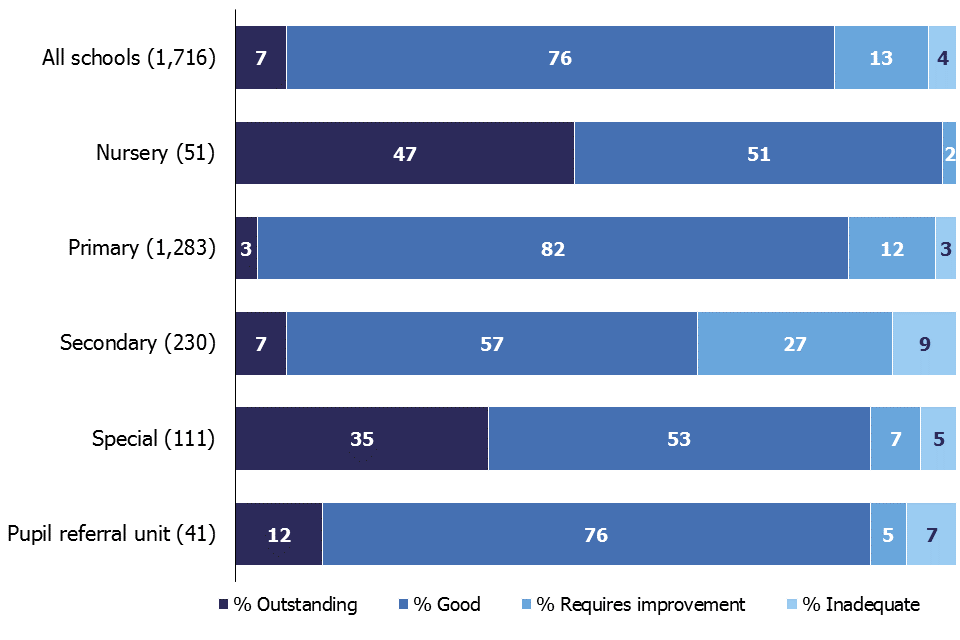
Of all full inspections and short inspections that did not convert conducted this year, 7% resulted in an outstanding overall effectiveness judgement, 76% good, 13% requires improvement and 4% inadequate.
2.1 Inspections of schools previously judged to be outstanding
There have been 182 inspections of schools that were previously outstanding and, of these, 104 had a published full inspection.
As part of the 2011 Education Act, the government made outstanding primary and secondary schools exempt from routine inspections. Despite this we are still able to inspect outstanding primary and secondary schools if their performance gives cause for concern. This year we have increased the number of these inspections we complete each year.
Figure 3: Outcomes for previously outstanding state-funded schools inspected between 1 September 2018 and 31 December 2018 (numbers)
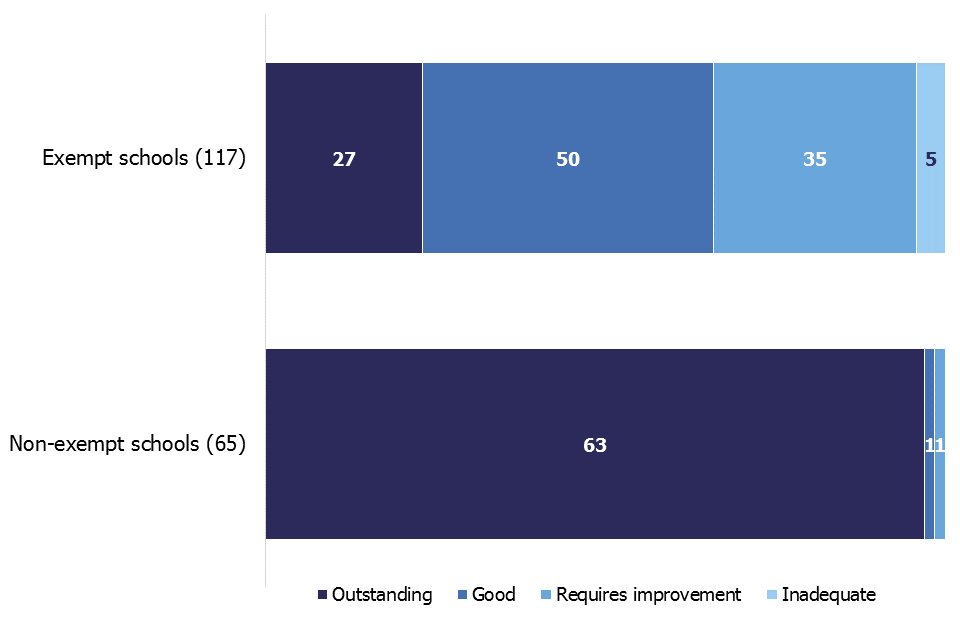
Almost all non-exempt outstanding schools inspected this year remained outstanding, whereas only 27% of exempt schools remained outstanding
There were 117 inspections of exempt outstanding schools from 1 September to 31 December 2018 compared to 149 between 1 September 2017 and 31 August 2018. Of these 117, 102 (87%) were deemed a full inspection. Of the 102 inspections that were deemed a full inspection, 12 (12%) remained outstanding, 50 (49%) declined to good, 35 (34%) declined to requires improvement and 5 (5%) declined to inadequate. There were also 15 section 8 inspections that were not deemed a full inspection and therefore these schools also remained outstanding.
Including the section 8 inspections that were not deemed a full inspection, only 23% of exempt schools that were inspected remained outstanding. This is 10 percentage points lower than the proportion of exempt schools that remained outstanding following inspections that took place between 1 September 2017 and 31 August 2018.
2.2 Inspections of schools previously judged to be good
Schools previously judged to be good may have a short inspection or a full section 5 inspection. The type of inspection they have depends on the findings of the previous short inspection, whether they have had a change of status, and whether a risk assessment raised any concerns about the school.
Figure 4: Outcomes for previously good state-funded schools inspected between 1 September 2018 and 31 December 2018 by inspection type[footnote 3][footnote 4][footnote 5][footnote 6] (numbers)
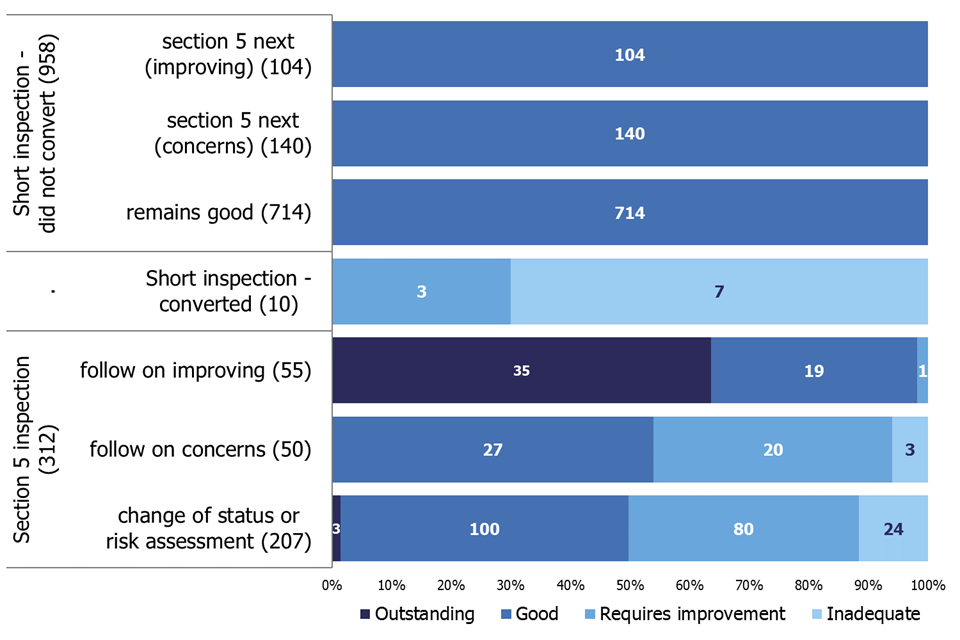
958 short inspections resulted in schools retaining their good judgement at least until their next full inspection; 312 full inspections of good schools resulted in a wider range of outcomes
There have been 968 short inspections of good schools this year. Of these, 714 (74%) short inspections confirmed that the school remains good. There were 140 (14%) schools where inspectors believed that the school may have declined from good if it had been a full inspection. There were 104 (11%) schools where inspectors believed that the school may have improved to outstanding if it had been a full inspection. In both these cases we will schedule a full inspection for 1 to 2 years’ time (see the section 8 school inspection handbook).
Only 10 short inspections (1%) have converted to a full inspection in the academic year 2018 to 2019. Following a policy change in January 2018, short inspections only convert to a full inspection if there are concerns on safeguarding, behaviour or the quality of education.
There have been 55 full inspections of good schools where the outcome of the previous short inspection was for a ‘section 5 inspection next’ as the school was potentially improving. Of these, 35 improved to outstanding, 19 remained good, and 1 declined to requires improvement.
There have been 50 full inspections of good schools where the outcome of the previous short inspection was for a ‘section 5 inspection next’ as the school was potentially declining. Of these, 27 remained or declined to good, 20 declined to requires improvement and 3 declined to inadequate.
Following an earlier policy change in November 2017, primary and secondary schools that were judged good at their previous inspection may be selected for a full section 5 inspection. This decision is based on a risk assessment to determine if they have undergone significant change, such as a change of the age range of the school, or where the quality of provision may have deteriorated significantly. There have been 200 of these inspections this year and of these, 2 (1%) improved to outstanding, 98 (49%) remained good, 79 (40%) declined to requires improvement and 21 (11%) declined to inadequate.
2.3 Inspections of schools previously judged to require improvement
This year there have been 182 full inspections of schools that were previously judged to require improvement. The number of inspections of schools that were previously judged to require improvement has decreased since the academic year 2014 to 2015 and the academic year 2015 to 2016, when around 1,500 were inspected each year. This is because there are fewer schools judged to require improvement at their last inspection (11% compared to 30% in 2010), and so fewer inspections are needed for this group of schools in a given year.
Figure 5: Grade movement for state-funded schools previously judged to require improvement, by year
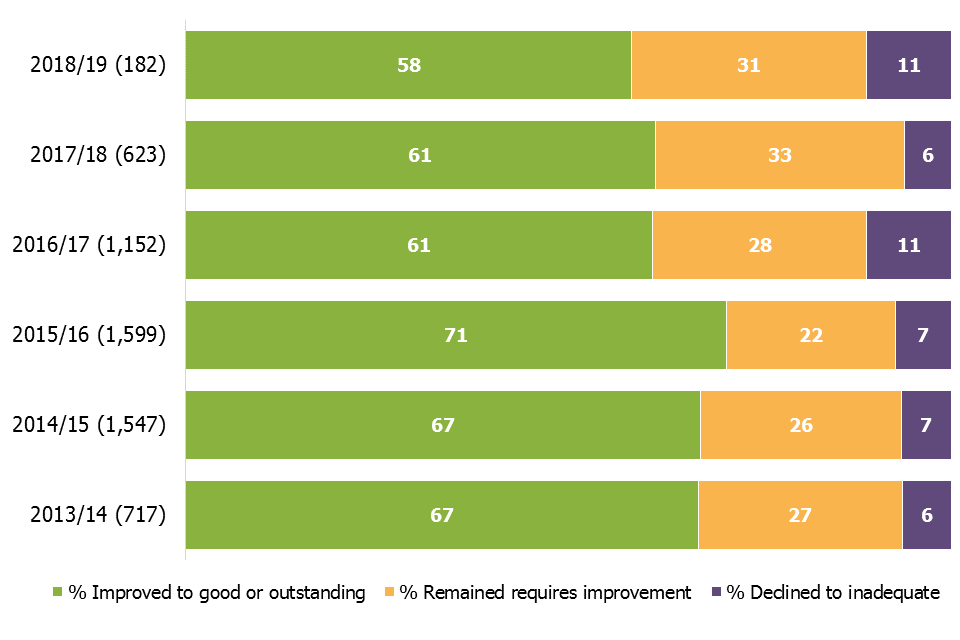
The proportion of previously RI schools inspected in each academic year that inproved to good or oustanding has been lower in the past 3 years compared to the 4 previous years and is at its lowest in this year to date at 58%.
Of these 182 inspections, 1% improved to outstanding, 57% improved to good, 31% remained requires improvement and 11% declined to inadequate. This is an increase of 5 percentage points in the proportion of schools that declined to inadequate.
The proportion of schools that improved from require improvement to good has decreased to 58% this year, compared to 61% in each of the previous 2 years, and 71% in the academic year 2015 to 2016. This may be a sign that the remaining schools have more entrenched problems and will be harder to turn around[footnote 7] .
3. Schools at their most recent inspection
At the end of December 2018 we had judged 85% of schools to be good or outstanding at their most recent inspection. There was little change from the position at the end of August 2018 (86%), although this fall continues the trend seen since 2017 (87%). Outcomes continue to be higher for primary schools (87% good or outstanding) compared to secondary schools (75%).
The drop in the percentage of schools that were good or outstanding at their most recent inspection is due to a slight fall (0.2 percentage points) in the proportion judged outstanding. This is partly driven by the outcomes of inspections of schools which were previously outstanding, around half of which declined at their inspection in the academic year 2018 to 2019 (Figure 3).
Figure 6: Most recent inspection outcomes of all state-funded schools, 2010 to 31 December 2018

Since 2010, the proportion of schools judged to be good or outstanding at their most recent inspection has increased, from 68% in 2010 to 85% in 2018.
3.1 Changes in overall effectiveness grades between inspections
Figure 7 summarises how the pattern of inspection outcomes has changed over the last 5 years, and helps to explain why the proportion of all schools that are good or outstanding at their most recent inspection has reduced slightly since August 2017. It combines the number of schools improving from requires improvement or inadequate to good or outstanding (plus those not previously inspected who were judged to be good or outstanding); and then deducts the numbers of schools declining from good or outstanding to requires improvement or inadequate (plus those not previously inspected who were judged to require improvement or to be inadequate). Between 2014 and 2017 more schools were improving their grade than were seeing a decline. However, since 2017 this pattern has reversed. As described earlier, the changes in the volumes and outcomes of inspections of schools that were previously outstanding (Figure 3), and that required improvement (Figure 5) have contributed to this.
Figure 7: The balance between the number of schools becoming good or outstanding and the number becoming requires improvement or inadequate, by year
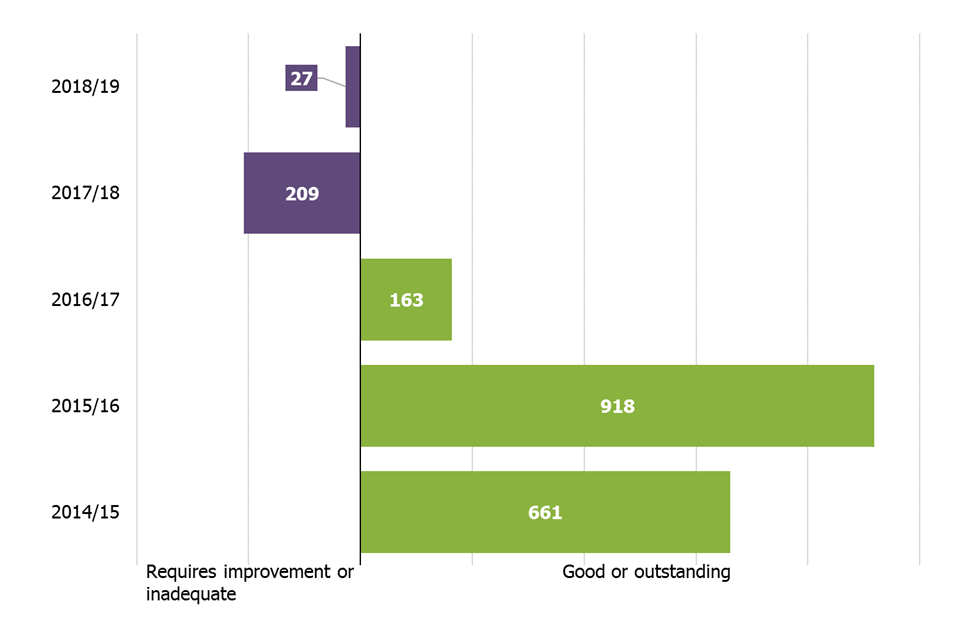
Between 2014 to 2015 and 2016 to 2017 more schools became good or outstanding; in the last 2 years, slightly more schools became RI or inadequate
4. Inspection outcomes for schools in opportunity areas
The Department for Education announced its opportunity areas programme in October 2016. The aim is to improve social mobility, using education as a key driver to achieve this. The areas were chosen as they were considered to be the most in need of additional support across a wide range of issues.
Six areas were identified in October 2016 and a further 6 areas were identified in January 2017. Six areas are the same as local authority areas, and 6 are smaller areas within the wider local authority area.
Figure 8: The opportunity areas
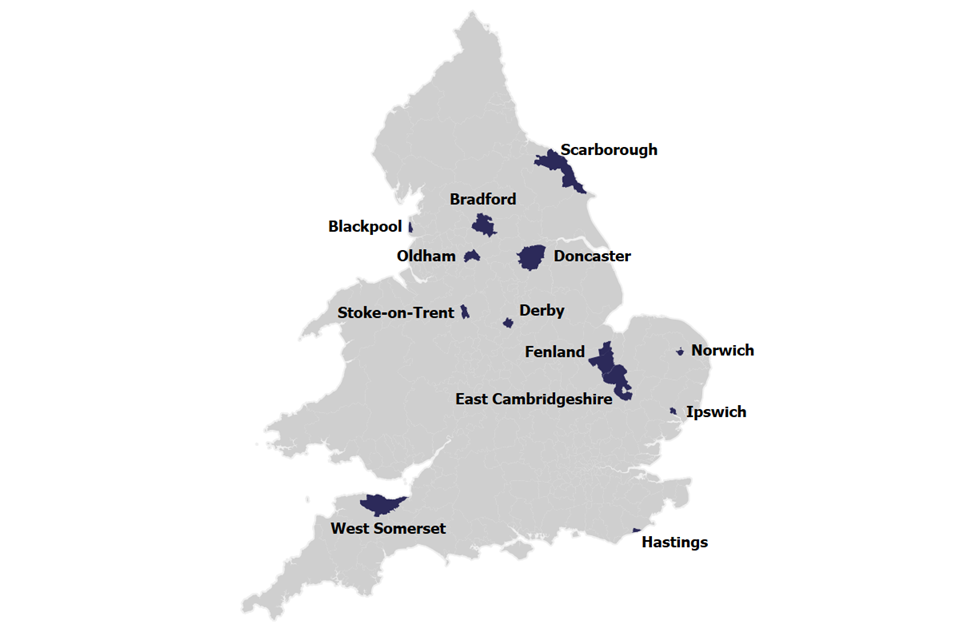
Opportunity areas are spread across England, from the South West to the North East
There are 949 state-funded schools located in opportunity areas. Of these, 934 had been inspected by Ofsted at the time the opportunity area was introduced.
As at 31 December 2018, 937 of these schools had been inspected and, 75% were good or outstanding at their most recent inspection compared to 85% of all schools. The lower percentage of good and outstanding schools in opportunity areas is to be expected as the areas were chosen on the basis of the problems they were experiencing.
5. Revisions to previous release
The provisional data in the previous release related to inspections that took place between 1 April 2018 and 31 August 2018, with the reports published by 30 September 2018. Revised data for inspections in this period is provided in table 1R and 2R of the Excel file accompanying this release.
This revised data includes an additional 6 full inspections that had not been published by 30 September but were published by 31 January 2019. All 6 resulted in an inadequate judgement.
The inclusion of these inspections resulted in a change to the percentage of inadequate schools, up from 9% to 10%.
Three of the additional inspections were of primary schools, 2 were of secondary schools and 1 was of a pupil referral unit.
Revisions to data in this publication are published in line with Ofsted’s revisions policy for official statistics.
6. Notes
Inspections are conducted under sections 5 and 8 of the Education Act 2005. The inspection framework was most recently revised on 1 September 2015. Ofsted introduced a common inspection framework for all settings on the Early Years Register, state-funded schools, non-association independent schools and further education and skills providers. An explanation of the main uses of this data, further contextual information and the arrangements for quality assurance is provided in the methodology. This report provides information about strengths and limitations of the statistics.
6.1 Comments and feedback
If you have any comments or feedback on this publication, please contact Louise Butler on 03000 131 457 or inspection.insight@ofsted.gov.uk.
7. Glossary
7.1 Academies
Academies are publicly funded independent schools. Academies do not have to follow the national curriculum and can set their own term times. They still have to follow the same rules on admissions, special educational needs and exclusions as other state schools.
Academies get money directly from the government, not the local authority. They are run by an academy trust, which employs the staff. Some academies have sponsors such as businesses, universities, other schools, faith groups or voluntary groups. Sponsors are responsible for improving the performance of their schools.
Academies include converter and sponsor-led academies, free schools, university technical colleges and studio schools.
7.2 Academy converters
Academy converters are schools which have opted to become an academy, most of which were good or outstanding local authority maintained schools before they became an academy.
Academy converters retain their latest inspection grade, even if the most recent inspection was of the predecessor school.
7.3 Sponsor-led academies
Sponsor-led academies are academies which have sponsors such as businesses, universities, other schools, faith groups or voluntary groups. Sponsors are responsible for improving the performance of their schools.
Sponsor-led academies are viewed as new legal entities and do not retain their inspection history.
7.4 Free schools
Free schools are funded by the government and are not run by the local authority. They are set-up on a not-for-profit basis by charities, universities, and community and faith groups, among others.
Free schools are ‘all-ability’ schools, so cannot use academic selection processes like a grammar school. They can set their own pay and conditions for staff and change the length of school terms and the school day. Free schools do not have to follow the national curriculum.
7.5 Local authority maintained schools
Maintained schools are funded by the government and run by the local authority. They must follow the national curriculum.
7.6 Short inspections
Most good schools now receive short inspections, as do outstanding nursery, pupil referral units and special schools. Short inspections are a one-day inspection visit and take place approximately every 4 years. A short inspection determines whether the school continues to provide the same good or outstanding standard of education for pupils. A short inspection does not result in individual graded judgements nor does it change the overall effectiveness grade of the school. If the school shows significant decline, a short inspection is converted to a full inspection, where inspectors will make the full set of graded judgements required under section 5.
From November 2017, around 20% of previously good schools are now subject to a full section 5 inspection instead of a short inspection, where our risk assessment tells us that a short inspection would be highly likely to convert. For example where a school underwent significant change, such as changing its age range, or where the quality of provision may have deteriorated significantly.
From January 2018 short inspections are only converted to a full inspection where there are serious concerns. Where a short inspection does not convert, there are additional outcomes where the school remains either good or outstanding but the next inspection will be a section 5 inspection.
7.7 Acknowledgements
Thanks to the following for their contribution to this statistical release: Oli Bayntun, James Jordan, Jay Kerai, and Clair Simpson.
-
As part of the 2011 Education Act, the government made outstanding primary and secondary schools exempt from routine inspections. ↩
-
In June 2018, following a consultation, we changed the way we report on inspection outcomes in our statistical datasets. The main change was to include the grades of schools that had since become academies in our statistics and analysis. These are called ‘predecessor schools’. ↩
-
Change of status or risk assessment inspections are section 5 inspections selected due to concerns or a change of status identified during risk assessment. These schools would have had a short inspection under the previous policy. ↩
-
Follow on concerns section 5 inspections are inspections of good schools where the outcome of the previous short inspection was for a ‘section 5 next’ as the school was potentially declining. ↩
-
Follow on improving section 5 inspections are inspections of good schools where the outcome of the previous short inspection was for a ‘section 5 next’ as the school was potentially improving. ↩
-
See the glossary for more information about short inspections. ↩
-
For related research on ‘stuck’ schools please see HMCI’s Annual Report ↩