Quality management of official statistics
Updated 30 July 2026
Applies to England

© Crown copyright 2026
This publication is licensed under the terms of the Open Government Licence v3.0 except where otherwise stated. To view this licence, visit nationalarchives.gov.uk/doc/open-government-licence/version/3 or write to the Information Policy Team, The National Archives, Kew, London TW9 4DU, or email: psi@nationalarchives.gov.uk.
Where we have identified any third party copyright information you will need to obtain permission from the copyright holders concerned.
This publication is available at https://www.gov.uk/government/publications/standards-for-official-statistics-published-by-the-department-for-education/quality-management-of-official-statistics
Overview
The statistics produced by the Department for Education (DfE) strive to be of good quality, one of the Code of Practice for Statistics principles. This note sets out the principles currently being embedded within the DfE to ensure we produce quality assured statistics.
DfE’s approach to quality in official statistics is to review the adequacy and plausibility of our work across the following 3 stages of statistical production:
- the data underlying our statistics (for example specification, upstream checks, data transfer, checks replication, missing or duplicated data, data range)
- the processes applied to this data (for example code review, basis for calculations or aggregations, calculations or aggregations tests, internal consistency, data standards)
- the insight resulting from these processes (for example plausibility over time, local variation, impact of changes, coherence, narrative)
The 3 stages are complemented by 4 cross-cutting enablers:
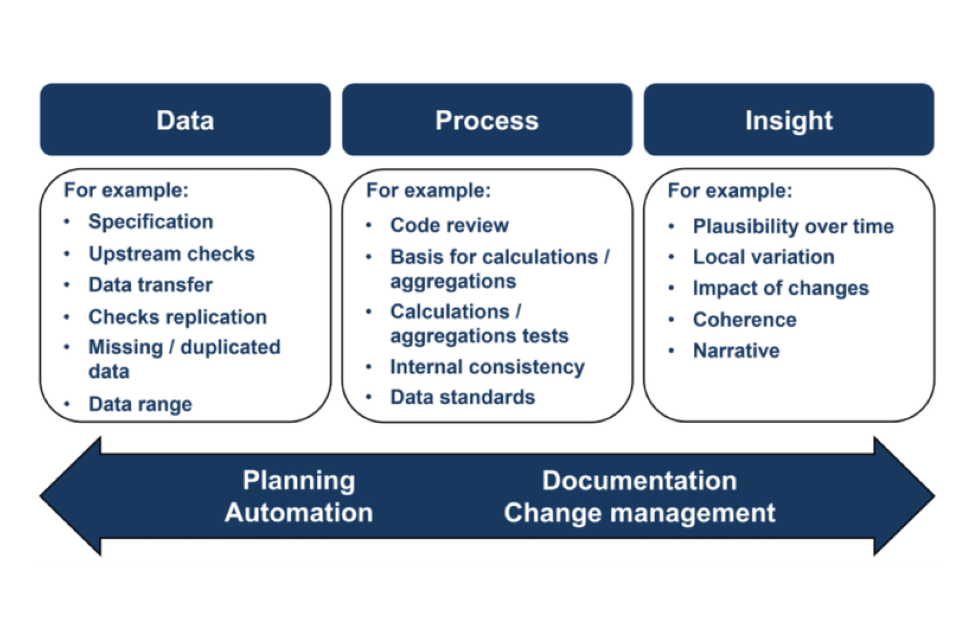
The 3 stages of statistical production
Data
Table 1 sets out examples of the quality assurance activities carried out on the data underlying our statistics.
Table 1: data
| Assurance area | Example activity |
|---|---|
| Specifications | To check that the data is according to specification: - specification with the data provider of what validation is applied at data input stage - change control on the specification (such as new metrics or new data source) |
| Upstream checks | To check that there is a shared understanding of quality with the data provider where applicable: - an automated report from data providers outlining what checks have been done - assurance that any changes have been tested - business rules for data suppliers that they confirm they have followed |
| Data transfer | To check that the data has been transferred as expected: - automated checks on numbers of rows or columns, or file size |
| Checks replication | To check that quality assurance done by the data provider can be replicated: - assuring agreement with validation of the most essential field |
| Missing or duplicated data | To check that missing or duplicated data is dealt with appropriately to avoid errors: - automated checks on missing values -automated checks on unique identifiers compared to row counts |
| Data ranges | To check that the data is within expected range: - automated checks on minimum, maximum, average, top X or bottom X values - distribution plots to highlight outliers, including scatterplots to see changes cross years, such as level data in current and previous year |
Process
Table 2 sets out examples of the quality assurance activities carried out on the processes applied to our data.
Table 2: process
| Assurance area | Example activity |
|---|---|
| Code review | To ensure that any code has been appropriately reviewed: - peer review of code (internally or externally) - dual running processes if there is any significant change, ensuring any differences are understood before accepting them |
| Basis for aggregations or calculations | To check that calculations are done on the correct basis: - checking the underlying numbers of rows used in calculations (such as children, pupils, schools) are consistent with previous years - checking filters are correct - checking how calculations take missing values into account or gross up for missing data if appropriate - documenting methodology |
| Calculations or aggregations tests | To ensure that calculations are working as expected: - checking that calculations give the previous year or year’s results if applied to previous year’s data - manual spot checks against source data |
| Internal consistency | To ensure all outputs are consistent with each other: - checking logic between different metrics where applicable (for example, exam pass rate is lower than entry rate) - checking data matches between different type of outputs (such as underlying data, graphs, tables, commentary) |
| Data standards | To ensure all outputs follow high standards: - using open data standards automated data screeners |
Insight
Table 3 sets out examples of the quality assurance activities analysts carried out on the resulting statistics and insights.
Table 3: insight
| Assurance area | Example activity |
|---|---|
| Plausibility over time | To ensure headline metrics are plausible over time: - plotting time series, summary tables and chart - comparing level of change in latest year with historic levels of year-on-year changes |
| Local variation | To check that local variation does not suggest underlying data quality concerns: - scatterplots of level of change at an appropriate level of geography - for example, a scatterplot of this year vs last year, at local authority level |
| Impact of changes | To check if known changes have had the expected impact on trends: - checking that changes in data collection, assessment or policy have impacted trends in the direction we reasonably expect |
| Coherence | To check that the insight from the statistics is coherent externally: - checking direction of travel against other sources - checking that the trend is consistent with expectations and sector knowledge |
| Narrative | To check that the commentary in the statistics is accurate: - checking all figures in the release text are accurate check the description of trends is factual and accurate - making sure quality issues are flagged as appropriate in the release, and methodology information published alongside the release |
The 4 cross-cutting enablers
The 3 stages are complemented by 4 cross-cutting enablers:
Planning
All producers should have a plan for how they will manage quality across their processes. This will include:
- a quality assurance plan or sign-off plan
- additional planning for any new content, metrics or data
- organising an external review where appropriate
- using lessons learnt meetings and user feedback to inform continuous improvement
Automation
There is a clear expectation in DfE that any analyst producing statistics should be familiar with and implementing Reproducible Analytical Pipeline (RAP) principles, meeting at least the department’s definitions of “good” and “great” practice. These RAP principles, and the baseline expectation, are as follows:
- RAP good practice (baseline expectation):
- use appropriate tools
- sensible folder structure
- files meet data standards
- processing done with code
- automated high-level checks
- source data is acquired and stored sensibly
- documentation
- RAP great practice (baseline expectation):
- recyclable code for future use
- version controlled final code scripts
- publication-specific automated sense checks
- dataset production scripts
- automated reproducible reports
- peer review of code
- RAP best practice (ambition):
- clean final code
- collaboratively developed code using Git
- whole pipeline can be run from a single script or workflow
- peer review of code from outside the team
- publication-specific automated summaries
- use open source repositories
Specifically, the principles outline the following expectations on automated quality assurance:
- RAP good practice: automated high-level checks
- RAP great practice: publication specific automated sense checks
- RAP great practice: automated reproducible reports
- RAP best practice: publication specific automated summaries
Documentation
Quality assurance activity should be well documented by teams.
All statistical publications will have a methodology document published on its Explore Education Statistics (EES) webpage.
Further internal documentation will include:
- quality assurance statements from data providers
- internal specifications and methodology documentation
- version control and code annotations
Change management
Continuously developing our statistics means we will often need to ensure changes have been implemented correctly. Change management includes:
- assessment of risks, including risk and issues logs
- assessment of the impact of revisions
- checking there are no additional unexpected changes, for example, no changes have been incorrectly applied to previous years
- getting sign-off on changes
Other information
This document will be reviewed annually.
As well as this overarching quality management document, all statistics published on EES include a published methodology.
Quality assurance training is offered to all new analysts as well as those who have never done quality assurance before. Guidance and learning and development resources are available to all, including non-analysts.
Senior responsible owners (SROs) and statistics production leads should allocate appropriate resource to each stage of the statistics production process. Quality assurance processes should be designed to be proportionate to the task.
The quality assurance of official statistics sits alongside the wider DfE Quality assurance framework for all analysis carried out in the department. DfE published the Quality assurance maturity model designed to support government departments and relevant arm’s-length bodies to assess and improve quality assurance practices in line with the Aqua book guidance.