SPI-M-O: Summary of modelling on roadmap scenarios, 17 February 2021
Updated 13 May 2022

© Crown copyright 2022
This publication is licensed under the terms of the Open Government Licence v3.0 except where otherwise stated. To view this licence, visit nationalarchives.gov.uk/doc/open-government-licence/version/3 or write to the Information Policy Team, The National Archives, Kew, London TW9 4DU, or email: psi@nationalarchives.gov.uk.
Where we have identified any third party copyright information you will need to obtain permission from the copyright holders concerned.
This publication is available at https://www.gov.uk/government/publications/spi-m-o-summary-of-modelling-on-roadmap-scenarios-17-february-2021/spi-m-o-summary-of-modelling-on-roadmap-scenarios-17-february-2021
1. This document is a summary of modelling by the University of Warwick and Imperial College London. It is an update to a paper presented at SAGE on 11 February and has been discussed by SPI-M-O and signed off by chairs on behalf of the committee.
Summary
2. In line with previous modelling, the additional scenarios that SPI-M-O have been asked to model would be highly likely to result in a substantial number of hospital admissions and deaths.
3. The scale and timing of these resurgences are critically dependent on very uncertain modelled assumptions, including real world vaccine effectiveness against severe disease and infection; vaccine coverage and rollout speed; behavioural factors; and the extent to which baseline measures (which could be voluntary) continue to reduce transmission once restrictions are lifted. Given this uncertainty, it would be advisable to tie changes in policy to data instead of dates.
4. Although all modelled scenarios are uncertain throughout, the uncertainty is greater the further into the future. Depending on policies, SPI-M-O is much more confident in the modelled outcomes to the end of May than beyond. Increasing data on vaccine performance will reduce this uncertainty.
5. Under the most optimistic set of assumptions modelled, and assuming that baseline measures once restrictions are lifted significantly reduce transmission compared to a return to pre-COVID-19 behaviours, both groups estimate that at least a further 30,000 COVID-19 deaths would occur under the new scenarios. This is similar to their estimates for the previously modelled scenarios 3 and 4.
6. In some iterations of the new scenarios, prevalence is higher over spring and summer than was suggested in scenarios 3 and 4, resulting in a longer period of hospital pressure but with the potential for a smaller autumn wave once all restrictions are lifted. SPI-M-O, however, have low confidence in the exact shape that might result from these scenarios with a risk of higher prevalence being more concentrated at either early or later stages in the scenarios.
7. Resurgences occur because there are still many people in vulnerable groups who do not have protection; neither directly (because they have not been vaccinated, or because their vaccination has not prevented them from becoming infected then ill) nor indirectly from wider population immunity (because many younger age groups have not yet been vaccinated or infected, and because vaccines are unlikely to entirely block infection and transmission).
8. The combination of a gradual approach to the easing of restrictions could, however, if vaccines are highly effective and rapidly rolled out and longer-term baseline measures remain in place, achieve a significant reduction in transmission, keeping further resurgences well below the level of those seen in January 2021.
9. It would take a minimum of 3 weeks after lifting one set of restrictions to determine whether it is safe to take the next step. The lower the prevalence when a relaxation step is taken, the more capacity and time there would be to respond if it becomes apparent that the relaxation of measures is leading to an unsustainable rise in hospital admissions.
10. Maintaining baseline measures to reduce transmission once restrictions are lifted is almost certain to save many lives and minimise the threat to hospital capacity. These could include voluntary measures as well as effective Test, Trace and Isolate.
11. Hospital occupancy is still very high and will remain so for a significant length of time. SPI-M-O’s medium-term projection of hospital occupancy in England on 8th March is between 5,900 and 9,200[footnote 1].
12. Seasonality of SARS-CoV-2 is not included in the baseline modelling presented here. This is because the nature and extent of seasonal factors are unclear. While the potential effect of viral transmission being lower in the summer months and higher in the winter months is complex and hard to determine, sensitivity analysis is presented later in this paper to explore what the potential impacts might be.
Key changes since the paper of 11 February:
- Two further scenarios for relaxation have been modelled. These consist of 4 relaxation steps. These scenarios are not government policy and will likely differ from the eventual policy decisions made. Together with the scenarios presented in the paper from 11th February, they highlight key findings and uncertainties that should be taken into account when considering the relaxation of interventions as vaccines are rolled out.
- Details of these additional scenarios are provided in Appendix 1.
- The vaccine rollout that has been modelled follows a Cabinet Office agreed scenario. It is slower than the scenario modelled in 11th February paper.
Key assumptions
Rollout speed
These are based on 2 scenarios, provided by the Cabinet Office, that may not reflect the situation most likely to occur. These reach 4.0m per week from 25 April, continue at 3.9m per week in May and then are either sustained at this level (faster scenario) or drop down to 2m per week from 21 June (slower scenario).
Compliance:
The same in each Tier as in autumn 2020.
Vaccine reduction in risk of infection**
| Central | Pessimistic | |
|---|---|---|
| First dose | 48% | 24% |
| Second dose | 60% | 30% |
Vaccine reduction in risk of of hospital admission or death [footnote 2]
| Central | Pessimistic | |
|---|---|---|
| First dose | 70% | 56% |
| Second dose | 88% | 70% |
Coverage achieved
| Central (Warwick) | Pessimistic (Warwick)/ Single scenario (Imperial) | |
|---|---|---|
| Over 80s | 95% | 95% |
| 50-80 year old | 85% | 85% |
| Under 50s | 85% | 75% |
13. Both groups considered 2 scenarios (named “central” and “pessimistic”) for vaccine efficacy based on data from trials, and 2 or 3 scenarios for transmission under baseline measures once all other measures have been lifted. Warwick considered 2 scenarios for vaccine coverage. Efficacy assumptions given here are those used by Warwick; those used by Imperial were slightly different. A full set of assumptions is given in Appendix 2.
How these scenarios were modelled?
14. There is considerable uncertainty in the extent of transmission in each step of the scenarios. Modelling cannot precisely predict how people will behave at each stage of relaxation, nor precisely how that behaviour will affect transmission.
15. The details of specific policies cannot be robustly modelled. Instead the steps are modelled with reference to rates of transmission under different autumn Tiers, adjusted for the greater transmissibility of the B.1.1.7 variant and consideration of how each modelled stage differs from the restrictions that applied in previous Tiers. Methodological details are given in the accompanying modelling papers from each group.
Effect of allowing indoor mixing in step 2
16. The scenarios that were commissioned include allowing indoor contact with 1 guest per household per day in step 2. This is a major change to the previous Tier system. It is a particularly key source of uncertainty in this modelling, but it has the potential of a resulting large increase in transmission.
17. Previous SPI-M-O modelling of different patterns of household mixing shows that a lower risk way of permitting greater indoor mixing in step 2 would be to adopt a form of exclusive bubbles, instead of allowing different people to mix each day [footnote 3].
Results
18. Figure 1 shows the results of the central scenarios for the Imperial (left) and Warwick (right) models for the 4 previously commissioned scenarios (purple = 1, blue = 2, red = 3, yellow = 4) and the new scenario 5a (green), assuming significant reduction in transmission as a result of baseline measures after step 4 [footnote 4].
Figure 1: England hospital bed occupancy in the Imperial (left) and Warwick (right) models assuming central vaccine effectiveness (for Warwick, 88% effectiveness against disease and 60% effectiveness against infection after 2 doses; similar for Imperial); 3.9m doses per week from 3rd May; and significant reduction in transmission from baseline measures). Colours represent the different scenarios (purple = 1, blue = 2, red = 3, yellow = 4, green = 5a).
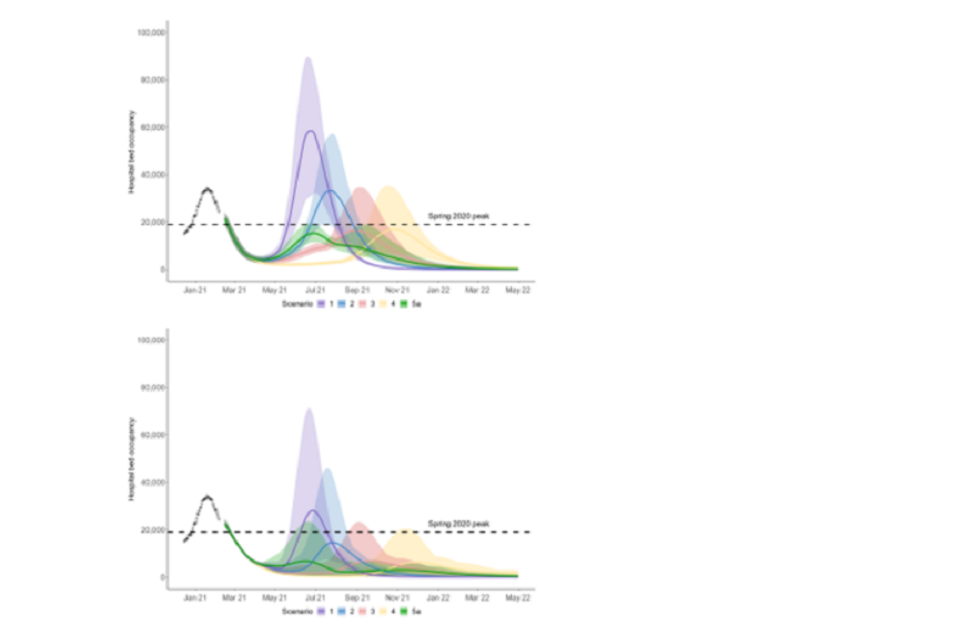
19. This shows a significant increase in mortality and morbidity as restrictions are relaxed. Imperial estimate 33,200 to 81,200 additional COVID-19 deaths between 12th February 2021 and 30th June 2022 in this scenario. This is in line with Warwick ’s central estimates although their confidence intervals are narrower.
20. The combination of a gradual approach to the easing of restrictions could, however, if vaccines are highly effective and rapidly rolled out and longer-term baseline measures achieve a significant reduction in transmission, keep further resurgences well below the level of those seen in January 2021.
21. Prevalence in scenario 5 (and therefore hospital occupancy) is higher in summer than in the previously scenarios 2 and 3 as the first 2 steps happen more quickly. This means that fewer people are still susceptible at step 4. Tying the timing of the final step to the date at which the whole population have been offered at least one dose, limits the height of the second peak compared to easing restrictions earlier.
22. SPI-M-O have low confidence that the peak hospital occupancy would necessarily be lower in the new scenarios than in scenarios 3 and 4, as implied by these results. Such a finding would be highly dependent on the modelling assumptions used. Attempting to sustain high prevalence during vaccine rollout would run the risk of an extremely large resurgence that could require reimposition of restrictions to protect hospitals.
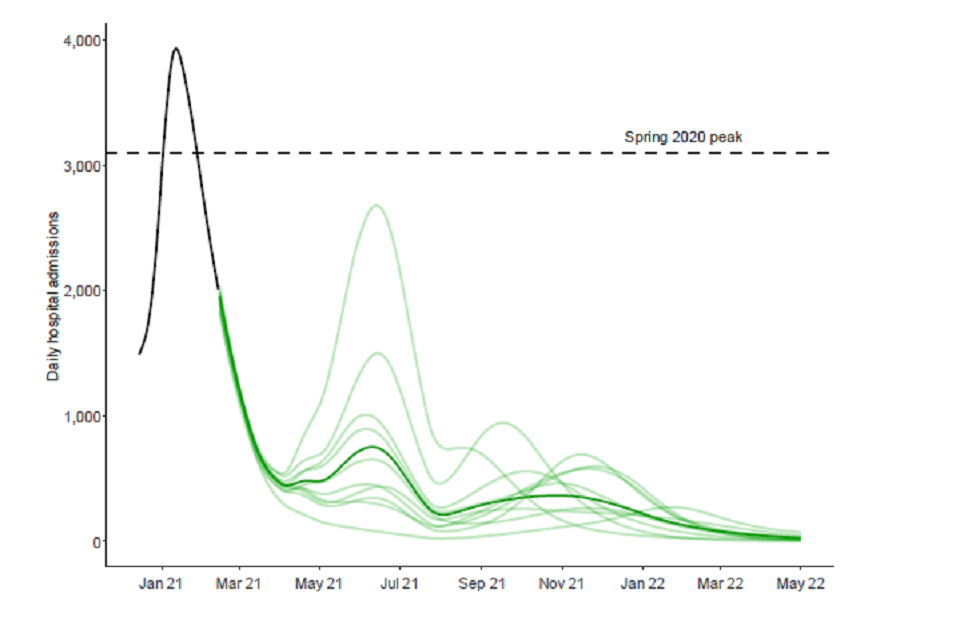
23. This is illustrated by Figure 2, where a sample of trajectories from individual model runs of scenario 5a in the Warwick model are shown under the same optimistic assumptions as in Figure 1. Each iteration is given by a different light green line and the dark green line is the median of the distribution. There is substantial variation in trajectories, each of which are consistent with the modelled assumptions; some of them result in very large summer waves, and others with winter resurgences.
Figure 2: England hospital bed admissions in the Warwick model, assuming central vaccine effectiveness (for Warwick, 88% effectiveness against disease and 60% effectiveness against infection after 2 doses; similar for Imperial); 3.9m doses per week from 3rd May; and significant reduction in transmission from baseline measures. Each light green line represents an individual model run of scenario 5a with the dark green line showing the median of the distribution.
24. There are only 3 weeks between steps 1 and 2 in the new scenarios. It is unlikely that this would allow the effect of step 1 to be clearly discernible before step 2 takes place. The combined effect of both steps will not come into effect until after the school Easter holidays. It would be a risky strategy to take such significant steps in close succession, especially starting from a point where prevalence is still high and there are many patients in hospital.
25. The relative merits of tying the date of the third step to JCVI cohorts 1-4 getting 2 doses compared to cohorts 1-9 getting 1 dose would depend on the precise dates these occur. That in turn will depend on uptake and many logistical factors that SPI-M-O cannot accurately determine. In general, taking this step at the later date would result in fewer hospital admissions and deaths, and would give longer to determine the effect of step 2. Under the rollout and uptake assumptions used here, step 3 happens at a similar time in each of the new scenarios (which may not be the case in reality), so each shows similar results.
Sensitivity to transmission once restrictions are lifted
26. SPI-M-O do not know the extent by which transmission could be reduced by long term mitigation measures (which may be partially or exclusively voluntary). As previously advised by SPI-M-O, maintaining a large reduction in transmission from such measures after step 4 is taken is almost certain to reduce the size of the subsequent resurgence.
Figure 3: England hospital bed occupancy in the Imperial (left) and Warwick (right) models assuming
central vaccine effectiveness (for Warwick, 88% effectiveness against disease after 2 doses and 60% effectiveness against infection after 2 doses; similar for Imperial); 3.9m doses per week from 3rd May; and little reduction in transmission from baseline measures (light green area) compared to significant reduction in transmission from baseline measures (dark green area) under scenario 5a.
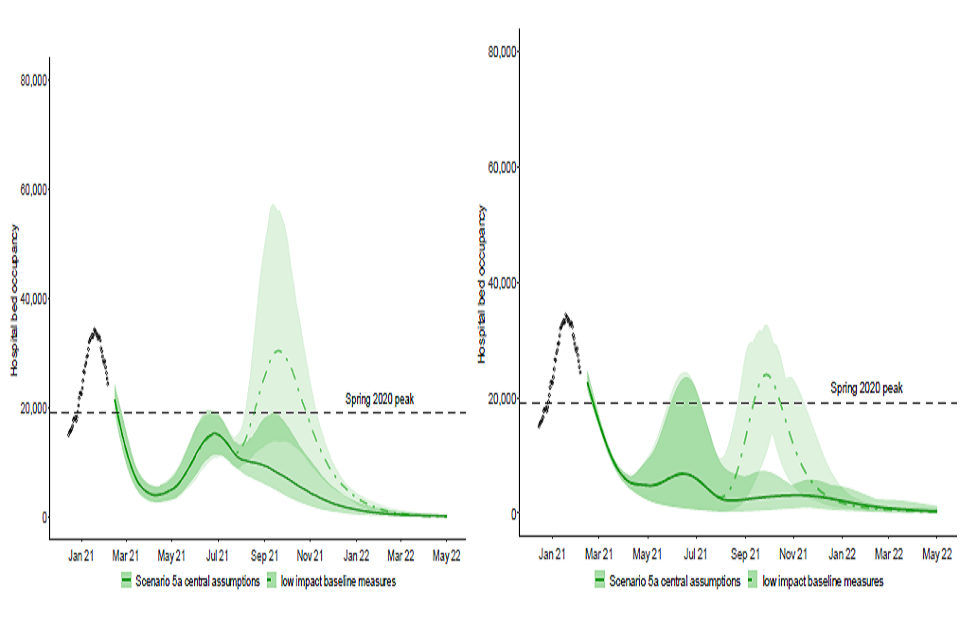
27. This is illustrated by Figure 3. The dark green areas are the same scenarios as seen in Figure 1, but the light green areas (with dashed centre line) assume baseline measures result in only a small reduction in transmission compared to pre-COVID-19 patterns of mixing [footnote 5]. The new scenarios show a substantial resurgence in hospital occupancy that is comparable with the January 2021 peak. Imperial estimate a further 58,900 to 143,400 deaths between 12th February 2021 and 30th June 2022 in this scenario.
28. In the scenario shown in Figure 3 the peak height is either broadly comparable to that in scenarios 3 and 4 (Warwick) or somewhat lower (Imperial).
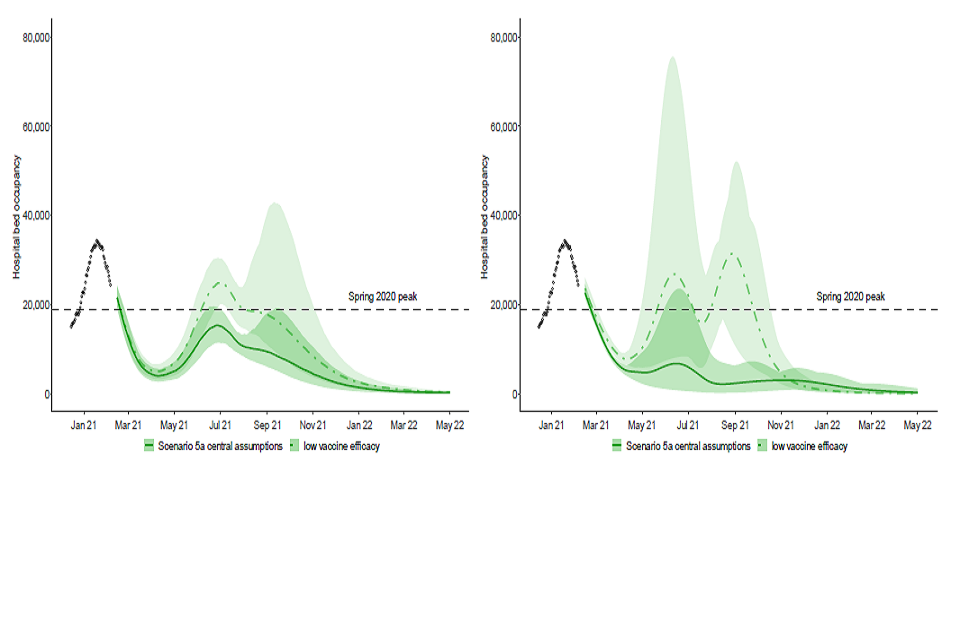
Sensitivity to vaccine effectiveness
29. As with SPI-M-O’s previous work the results of the new scenarios are critically dependent on their vaccine effectiveness assumptions. If the real-world performance of the vaccines is not as good as the assumptions used here, the subsequent resurgence would be larger.
30. The dark green areas in Figure 4 show the same scenario as in Figure 1, whereas the light green areas assume plausible but more cautious vaccine effectiveness of 70% against disease and 30% against infection [footnote 6]. This shows that despite the high uptake and rapid vaccine rollout, the subsequent resurgences in new scenarios are similar in scale to those seen in January 2020.
Figure 4: England hospital bed occupancy in the Imperial (left) and Warwick (right) models assuming
lower vaccine effectiveness (for Warwick, 70% effectiveness against disease and 30% effectiveness against infection after 2 doses; similar for Imperial); 3.9m doses per week from 3rd May; and significant reduction in transmission from baseline measures) under scenario 5a.
Sensitivity to rollout speed
31. Steps 3 and 4 of the new scenarios are tied to the points at which different cohorts have been vaccinated, not pre-determined dates. For that reason, the size of the subsequent resurgences are similar in either the faster or slower scenarios, although their timings differ.
Why are the resurgences so high in these scenarios?
32. There are still many people in vulnerable groups who do not have protection; neither directly (because they have not been vaccinated or because their vaccination has not prevented them from becoming infected then ill) nor indirectly from wider population immunity (because many younger age groups have not yet been vaccinated or infected).
33. The herd immunity threshold for COVID-19 with the B.1.1.7 variant is unknown, but is likely to be high. Only around 79% of the population are adults, so even if coverage amongst them is 79%, only 62% of the population would be vaccinated. As the vaccines do not completely prevent transmission, the reduction in transmission that results would be expected to be lower than 62%[footnote 7]. As a result, herd immunity is not likely to be reached in these scenarios without a further resurgence of transmission.
34. There are a very large number of older and more vulnerable people living in England. A small proportion of them will not be vaccinated and others will be vaccinated but would still be seriously ill, if infected. If many people are infected once restrictions are lifted, it is highly likely that many people will die or be hospitalised, though significantly fewer than in a scenario where vaccines had not been available.
35. This is illustrated by Figure 5, which shows how population level protection changes over time. From bottom to top the proportion of the population who are: protected against re-infection having previously been infected; protected against infection having previously been infected and vaccinated; protected against infection having been vaccinated; protected against severe disease but not infection following vaccination; and unprotected despite vaccination.
Figure 5: Changes in population level protection over time in the Imperial model, assuming 79% overall uptake, weighted average of 84% protection against severe disease, and 69% weighted average of protection against infection. From bottom to top, the proportion of the population who are: protected against re-infection having previously been infected; protected against infection having previously been infected and vaccinated; protected against infection having been vaccinated; protected against severe disease but not infection following vaccination; and unprotected despite vaccination.
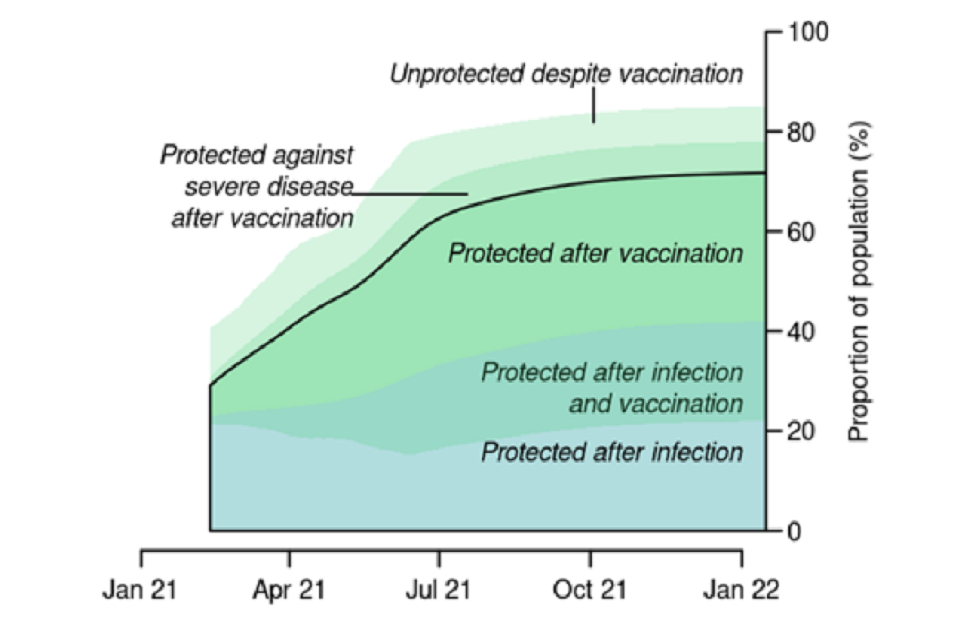
36. The precise form of Figure 5 would depend on the assumptions used (which in these scenarios include no waning of immunity), as well as the rollout speed and estimates of the proportion of the population who are protected from previous infection. This, however, demonstrates that even with the high uptake and vaccine effectiveness modelled, a large proportion of the population can still be infected. In this scenario, therefore, herd immunity is only achieved once many more people are infected over the course of the year (note that the combined green and blue shaded areas grow significantly over time as people are infected and/or vaccinated).
37. Figure 5 also demonstrates that, under the 3.9m per week rollout assumption (scenario 5), the levels of protection are very similar to the previous scenarios 3 and 4 at the point of lifting restrictions (5th July in scenario 3, 2nd August in scenario 4, and 16th July in scenario 5). This explains the similar peak heights in scenarios 3 and 4, and the slightly lower peaks in scenarios 5a and 5b that, as previously mentioned, are the result of a greater proportion of the population being infected earlier.
Seasonality
38. The extent of any seasonal patterns in transmission (either intrinsic to the biology of SARS-CoV-2 or as a result of behavioural factors) is not yet clear and so is not included in these models as a baseline.
39. As a sensitivity analysis, each group has incorporated seasonal variation into their models. Figure 6 shows one representative set of results from this sensitivity analysis [footnote 8]. Here the black line shows the results of the Warwick model for scenario 5a with little transmission reduction from baseline NPIs, the fast rollout timeline, and no seasonal effect. The blue, green, and red lines represent 6%, 14%, and 25% seasonality [footnote 9].
40. This demonstrates that in this set of scenarios, the effect of seasonality reduces prevalence over the summer, but then increases the height of the peak of the autumn resurgence (6% and 14% scenarios) or delay it (25% scenarios). Such patterns, however, are not replicated in all the sensitivity analyses run.
Figure 6: Results of the Warwick model of scenario 5a assuming no seasonality (black), 6% seasonality (blue), 14% seasonality (green) and 25% seasonality (red). Assumes 3.9m doses per week from 3rd May; 2nd dose vaccine effectiveness against disease of 88%; 2nd dose vaccine effectiveness against infection of 60%; and little reduction in transmission from baseline measures.
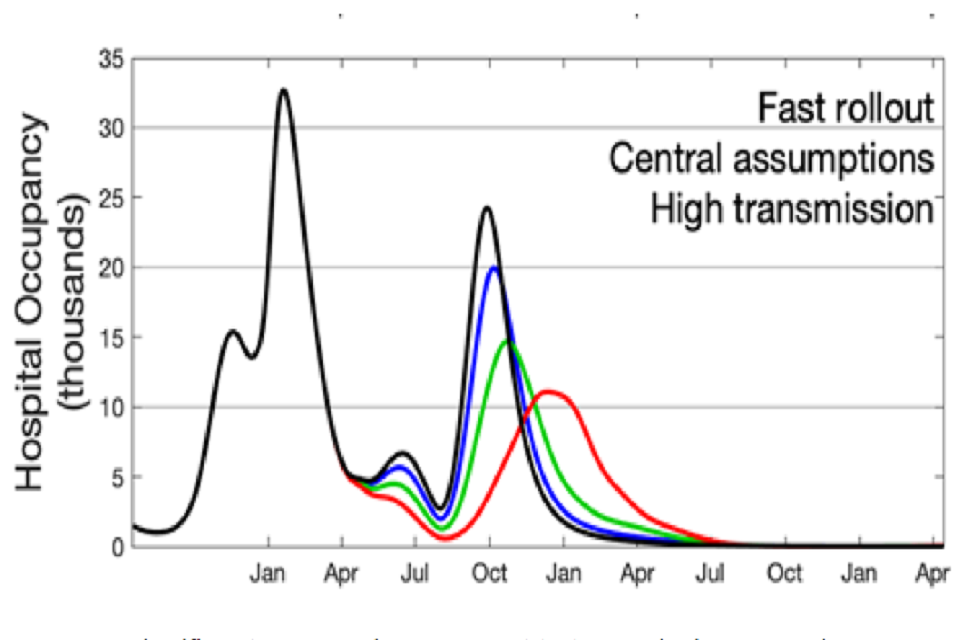
41. If there were a significant seasonal component to transmission, prevalence may be lower over the summer months than suggested by the baseline modelling results, but at the cost of a larger autumn/winter resurgence.
Efficacy versus effectiveness.
42. It is usually observed that the impact of a vaccination when applied in the community is less than that measured under trial conditions. This difference is captured in the 2 words efficacy (measured under trials conditions) and effectiveness (observed in communities)[footnote 10]. The central assumptions used here are from vaccine efficacy trials data and are, therefore, optimistic estimates for effectiveness in the community.
Implications of uneven vaccine coverage
43. These models do not account for vaccination coverage being different in different communities. Early evidence suggests that coverage has, so far, been lower in some minority ethnic groups. As a result, even if vaccination successfully drives down mortality and morbidity overall, it is highly likely that outbreaks will still happen in some communities.
Emergence of vaccine escape mutants
44. These models assume that the effectiveness of vaccines will remain high. Emergence of vaccine escape mutants would lead to decreasing efficacy. Whilst new vaccines can be developed, this will take many months.
Waning immunity
45. These models assume that neither naturally acquired nor vaccine induced immunity wane. Immunity to other coronaviruses is known to wane.
Spatial heterogeneity
46. These models have focussed on the national average. There is the possibility of significant divergence regionally, if the epidemic grows as observed in early autumn 2020. It is possible to have, what appears to be a controlled national scenario alongside a large regional epidemic.
Appendix 1: Scenarios Modelled
Four scenarios commissioned for 11th February paper:
| Schools open | Tier 3 | Tier 2 | Tier 1 | Baseline measures | |
|---|---|---|---|---|---|
| Scenario 1 | 8 March | 29 March (merged with Tier 2) | 29 March (merged with Tier 3) | n/a | 26 April |
| Scenario 2 | 8 March | 29 March | 19 April | 10 May | 31 May |
| Scenario 3 | 8 March | 5 April | 3 May | 7 June | 5 July |
| Scenario 4 | 8 March (primary) 5 April (all) | 3 May | 7 June | 5 July | 2 August |
Scenario 5 commissioned, for 11th February paper. Summary details only:
Step 1: Three weeks after 1-4 first dose
- Schools return
Step 2: 29 March
- Non-essential retail
- Outdoor attractions
- Outdoor sport and leisure facilities
- Outdoor hospitality
- Rule of 6 or 2 households outside
- 1 guest per day per household inside
Step 3: Either;
Scenario 5a: Three weeks after everyone in JCVI groups 1-9 received 1st dose
Scenario 5b: Three weeks after everyone in JCVI groups 1-4 received 2nd dose**
- Indoor hospitality
- Indoor entertainment
- Indoor leisure
- Personal care
- 15 person limit advised outside (guidance only)
- Rule of 6 or 2 households advised inside (guidance only)
- Large events (outdoor only) 50% capacity - limit of 2,000
Step 4: After all adults are vaccinated
Full unlock with long-term mitigations
Appendix 2: Model assumptions
Vaccine reduction in risk of infection (all ages)
Imperial College
| Central | Pessimistic | |
|---|---|---|
| AZ 1 dose | 63% | 50% |
| AZ 2 dose | 63% | 50% |
| PF 1 dose | 65% | 55% |
| PF 2 dose | 94% | 90% |
Warwick
| Central | Cautious | |
|---|---|---|
| 1 dose | 48% | 24% |
| 2 dose | 60% | 30% |
Based on a weighted average of the 2 vaccines.
Vaccine reduction in risk of disease (all ages)
Imperial College
| Central | Pessimistic | |
|---|---|---|
| AZ 1 dose | 63% | 50% |
| AZ 2 dose | 63% | 50% |
| PF 1 dose | 65% | 55% |
| PF 2 dose | 94% | 90% |
Warwick
| Central | Cautious | |
|---|---|---|
| First dose | 70% | 56% |
| Second dose | 88% | 70% |
Based on a weighted average of the 2 vaccines.
Vaccine reduction in risk of hospitalisation admission or death (all ages)
Imperial College
| Central | Pessimistic | |
|---|---|---|
| AZ 1 dose | 80% | 70% |
| AZ 2 dose | 80% | 70% |
| PF 1 dose | 86% | 55% |
| PF 2 dose | 98% | 90% |
Warwick
not modelled separately; captured by vaccine reduction in risk of disease.
Time to full vaccine protection
Imperial College
3 weeks (dose 1), 1 week (dose 2).
Warwick
2 weeks.
Rollout speed (England basis)
Imperial College
Per Cabinet Office scenario:
Average of 2.4m per week in England until 25th April; after which:
- Fast: average of 3.9m per week after
- Slow: average of 3.4m per week until 20th June; then 2m per week onwards
Warwick
Per Cabinet Office scenario:
Average of 2.4m per week in England until 25th April; after which:
- Fast: average of 3.9m per week after
- Slow: average of 3.4m per week until 20th June; then 2m per week onwards
Vaccine prioritisation
Imperial College
Per JCVI ordering.
Do not separately model health care workers, (non-care home) social workers and individuals at greater clinical risk who may be prioritised for vaccination. Explicit modelling of these groups would mean “Step 3” and “Step 4” of scenarios 5a and 5b happening later than assumed here.
Warwick
Per JCVI ordering
Coverage achieved (all ages)
Imperial College
| Group | |
|---|---|
| Over 80s | 95% |
| 50-80 year old | 85% |
| Under 50s | 75% |
| Care home residents | 95% |
| Care home workers | 85% |
Warwick
| Central | Cautious | |
|---|---|---|
| Over 80s | 95% | 95% |
| 50-80 year old | 85% | 85% |
| Under 50s | 85% | 75% |
Variants
Imperial College
No impact of novel variants other than B.1.1.7.
Warwick
No impact of novel variants other than B.1.1.7.
R until easing
Imperial College
0.75 (as of mid-February 2021).
Warwick
0.75 (as of mid-February 2021).
Seasonality
Imperial College
None.
Warwick
None.
Waning immunity
Imperial College
None over the timescale modelled.
Warwick
None over the timescale modelled.
School holidays
Imperial College
Not modelled.
Warwick
Modelled.
Effect of long-term baseline measures to reduce transmission
Imperial College
Moderate adherence to baseline NPIs (central scenario): R excl_immunity ~ 3.
Low adherence to baseline NPIs: R excl_immunity ~ 4.
This compares to an unmitigated R0 (equivalent to R excl_immunity with pre-COVID-19 behaviour) of around 4.5.
Warwick
Low transmission scenario: R excl_immunity ~ 3.2
High transmission: R excl_immunity ~ 4
-
Interquartile range of the distribution estimated based on data available on 16th February. ↩
-
Imperial College use slightly different assumptions for vaccine effectiveness. Further detail is given in Appendix 2. ↩
-
SPI-M-O Statement on “Bubbles” – 13th May 2020. ↩
-
Here baseline measures reduce the reproduction number (excluding the effect of naturally acquired or vaccine produced immunity) of the B.1.1.7 variant from around 4.5 in an unmitigated state to the equivalent of around 3.0 (Imperial) or 3.2 (Warwick). ↩
-
Here baseline measures reduce the reproduction number (excluding the effect of naturally acquired or vaccine produced immunity) of the B.1.1.7 variant from around 4.5 in an unmitigated state to the equivalent of around 4.0. ↩
-
Warwick’s assumptions given here; Imperial’s are comparable but slightly different. See Appendix 2 ↩
-
This is addition to the transmission reduction from unvaccinated people who have previously been infected. Transmission is not uniform across ages and demographics, so the extent to which vaccines reduce transmission will depend on who is vaccinated, not just how many people. ↩
-
Further sensitivity analyses are given in the accompanying full modelling papers. ↩
-
Details given in accompanying paper. Here % reduction refers to peak to trough variation in the transmission parameter. Whilst the extent of seasonality is currently unknown expert judgement would favour 6% or 14% over 25%. ↩
-
https://www.gavi.org/vaccineswork/what-difference-between-efficacy-and-effectiveness ↩