SPI-M-O: Summary of modelling on easing restrictions, 3 February 2021
Updated 20 May 2022

© Crown copyright 2022
This publication is licensed under the terms of the Open Government Licence v3.0 except where otherwise stated. To view this licence, visit nationalarchives.gov.uk/doc/open-government-licence/version/3 or write to the Information Policy Team, The National Archives, Kew, London TW9 4DU, or email: psi@nationalarchives.gov.uk.
Where we have identified any third party copyright information you will need to obtain permission from the copyright holders concerned.
This publication is available at https://www.gov.uk/government/publications/spi-m-o-summary-of-modelling-on-easing-restrictions-3-february-2021/spi-m-o-summary-of-modelling-on-easing-restrictions-3-february-2021
Introduction
1. This document provides a summary of the latest work from SPI-M-O, modelling of the potential for relaxation of restrictions as vaccines are rolled out. It should be read in conjunction with papers from Warwick University and Imperial College London, presented at SAGE on 4 February, and SPI-M-O’s previous summaries of vaccination modelling [footnote 1].
2. SPI-M-O have previously advised that:
- Relaxation of current restrictions would be safer the lower the prevalence and hospital occupancy reached before any relaxations commence. This would give greater headroom to rapidly respond, if the relaxation of measures leads to an unsustainable increase in hospital admissions. Lower prevalence of infection will also reduce the risk of new variants evolving. Hospital occupancy is still very high and will remain so for a significant length of time. SPI-M-O’s medium-term projection for hospital occupancy in England on 8 March is between 5,600 to 12,100 [footnote 2].
- Relaxation of current restrictions would be safer the greater the proportion of people who have been vaccinated at that point.
- Allowing R to go above 1 will lead to a further epidemic resurgence unless vaccines are highly effective at reducing transmission and they have been rolled out to an extremely high proportion of the adult population.
- Vaccines do not provide perfect protection and coverage will not reach 100% of vulnerable groups so there is potential for such a resurgence to be very large.
Assumptions and sensitivity
3. Although our understanding of the effectiveness of vaccines is rapidly improving, there are still many uncertainties that will determine the pace at which government can safely relax restrictions. Furthermore, it is impossible to precisely predict how specific policies will change transmission. For that reason, it is much less likely that hospital admissions will reach unsustainable levels if measures are relaxed based on data and the situation at the time, rather than at pre-determined dates. The table in the Appendix summarises the assumptions used in these models.
Maintaining a baseline of policies which reduce transmission
4. Figure 1 demonstrates the need to maintain a baseline set of policies to reduce transmission, once legal restrictions are lifted. For this baseline, a specific set of policies has not explicitly been modelled but could include measures such as the retention of Test, Trace and Isolation and / or public messaging to encourage voluntary actions to reduce risks.
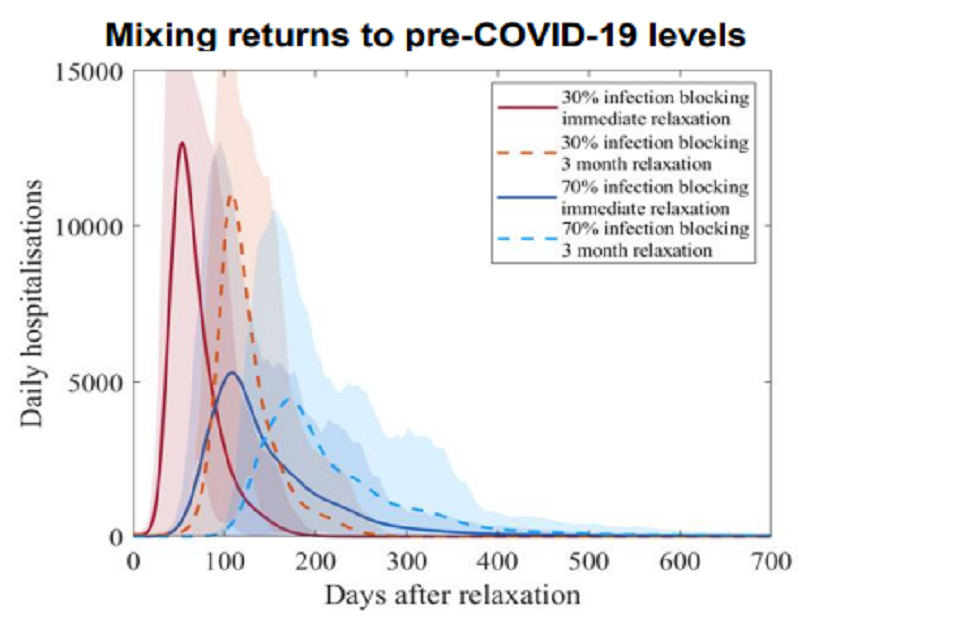
5. The right-hand panel in Figure 1 shows a return to pre-COVID-19 life (ie with no restrictions or lasting behavioural change at all) once JCVI groups 1 to 4 have received 2 doses of vaccine and groups 5-9 have received 1 dose. At the equivalent time point in the left-hand panel, 25% of restrictions remain – ie 25% of transmission reduction is retained compared to 0% in the right-hand panel.
6. Even if vaccines reduce the risk of infection by 70% (blue lines), the subsequent wave is much smaller when some transmission reduction remains (Figure 1 – left panel) compared to a return to January 2020 mixing (Figure 1 – right panel). Gradually relaxing measures over 3 months (dashed lines) leads to lower peaks than doing so overnight (solid lines), partly because more people have been vaccinated over this time. For context, the 7-day rolling average of UK COVID-19 hospital admissions peaked in January 2021 at 4,200.
Figure 1: Daily COVID-19 hospital admissions in the UK if measures are retained at their current level until JCVI groups 1-4 have received 2 doses of vaccine and groups 5 to 9 have received at least 1 dose, at which point 25% of transmission reduction remains (left) or mixing returns to pre-COVID-19 (right). Blue lines show 70% reduction in risk of infection from vaccines and red lines show 30%. Solid lines are immediate relaxations and dashed lines are over 3 months. Assumes vaccines reduce hospital admission by 70% and 88% 3 weeks after the first and second dose respectively, rollout of 2.5m per week from March and coverage reaches 85% in all age groups.
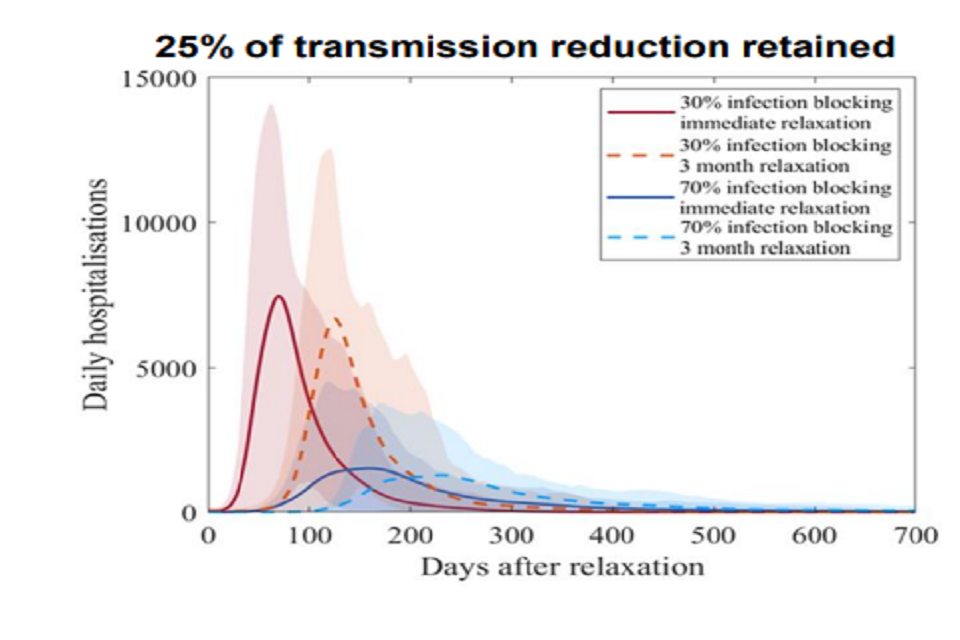
Two line charts showing the scale of a resurgence in admissions reduces with higher vaccine efficacy, and if measures relax over 3 months vs. at once. Returning to pre-COVID mixing leads to higher peaks relative to retaining 25% of transmission reduction.
Two line charts showing the scale of a resurgence in admissions reduces with higher vaccine efficacy, and if measures relax over 3 months vs. at once. Returning to pre-COVID mixing leads to higher peaks relative to retaining 25% of transmission reduction.
Timescales over which measures could be relaxed
7. Figure 2 assumes that R remains at current levels until the start of April (when hospital occupancy due to COVID-19 is around 10,000). At this point measures are lifted over 3 (purple), 6 (blue) or 9 (yellow) months until there are no (right hand panel) or 25% (left hand panel) of the current transmission restrictions remaining. The January 2021 peak in hospital occupancy is shown for context.
Figure 2: COVID-19 hospital occupancy in the UK if measures are retained at their current level until the start of April at which point all (right) or all but 25% (left) of transmission reduction is lifted over 3 (purple), 6 (blue) or 9 (yellow) months. Red dotted line denotes occupancy of 10,000. Assumes Pfizer reduces hospital admissions by 88% and 94% after 1 and 2 doses respectively; AZ by 70% and 88% respectively; both vaccines reduce risk of infection by 48% after dose 1 and 60% after dose 2; rollout of 2.5m per week from mid-Feb; and coverage of 85% for dose 1 and 75% for dose 2 in all age groups.
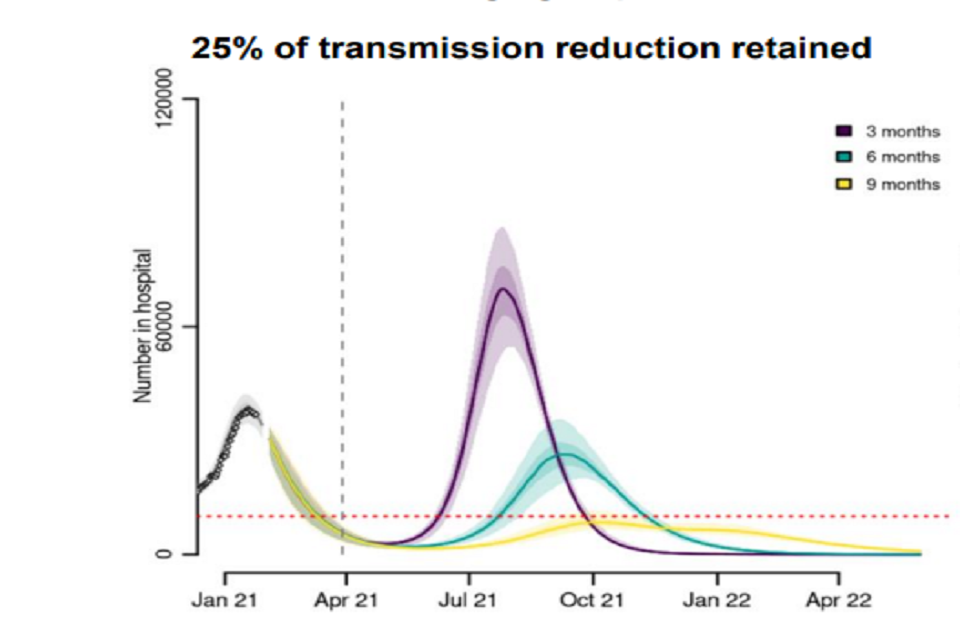
Two fan charts showing the scale of a resurgence in UK hospital occupancy reduces if measures are reduced over a longer period. Returning to pre-pandemic mixing leads to higher resurgences compared to retaining 25% of current reductions in transmission.
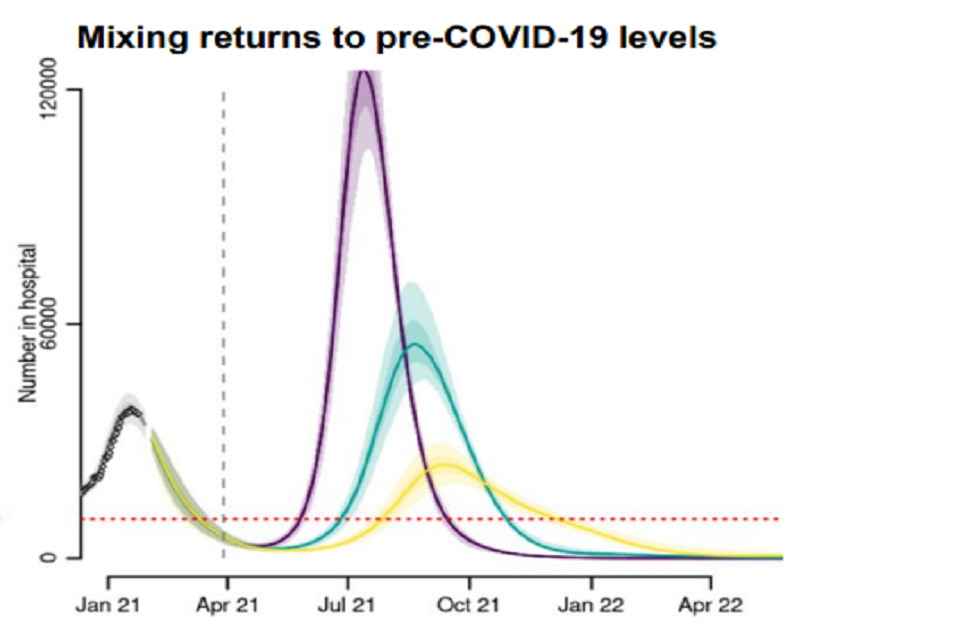
Two fan charts showing the scale of a resurgence in UK hospital occupancy reduces if measures are reduced over a longer period. Returning to pre-pandemic mixing leads to higher resurgences compared to retaining 25% of current reductions in transmission.
8. In both scenarios, a relaxation over 3 months results in a resurgence in hospital occupancy that is larger than seen in January 2021. This is due to the large number of people in vulnerable groups who still do not have direct protection (either because they have not been vaccinated, or because their vaccination has not stopped them becoming ill) nor indirect protection from wider population immunity (because many people in younger age groups have not yet been vaccinated). The UK has a large number of older people so very many deaths could still occur unless their vaccine coverage is extremely high.
9. Relaxing measures over 6 months (blue) or 9 months (yellow) result in much smaller subsequent epidemic waves. As per the previous section, retaining a baseline of transmission reduction (Figure 2 left hand panel) significantly reduces the scale of the resurgence and results in a much smaller peak for a given pace of reopening.
Effect of delaying relaxation measures
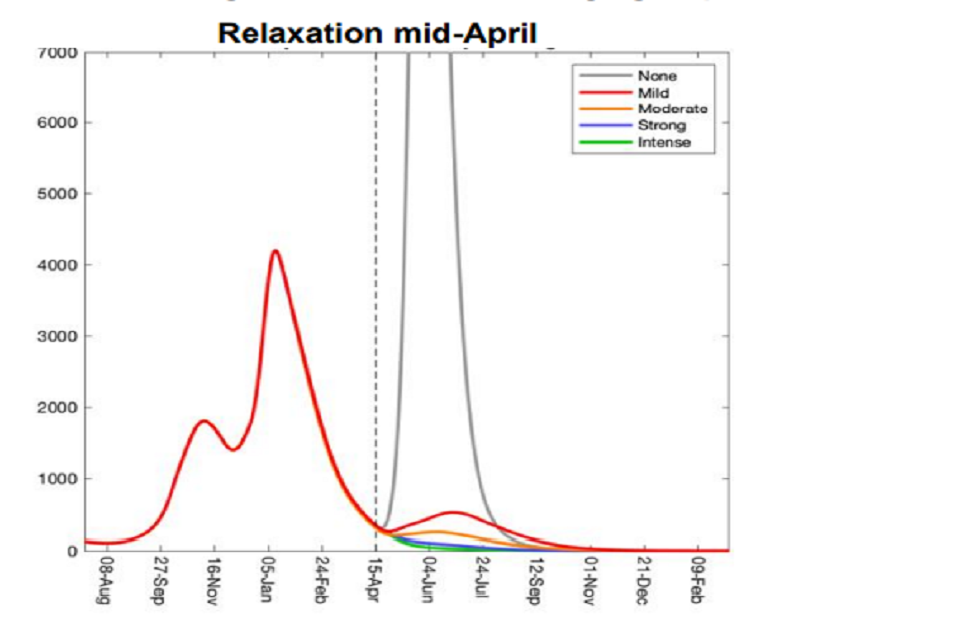
10. The longer measures are maintained that keep R below 1, the more people will be protected by vaccination and therefore the lower the risks will be over the next stage of relaxation. The coloured lines in Figure 3 represent a single step-change relaxation that is then maintained indefinitely. Red is the equivalent mixing that would give R=1.2 in February, orange – 1.1, blue – 0.9 and green – 0.8 [footnote 3]. For context, returning to pre-COVID-19 mixing is given in grey. Relaxing to R=1.2 in mid-March leads to a very large resurgence. The same levels of relaxation in mid-April cause only small bumps in deaths and hospital admissions.
Figure 3: Daily COVID-19 hospital admissions in the UK if measures are retained at their current levels until mid-March (left) or mid-April (right) after which mixing patterns revert to those that, in February 2021, would equate to R=1.2 (red), 1.1 (orange), 0.9 (blue), or 0.8 (green). This level of restriction is then maintained indefinitely. For context, returning to pre-COVID-19 mixing is given in grey. Assumes vaccines reduce hospital admission by 70% and 88% 3 weeks after dose 1 and dose 2 respectively; vaccines reduce risk of infection by 48% and 60% after dose 1 and dose 2 respectively; rollout of 2.5m per week from March and coverage reaches 85% in all age groups.
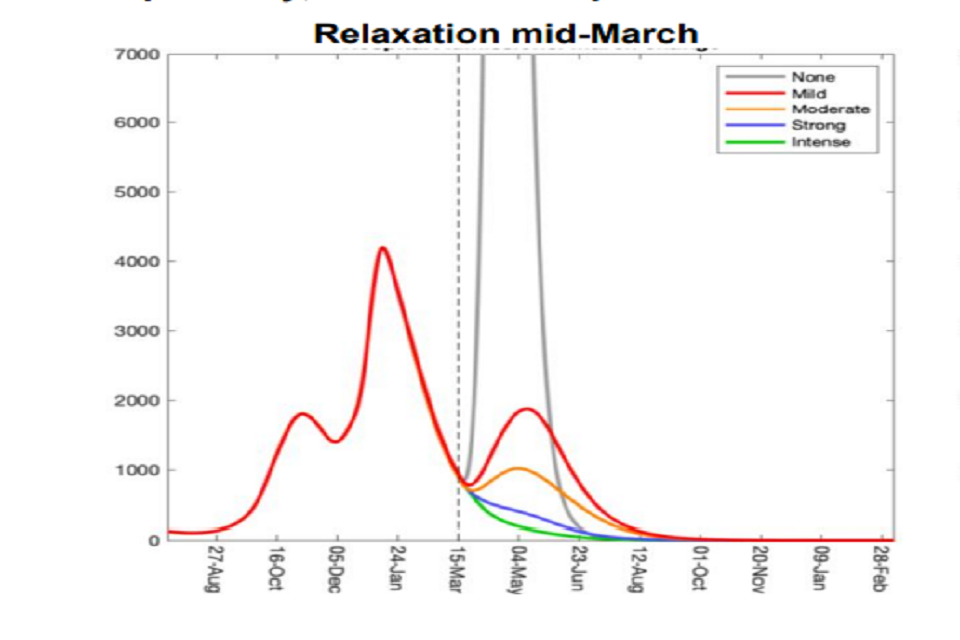
Two line charts showing resurgences in UK hospital admissions are lower if measures are relaxed in April, rather than March. Peaks increase with the level of mixing; returning to pre-COVID mixing leads to a peak substantially higher than in January 2021.
Two line charts showing resurgences in UK hospital admissions are lower if measures are relaxed in April, rather than March. Peaks increase with the level of mixing; returning to pre-COVID mixing leads to a peak substantially higher than in January 2021.
Implications of uneven vaccine coverage
11. These models do not account for vaccination coverage being different in different communities. Early evidence suggests that, so far, coverage has been lower in some minority ethnic groups. Even if vaccination successfully drives down mortality and morbidity overall, it is highly likely that there will still be outbreaks in some communities.
Seasonality
12. The extent of any seasonal patterns in transmission (either intrinsic to SARS-CoV-2 or as a result of behavioural factors) is not yet clear and so is not included in these models. If transmission is slower in warmer months, there could be potential for slightly quicker reopening than these models suggest. That, however, could result in a further resurgence later in the year, which could be particularly acute if waning immunity becomes a factor.
Appendix: model assumptions
| Parameter | Imperial College | Warwick |
|---|---|---|
| Vaccine reduction in risk of infection (all ages) | 48% for both vaccines after dose 1 and 60% for both vaccines after dose 2. Scenario analyses of 32% / 40% and 60% / 75% not shown here for brevity. | 48% for both vaccines after dose 1 and 60% for both vaccines after dose 2. |
| Vaccine reduction in risk of hospital admission or death (all ages) | 88% for Pfizer and 70% for AZ after dose 1. 94% for Pfizer and 88% for AZ after dose 2 | 70% after dose 1 and 88% after dose 2 (weighted average of AZ and Pfizer). |
| Time to full vaccine protection | 2 weeks for dose 1, 1 week for dose 2 | 3 weeks |
| Rollout speed (UK basis) | Average of 2.2m doses per week until mid-February then 2.5m per week thereafter | Average of 2.2m doses per week until March then 2.5m per week thereafter Scenario analysis of 4m per week not shown for brevity |
| Vaccine prioritisation | Per JCVI ordering | Per JCVI ordering |
| Coverage achieved (all ages) | 85% for dose 1 and 75% for dose 2 | 85% |
| Variants | No impact of novel variants other than B.1.1.7 | No impact of novel variants other than B.1.1.7 |
| R until easing | 0.8 | Warwick’s current central estimate |
| Seasonality | None | None |
| Waning immunity | None over the timescale modelled | None over the timescale modelled |
-
SPI-M-O: Insights from early vaccination modelling, 9 December 2020; SPI-M-O Consensus statement on COVID-19, 13 January 2021; ↩
-
Interquartile range of the distribution given ↩
-
R is lower at later points in time because of a build-up of immunity from vaccination and infection-induced immunity ↩