SPI-M-O: Summary of further modelling of easing restrictions – Roadmap Step 4 on 19 July 2021, 7 July 2021
Updated 13 May 2022

© Crown copyright 2022
This publication is licensed under the terms of the Open Government Licence v3.0 except where otherwise stated. To view this licence, visit nationalarchives.gov.uk/doc/open-government-licence/version/3 or write to the Information Policy Team, The National Archives, Kew, London TW9 4DU, or email: psi@nationalarchives.gov.uk.
Where we have identified any third party copyright information you will need to obtain permission from the copyright holders concerned.
This publication is available at https://www.gov.uk/government/publications/spi-m-o-summary-of-further-modelling-of-easing-restrictions-roadmap-step-4-on-19-july-2021-7-july-2021/spi-m-o-summary-of-further-modelling-of-easing-restrictions-roadmap-step-4-on-19-july-2021-7-july-2021
Summary
1. The scale of the resurgence in hospital admissions after 19 July is highly uncertain and depends on unknowable factors including how behaviours change in the coming weeks and months. Many modelled scenarios show a peak in hospital admissions well below that of January 2021, but SPI-M-O cannot rule out a wave of a similar or even larger scale.
2. Exponential growth means that very small changes in assumptions on vaccine effectiveness and behaviours after Step 4 is taken lead to very large differences in the trajectories observed here. Uncertainty means it will not be possible to project which of these scenarios will likely occur nor can the peak’s timing be predicted until it has passed.
3. Given this uncertainty, it would be prudent for contingency plans to be put in place for how to respond if hospital admissions approached levels that could disrupt the smooth functioning of health services.
4. If behaviours take longer to return to pre-pandemic levels (and / or if the seasonal effect of transmission is higher), then the peak of the summer resurgence is likely to be lower. This would result in a wave that is broader, or partially shifted to autumn and winter.
5. The next peak in deaths will almost certainly be considerably smaller than that of January 2021.
6. The prevalence of infection will almost certainly remain extremely high for at least the rest of the summer.
7. SPI-M-O’s best estimate for R in England is between 1.2 and 1.5, reflecting the epidemiological situation approximately 2 to 3 weeks ago (late June).
Key changes since the paper of 9 June:
-
The 4-week delay to Step 4 has resulted in a larger proportion of the population being protected by vaccines. Between 21 June to 5 July, approximately a further 4 million vaccinations were given.
-
The extent to which transmission had increased after Step 3 could not previously be estimated due to time delays, and the confounding by the emergence of the B.1.617.2 [footnote 1] (delta) variant. There has been relatively little change in contacts since mid-May, so modelling groups’ scenarios have accounted for transmission changing relatively little since Step 3 was taken on 17 May in their central scenarios.
-
Data from Public Health England (PHE) has now become available on the effectiveness of vaccines against hospital admission, but not death, with the delta variant. Although confidence intervals are wide, models’ central estimates for this parameter have increased.
-
Warwick (and Imperial College London in a sensitivity analysis) have modelled a gradual change in behaviour after Step 4, instead of a step change as previously.
-
Sensitivity analysis from Imperial has highlighted the importance of cross-protection against different viral variants, for example the immunity to delta created by infection with B.1.1.7 (alpha) [footnote 1].
Key assumptions in the central scenarios
These are for the central scenarios and relate to the delta variant. A full set of assumptions, including for sensitivity analyses are given in Appendix 1 and the respective modelling papers.
Cross-protection against delta after infection with alpha
| Against infection | Against hospitalisation | |
|---|---|---|
| Imperial | 85% | 95% |
| LSHTM | 100% | 100% |
| Warwick | 100% | 100% |
Vaccine reduction in risk of infection
| AZ Dose 1 | AZ Dose 2 | Pfizer/Moderna Dose 1 | Pfizer/Moderna Dose 2 | |
|---|---|---|---|---|
| Imperial | 33% | 58% | 33% | 85% |
| LSHTM | 43% | 62% | 47% | 80% |
| Warwick | 34% | 64% | 56% | 80% |
Vaccine reduction in risk of onwards transmission if infected
(in addition to transmission reduction from lower infection risk).
| AZ Dose 1 | AZ Dose 2 | Pfizer/Moderna Dose 1 | Pfizer/Moderna Dose 2 | |
|---|---|---|---|---|
| Imperial | 40% | 40% | 40% | 40% |
| LSHTM | 47% | 57% | 47% | 57% |
| Warwick | 45% | 45% | 45% | 45% |
Vaccine reduction in risk of symptomatic disease
| AZ Dose 1 | AZ Dose 2 | Pfizer/Moderna Dose 1 | Pfizer/Moderna Dose 2 | |
|---|---|---|---|---|
| Imperial | 33% | 58% | 33% | 85% |
| LSHTM | 43% | 71% | 47% | 84% |
| Warwick | 34% | 70% | 56% | 88% |
Vaccine reduction in risk of hospital admission
(or severe disease)
| AZ Dose 1 | AZ Dose 2 | Pfizer/Moderna Dose 1 | Pfizer/Moderna Dose 2 | |
|---|---|---|---|---|
| Imperial | 80% | 90% | 85% | 95% |
| LSHTM | 85% | 90% | 85% | 90% |
| Warwick | 81% | 94% | 90% | 98% |
Vaccine reduction in risk of death
| AZ Dose 1 | AZ Dose 2 | Pfizer/Moderna Dose 1 | Pfizer/Moderna Dose 2 | |
|---|---|---|---|---|
| Imperial | 80% | 95% | 85% | 95% |
| LSHTM | 85% | 95% | 85% | 95% |
| Warwick | 81% | 95% | 90% | 98% |
Current epidemic estimates
8. SPI-M-O’s best estimate for R in England is between 1.2 and 1.5 and the growth rate is between +3% and +7% per day, based on data available up to 5 July. Estimates for NHS England regions are given in Appendix 2. R is a lagging indicator, reflecting the state of the epidemic approximately 2 to 3 weeks ago.
Medium term projections and scenarios
9. Each week, SPI-M-O combines estimates from several independent models to project the trajectory of the epidemic if no further changes in behaviour or policy take place. They represent what the trajectory might be if the epidemic continued to follow the trends seen in the latest available data up to 5 July. They are neither forecasts nor predictions and cannot fully reflect recent changes in transmission that have not yet filtered through into surveillance data. They are released separately as SPI-M-O medium-term projections.
10. Four of these same models have further been used to explore the potential impact of a range of scenarios following changes in transmission. These scenarios assume changes in behaviour result in R values of 1.1, 1.5, 1.8, or 2.1 on 19 July [footnote 2], and are run for a further 6 weeks. These scenarios are shown on a logarithmic scale in Figure 1 (R=1.1 – green; 1.5 – blue; 1.8 – orange; 2.1 – red) for England’s hospital admissions alongside the latest medium-term projection of current trends (grey) for comparison.
11. The duration and timing of the peak in each scenario is highly uncertain and varies across the individual models. As a result, the combination of these individual model scenarios produces a longer and flatter peak than might be expected.
12. A doubling time in infections of around one week is consistent with growth in hospitalisations akin to the blue line (R=1.5) in Figure 1. Faster growth in infections will cause faster growth in hospitalisations a few weeks later.
13. Figure 1 shows that the ongoing vaccine rollout programme means that a period with R around 1.1 or 1.5 would result in a small increase in hospital admissions followed by a turnover due to accumulation of immunity. An increase of R to 1.8 or 2.1 would result in larger increases that continue beyond the period of these scenarios.
Figure 1: Eight-week scenarios for daily hospital admissions in England over a range of R values (1.1 – green; 1.5 – blue; 1.8 – orange; 2.1 – red) reflecting the possible impact of the easements from 19 July. The grey line is SPI-M-O’s medium-term projection of current trends. All scenarios show interquartile ranges of model combinations as the shaded band. Note the logarithmic scale.
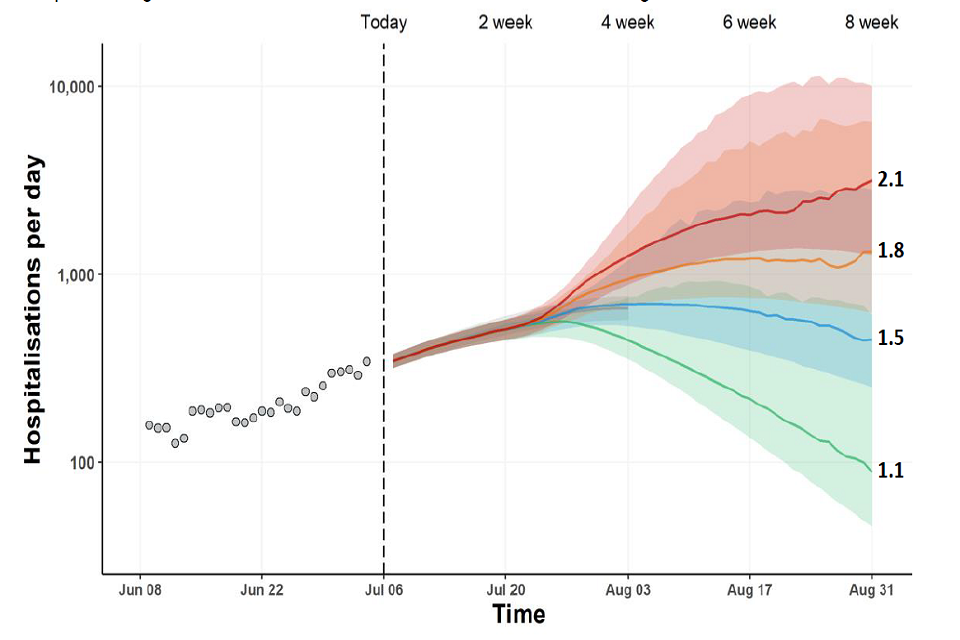
Fan chart showing a substantial rise in admissions under scenarios where R = 1.8 or 2.1 on 19 July. R values of 1.1 or 1.5 lead to a small initial increase after 19 July, before admissions fall. Interquartile ranges overlap for all scenarios until August.
14. These scenarios assume a step change in transmission from 19 July. In reality, in addition to a change in behaviour from a given date, there will likely be gradual increases in transmission in different parts of the country at different times. This variation in hospital admissions has been seen across the country and is currently settled at a consistent trajectory across the country.
Modelling Step 4 of the Roadmap
15. SPI-M-O has considered the results from 3 academic groups who have independently modelled taking Step 4 of the Roadmap on 19 July. These groups have made assumptions in the central scenarios that include:
- Once removed, social distancing measures are never re-imposed. Behaviours do not change in response to rising prevalence.
- The delta variant remains dominant.
- Under 18s are not vaccinated as, at the time of writing, the Joint Committee on Vaccinations and Immunisations (JCVI) have not published their advice on this.
- There is little waning immunity over the next few months and no booster vaccinations take place over the timescale of the modelling, as the timing and speed of this programme is not yet known.
- London School of Hygiene and Tropical Medicine (LSHTM) and Imperial have modelled single step changes (or near-step changes) in transmission on 19 July, with some transmission reduction remaining as a result of Test, Trace, and Isolate and behaviour change. Warwick (and Imperial in sensitivity analysis) have modelled a range of scenarios with a gradual return to pre-pandemic behaviours at different times from August 2021 until March 2022.
16. All results are highly sensitive to the modelling assumptions, and extensive sensitivity analyses have been performed. The key uncertainties are laid out in this summary; full details are given in the accompanying modelling papers.
Key conclusions
17. All models show a period of extremely high prevalence of infection lasting until at least the end of August. There is high uncertainty around both the scale of the peak in prevalence and in the number of confirmed cases that this would correspond to. This would also depend on people’s willingness to be tested and, potentially, on capacity to test them. SAGE has previously highlighted considerations as to what measures may be required beyond the end of the Roadmap in different situations [footnote 3].
18. The scale of the next wave in hospital admissions is highly uncertain. While most modelled scenarios have peaks lower than in January 2021, a resurgence of this scale of hospitalisations cannot be ruled out. It is almost certain that, with the delta variant dominant, the peak in deaths will be well below the levels seen in January.
19. An independent group from the JUNIPER Consortium have applied a completely different, simpler approach to project the total numbers of deaths, if the epidemic continues to its final size. The results of this modelling are comparable with the Warwick scenarios, providing a separate reassurance of these results.
20. The main reasons for continued uncertainty are:
- It is not possible to predict how behaviours will change after 19 July. The closer that behaviours are to those seen before the pandemic and the more rapidly this state is reached, the larger the resurgence will be.
- While the first estimates of vaccines’ effectiveness against hospitalisation with the delta variant have become available after the previous iteration of modelling, precise values for this cannot be determined from observational studies to date. Models are very sensitive to the assumptions used. For example, the number of infected vaccinated people who go on to be admitted to hospital with a 94% effective vaccine would be triple that with a 98% effective one.
- While the number of vaccinated people is precisely known, the number of unvaccinated people is not, so estimates of vaccine uptake are uncertain. Models are also very sensitive to this; for example, there would be twice as many unvaccinated people in an age group if its uptake is 92% compared to if uptake is 96%.
- The proportion of the population who have previously been infected cannot be precisely determined and yet influences the extent to which the epidemic can grow before herd immunity is reached.
21. It is very difficult to forecast the peak of an epidemic in real time, and it will take several weeks after 19 July before it will be clear whether or not hospitals will be put under severe pressure. It is therefore important to closely monitor the epidemic so contingency plans can be rapidly put in place if needed.
22. The resurgences in hospitalisations are smaller than seen in SPI-M-O’s modelling on 9 June. This is because:
- Delaying Step 4 by 4 weeks has allowed many more vaccinations to be administered and moved the end of restrictions to a time point close to the school holidays, where transmission is expected to be lower.
- As of 9 June, it was not possible to determine the extent of transmission from Step 3 due to confounding effects of the emergence of the delta variant. Recent data from the CoMix study has shown that, since late April to mid-May, there has been little change to the number of contacts that adults make, and these remain well below pre-pandemic levels. Models have now been fitted to data that show lower than expected transmission, and therefore prevalence, after Step 3.
- As of 9 June, no data were available on vaccines’ effectiveness against hospital admission with the delta variant. PHE have since published these estimates and, while their confidence intervals are very wide, they are broadly in line with the optimistic vaccine effectiveness scenarios previously modelled.
23. Some, but not all, scenarios discussed here and in the underlying papers show further waves in autumn and / or winter, although they are all considerably smaller than in winter 2020/21, and in these scenarios the summer wave is correspondingly broader and flatter. The modelled winter waves are larger if a) the extent of seasonality in transmission is higher and b) the summer wave is smaller, so fewer people are immune by winter. Note that these models have not incorporated an autumn booster vaccine campaign, and waning is not considered in the Warwick model.
Summary of Warwick modelling
24. In contrast to their previous work, Warwick have not modelled a single change in transmission on 19 July. Instead, a gradual return to pre-pandemic behaviours over a range of dates from August 2021 to March 2022 is modelled. Some, but not all, scenarios assume there is also a significant (but partial) initial step change in behaviour on 19 July before the gradual changes take place.
25. A selection of these results is illustrated in Figure 2 below. With vaccine effectiveness assumptions in line with PHE’s central estimates, peak (mean) daily hospital admissions range from around 500 to 950 with the slowest return to pre-pandemic behaviours which take approximately 7 months after taking Step 4. This compares to around 1,300 to 4,800 for the most rapid return to pre-pandemic behaviours, over the course of one month. Peaks are higher where vaccine effectiveness assumptions are towards the lower end of PHE’s estimates; even then, most scenarios result in smaller resurgences than January 2021 unless there is a rapid return to pre-pandemic behaviour.
Figure 2: Infections, hospital admissions and occupancy, and deaths in England as estimated under 5 different behavioural scenarios as modelled by Warwick, assuming default vaccine effectiveness. Lines indicate the median of the distribution; shaded regions show the 95% prediction interval.
(Purple – small drop in precautionary behaviour from 19 July then gradual reduction to pre-pandemic levels over one month; Red – as purple, but gradual reduction to pre-pandemic levels over 3 months; Blue – as red, but gradual reduction to pre-pandemic levels over 5 months; Orange - large drop in precautionary behaviour from 19 July then gradual reduction to pre-pandemic levels over 3 months; Cyan - medium drop in precautionary behaviour from 19 July then gradual reduction to pre-pandemic levels over 5 months)
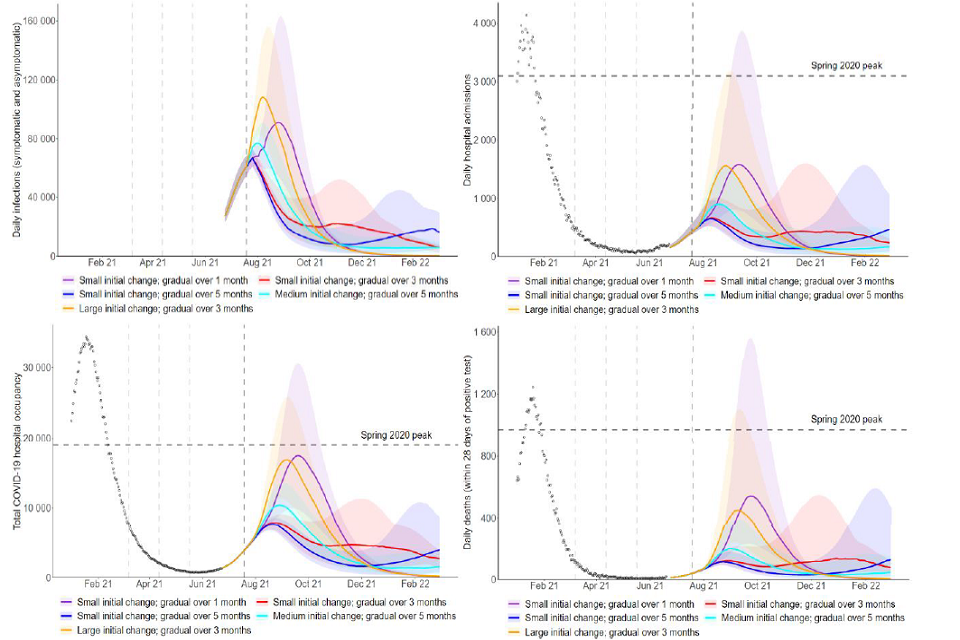
Four fan charts showing the trajectory of infections, admissions, occupancy and deaths under five behavioural scenarios post-Step 4. There is a resurgence in all scenarios, with higher peaks in scenarios with a large and/or rapid change in behaviour.
26. It is noticeable that very small changes in assumed behaviour lead to very different epidemic trajectories of infections, hospitalisations, and deaths, as a result of exponential growth. Some, but not all, of Warwick’s scenarios see a further resurgence in autumn or winter (Figure 2, red and blue). The fewer people that are infected during the wave that is currently happening, the more are infected in the next one. Neither Imperial nor LSHTM’s scenarios show a significant additional, distinct autumn or winter wave. Any contingency planning will need to be able to flex to a wide range of scenarios.
27. Daily hospital admissions that are lower than the spring 2020 or January 2021 peak could still cause severe disruption for the NHS. For example, if the average length of stay is 9 days, 1,000 hospitalisations per day for a sustained period would lead to hospital occupancy due to COVID-19 of 9,000 individuals. In Warwick’s results, under the central and optimistic assumptions on vaccine effectiveness, half of the scenarios generate extended periods with more than 1,000 hospital admissions a day. Under the cautious assumptions on vaccine effectiveness, all behavioural scenarios breach 1,000 hospitalisations a day. It is highly likely that any such pressure on the NHS would vary regionally and temporally.
28. Given the delay between infection and hospitalisation, increases in admissions for the coming 2 to 3 weeks are already determined by infections to date. Consequently, whilst cases continue to increase exponentially, admissions are expected to double (regardless of any measures put in place). While SPI-M-O does not know what threshold of daily hospital admissions would lead to unsustainable pressure for the NHS, the moment when half that level is reached would be the time at which contingency plans would need to be implemented.
29. Warwick’s central case assumes a 10% peak-to-trough seasonal variation in transmission. They also considered sensitivities of 20% and 40% variation. The non-linear interaction between seasonality and behaviour, however, is a complex one. As it is currently summer, the higher seasonality scenario would require existing behaviour to be close to pre-pandemic levels, with little scope for increased mixing after 19 July. This means that, in these scenarios, the ongoing wave rapidly diminishes, yet there is always a winter wave (Figure 3).
Figure 3: Hospital admissions in England as estimated by the Warwick model for 4 different behaviour scenarios for after Step 4 is taken, each with either 10% (default solid line), 20% (dotted line), or 40% (dashed line) peak to trough seasonality. Default vaccine effectiveness assumptions. Lines indicate means; shaded regions show the 95% prediction interval.
(Top left purple – small drop in precautionary behaviour from 19 July then gradual reduction to pre-pandemic levels over one month; Top right red – as purple, but gradual reduction to pre-pandemic levels over 3 months; Bottom left orange - large drop in precautionary behaviour from 19 July then gradual reduction to pre-pandemic levels over 3 months; Bottom right cyan - medium drop in precautionary behaviour from 19 July then gradual reduction to pre-pandemic levels over 5 months)
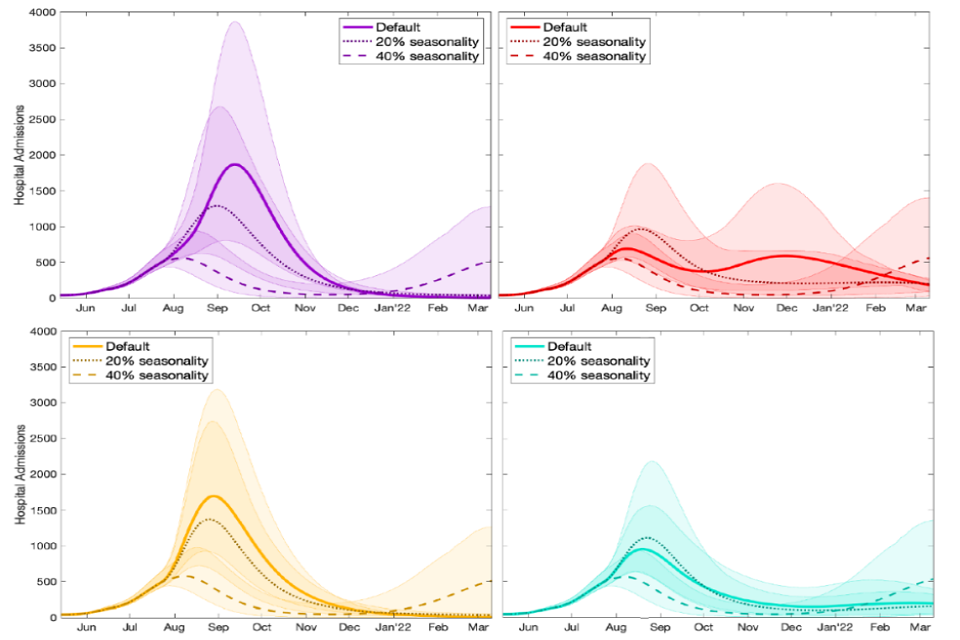
Four line charts showing the impact of seasonality on hospital admissions under four different scenarios for assumed behaviour post-Step 4.
30. Warwick have also highlighted the sensitivity of models to the precise uptake achieved in older people. Although the number of doses administered is known, the overall population size and hence the number of unvaccinated people is not. As of 1 July, more first doses have been administered to 75- to 79-year olds in England (1.98m) [footnote 4] than the number of people of that age estimated by ONS’s mid-2019 population estimates (1.94m), so NHS England report an uptake of over 100%. PHE, however, base their estimates [footnote 5] on the National Immunisation Management System (NIMS) database in which there are 2.08m 75- to 79-year olds, giving an estimated uptake of 95%. It is a general pattern that PHE estimates of coverage are lower than those calculated using ONS’s population estimates.
31. Although such differences may appear unimportant, models are very sensitive to the precise uptake used. For example, there are twice as many unvaccinated people in a high-risk age group that had 92% uptake compared to if uptake were 96%, meaning there would be many more people at risk of hospitalisation. The resulting increase in hospitalisations due to assumed lower vaccine uptake historically under various behavioural scenarios is illustrated in Figure 4.
Figure 4: Hospital admissions in England as estimated by the Warwick model for 4 different behaviour scenarios for after Step 4 is taken, each with either default (solid line), 5% lower (dotted line), or 10% lower (dashed line) vaccine uptake to date. Default vaccine effectiveness assumptions. Lines indicate means; shaded regions show the 95% prediction interval.
(Top left purple - small drop in precautionary behaviour from 19 July then gradual reduction to pre-pandemic levels over one month; Top right red – as purple, but gradual reduction to pre-pandemic levels over 3 months; Bottom left orange - large drop in precautionary behaviour from 19 July then gradual reduction to pre-pandemic levels over 3 months; Bottom right cyan - medium drop in precautionary behaviour from 19 July then gradual reduction to pre-pandemic levels over 5 months)
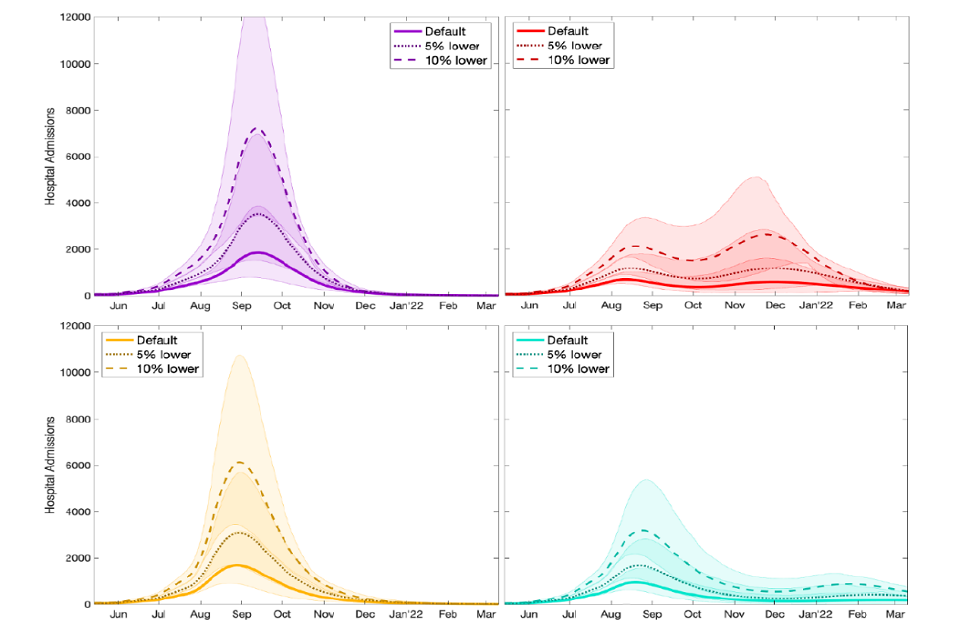
Four line charts showing the scale of resurgence in admissions increases with lower vaccine uptake, under four different scenarios for behaviour post-Step 4. Median peak admissions increase by 3 to 4-fold if historic uptake is 10% lower than the default.
Summary of Imperial College London modelling
32. Imperial have considered step changes occurring on 19 July that take R (excluding the effect of immunity from vaccines or natural infection [footnote 6]) in school term time to 5.5 (central, with contacts approximately doubling), 4.5 (low R, with contacts increasing by approximately 50%), or 7.0 (high R). As a sensitivity analysis, they also modelled a gradual change in behaviours so that R (excluding immunity) reaches 5.5 on 1 September.
33. Imperial have used their own estimates of vaccine effectiveness to account for admissions whose first positive test is in hospital. Their central scenario uses vaccine effectiveness assumptions that are lower than Warwick’s, but still within PHE’s confidence intervals (see appendix 1 for details). This central scenario assumes that 15% of people who have recovered from an infection with alpha are nevertheless susceptible to a second infection with delta if they are unvaccinated. Imperial’s optimistic vaccine assumptions assume perfect cross protection and use PHE’s point estimates (and are therefore similar to Warwick central scenarios).
34. Figure 5 shows the Imperial model with their optimistic (left) and central (right) vaccine effectiveness assumptions [footnote 7]. As with Warwick, if vaccine effectiveness against hospital admission is in line with PHE’s point estimates, then a rapid return to pre-pandemic behaviours leads to a peak in hospitalisations broadly similar to that of January 2021 (blue line in left hand plot). If baseline behaviour change leads to more significant transmission reduction (green or purple lines in left hand plot) then the peak is significantly smaller. As with Warwick, a more gradual change in behaviour extends and flattens the peak (yellow line compared to blue line, where R=5.5 happens suddenly).
Figure 5: Hospital admissions in England as estimated by the Imperial model under optimistic (left) and central (right) vaccine effectiveness assumptions for different behaviours after Step 4 is taken (blue – high R excluding immunity of 7.0; purple – central R excluding immunity of 5.5; green – low R excluding immunity of 4.5; yellow – gradual change in behaviours reaching R excluding immunity of 5.5 on 1 September, rather than 19 July). Note the different y-axes between the 2 plots. Lines indicate the median of the distribution and shaded regions the 95% credible interval.
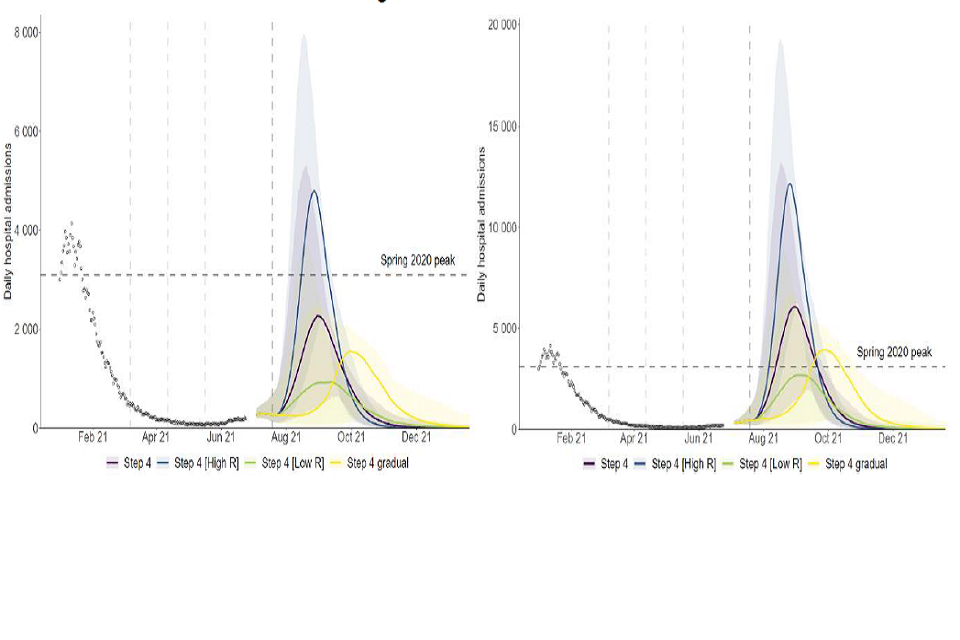
Two fan charts showing that the scale of resurgence in hospital admissions in England reduces with a smaller or more gradual change in behaviour post-Step 4. Relative to default assumptions, peaks are much lower if optimistic vaccine efficacy is assumed.
Summary of LSHTM modelling
35. LSHTM have modelled the changes after Step 4 as happening in 2 ways. Firstly, the model is fitted to historical Google mobility data, which is assumed to increase in low, medium, and high scenarios towards or above pre-pandemic baseline levels after Step 4 of the roadmap is taken on 19 July. Secondly, the model fits a reduction in the per-contact transmission risk of approximately 25% to represent the combined effect of Test, Trace, and Isolate and other mitigating behaviours that are not captured by mobility changes alone. LSHTM scenarios consider various reductions in this mitigation parameter following Step 4 to mimic the reduction in self-protective measures that may occur as requirements such as mask wearing are relaxed. LSHTM’s central and optimistic assumptions for 2 dose vaccine effectiveness against admission with delta are 90% and 96% respectively.
36. Firstly, the sensitivity to the mobility parameter is shown in Figure 6. In this plot, the mitigation parameter reduces the per-contact transmission risk by approximately 15%. In the “high mobility” scenario, transit and workplace mobility both reach 90%; in the “medium mobility” scenario, it is 80% and 85% respectively, and in the “low mobility” scenario, they are 75% and 80%.
Figure 6: Hospital admissions (top left), occupancy (top right), ICU occupancy (bottom right) and deaths (bottom left) in the LSHTM model assuming high (red), medium (green), or low (blue) mobility 19 July, and with Test and Trace and baseline behaviour change reducing R by 15%. Two doses of either vaccine are assumed to be 90% effective against hospital admission with delta, and there is waning of natural or vaccine-induced immunity. Lines indicate the median of the distribution and shaded regions the 90% credible interval.
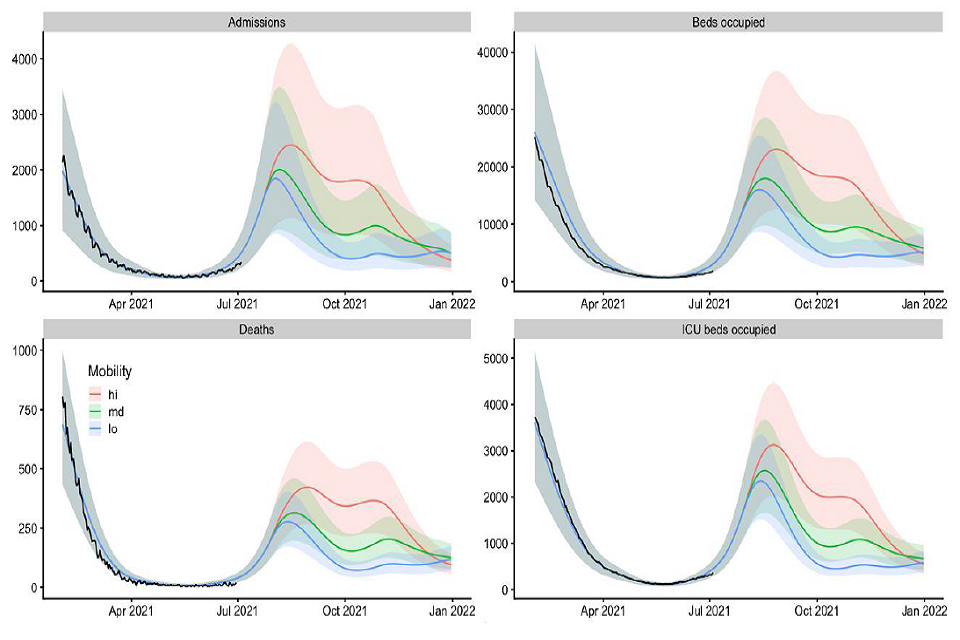
Four fan charts showing that the scale and duration of a resurgence in hospital admissions and occupancy, ICU occupancy and deaths in England increases with assumed mobility levels following Step 4 in the LSHTM model.
37. The sensitivity to this “mitigation parameter” is demonstrated in Figure 7. Here, the per-contact transmission risk is reduced from pre-pandemic levels by approximately 20%(purple), 15% (blue), 10% (green), or 5% (red) after 19 July by Test, Trace, and Isolate and baseline behaviours. With the least effective mitigating behaviour, hospital admissions are similar to the level seen in January (and deaths around half that level), but more significant behaviour change sees hospital admissions peak well below 2,000.
Figure 7: Hospital admissions (top left), occupancy (top right), ICU occupancy (bottom right) and deaths (bottom left) in the LSHTM model assuming a 20% (purple), 15% (blue), 10% (green), or 5% (red) reduction in transmission post July 19 as a result of Test, Trace, and Isolate, and baseline behaviour change. Two doses of either vaccine are assumed to be 90% effective against hospital admission with delta, there is waning of natural or vaccine-induced immunity, and medium mobility is assumed. Lines indicate the median of the distribution and shaded regions the 90% credible interval.
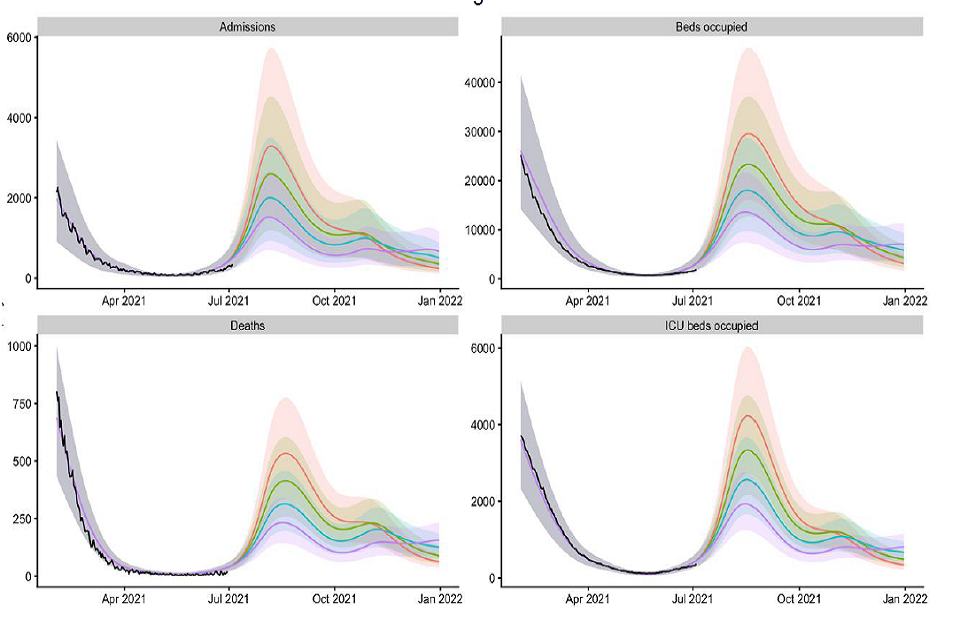
Four fan charts showing the scale of resurgence in admissions, occupancy (all/ICU) and deaths falls with more effective mitigating behaviours post-Step 4. Peak median admissions in the 5% scenario approach Jan levels and are about double those in the 20%.
38. Other scenario analyses reiterate the sensitivity of modelled outcomes to the assumptions used for vaccine effectiveness, uptake achieved, the duration of immune protection, and whether the delta variant is associated with a higher risk of hospitalisation and death than alpha.
Appendix 1: Model assumptions
Given the dominance of the delta variant, parameter values shown here are for this strain of SARS-CoV-2. Other parameter values for alpha are given in the respective modelling papers, alongside further details of the models.
Cross-protection against delta after infection with alpha or other strain
Imperial College
| Central | Pessimistic | Optimistic | |
|---|---|---|---|
| Against infection | 85% | 75% | 100% |
| Against hospital admisions | 95% | 90% | 100% |
LSHTM
| Central | Optimistic | |
|---|---|---|
| Against infection | 100% | 100% |
| Against hospital admisions | 100% | 100% |
Warwick
| Central | Pessimistic | Optimistic | |
|---|---|---|---|
| Against infection | 100% | 100% | 100% |
| Against hospital admisions | 100% | 100% | 100% |
Vaccine reduction in risk of infection
Imperial College
| Central | Pessimistic | Optimistic | |
|---|---|---|---|
| AZ 1 dose | 33% | 20% | 45% |
| AZ 2 dose | 58% | 45% | 70% |
| PF/MD 1 dose | 33% | 20% | 45% |
| PF/MD 2 dose | 85% | 78% | 90% |
LSHTM
| Central | Optimistic | |
|---|---|---|
| AZ 1 dose | 43% | 48% |
| AZ 2 dose | 62% | 63% |
| PF/MD 1 dose | 47% | 52% |
| PF/MD 2 dose | 80% | 81% |
Warwick
| Central | Pessimistic | Optimistic | |
|---|---|---|---|
| AZ 1 dose | 34% | 31% | 37% |
| AZ 2 dose | 64% | 61% | 65% |
| PF/MD 1 dose | 56% | 53% | 59% |
| PF/MD 2 dose | 80% | 80% | 80% |
Vaccine reduction in risk of onward transmission if infected
(additional to transmission reduction due to reduced infection risk)
Imperial College
| Central | Pessimistic | Optimistic | |
|---|---|---|---|
| AZ 1 dose | 40% | 35% | 45% |
| AZ 2 dose | 40% | 35% | 45% |
| PF/MD 1 dose | 40% | 35% | 45% |
| PF/MD 2 dose | 40% | 35% | 45% |
LSHTM
| Central | |
|---|---|
| AZ 1 dose | 47% |
| AZ 2 dose | 57% |
| PF/MD 1 dose | 47% |
| PF/MD 2 dose | 57% |
Warwick
| Central | Pessimistic | Optimistic | |
|---|---|---|---|
| AZ 1 dose | 45% | 40% | 45% |
| AZ 2 dose | 45% | 40% | 45% |
| PF/MD 1 dose | 45% | 40% | 45% |
| PF/MD 2 dose | 45% | 40% | 45% |
Vaccine reduction in risk of symptomatic disease
Imperial College
| Central | Pessimistic | Optimistic | |
|---|---|---|---|
| AZ 1 dose | 33% | 20% | 45% |
| AZ 2 dose | 58% | 45% | 70% |
| PF/MD 1 dose | 33% | 20% | 45% |
| PF/MD 2 dose | 85% | 78% | 90% |
LSHTM
| Central | Optimistic | |
|---|---|---|
| AZ 1 dose | 43% | 48% |
| AZ 2 dose | 71% | 72% |
| PF/MD 1 dose | 47% | 52% |
| PF/MD 2 dose | 84% | 85% |
Warwick
| Central | Pessimistic | Optimistic | |
|---|---|---|---|
| AZ 1 dose | 34% | 31% | 37% |
| AZ 2 dose | 70% | 68% | 77% |
| PF/MD 1 dose | 56% | 53% | 59% |
| PF/MD 2 dose | 88% | 84% | 89% |
Vaccine reduction in risk of hospitalisation admission
Imperial College
| Central | Pessimistic | Optimistic | |
|---|---|---|---|
| AZ 1 dose | 80% | 75% | 81% |
| AZ 2 dose | 90% | 85% | 94% |
| PF/MD 1 dose | 85% | 80% | 93% |
| PF/MD 2 dose | 95% | 90% | 98% |
LSHTM
| Central | Optimistic | |
|---|---|---|
| AZ 1 dose | 85% | 85% |
| AZ 2 dose | 90% | 96% |
| PF/MD 1 dose | 85% | 85% |
| PF/MD 2 dose | 90% | 96% |
Warwick
| Central | Pessimistic | Optimistic | |
|---|---|---|---|
| AZ 1 dose | 81% | 70% | 85% |
| AZ 2 dose | 94% | 90% | 97% |
| PF/MD 1 dose | 90% | 75% | 96% |
| PF/MD 2 dose | 98% | 90% | 99% |
Vaccine reduction in risk of death
Imperial College
| Central | Pessimistic | Optimistic | |
|---|---|---|---|
| AZ 1 dose | 80% | 75% | 81% |
| AZ 2 dose | 95% | 95% | 95% |
| PF/MD 1 dose | 85% | 80% | 93% |
| PF/MD 2 dose | 95% | 95% | 98% |
LSHTM
| Central | Optimistic | |
|---|---|---|
| AZ 1 dose | 85% | 85% |
| AZ 2 dose | 95% | 98% |
| PF/MD 1 dose | 85% | 85% |
| PF/MD 2 dose | 95% | 98% |
Warwick
| Central | Pessimistic | Optimistic | |
|---|---|---|---|
| AZ 1 dose | 81% | 75% | 85% |
| AZ 2 dose | 95% | 92% | 97% |
| PF/MD 1 dose | 90% | 80% | 96% |
| PF/MD 2 dose | 98% | 95% | 99% |
Rollout speed (England basis)
Per Cabinet Office scenario:
An average of 2m doses per week in England until week commencing 12 july and 2m per week thereafter. Sensitivities of 25% faster and slower rollout are explored by Warwick.
Warwick: 8-week period between doses.
Imperial: 11-week period between doses.
LSHTM: First doses are followed up with equivalent second doses according to measured delays between first and second doses using data up to 30th June 2021.
Time to full vaccine protection
Imperial College
3 weeks (dose 1), 1 week (dose 2).
LSHTM
4 weeks (dose 1), 2 weeks (dose 2).
Warwick
2 weeks (dose 1), 2 weeks (dose 2).
Coverage achieved (all ages)
Imperial College
| Central | |
|---|---|
| 80 and over | Per actuals |
| 50-79 | Per actuals |
| 40-49 | 90% |
| <40 | Minimum of actuals or 80% |
| Care home residents | 95% |
| Care home workers | 86% |
LSHTM
| Central | |
|---|---|
| 40+ | Per actuals (PHE first dose uptake data from 30 June 2021) |
| 18-39 | 80% |
Warwick
| Central | |
|---|---|
| 40+ | Per actuals (PHE first dose uptake data from 2 July 2021) |
| 18-39 | 80% |
R (excluding the effect of immunity) after Step 4 of easing
Imperial College
In terms of B.1.617.2 R excl. immunity:
With schools open:
- (central): 5.5 (95% CI 4.2 to 7.1)
- (lower R; higher impact from measures): 4.5 (95% CI 3.2 to 6.1)
- (higher R; lower impact from measures): 7.0 (95% CI 5.6 to 8.6)
With schools closed:
- (central): 5.0 (95% CI 3.7 to 6.6)
- (lower R; higher impact from measures): 4.0 (95% CI 2.7 to 5.7)
- (higher R; lower impact from measures): 6.5 (95% CI 5.2 to 8.1)
LSHTM
Approx. 25% reduction in per-contact transmission risk from baseline measures, with 15% in the central scenario after step 4 and sensitivity analyses of 5%, 10% and 20% all considered. In addition, there is a reduction in the rate of interpersonal contact represented by fitting to mobility data (relative to baseline mobility in early 2020, pre-epidemic)
| Low | Medium | High | |
|---|---|---|---|
| Grocery and pharmacy | 105% | 105% | 105% |
| Retail and recreation | Aug 2020 | 95% | 105% |
| Transit | Sep 2020 | 80% | 90% |
| Workplace | 80% | 85% | 90% |
R (excluding immunity) reduced by 0.2 to 0.3 during school holidays in all scenarios.
Warwick
Worst case scenario (full relaxation on 19 July): 6.92 (95% CI 6.53 to 7.39)
Additional scenarios have also been modelled.
Transmission advantage of Delta over Alpha
Imperial College
-
LSHTM
Scenarios consider a 40-80% transmission advantage of Delta over Alpha.
Warwick
Central scenario 61% (CI 38%-86%) transmission advantage over alpha.
Additional risk of hospital-isation given infection for delta compared to alpha
Imperial College
85%
LSHTM
80% (partially counteracted by the model fitting to lower prevalence); sensitivities without additional risk also considered.
Warwick
Inferred within code; 87% (48%-134%).
Seasonality
Imperial College
20% peak (February) to trough (August) in central scenario.
LSHTM
20% peak to trough seasonality in central scenarios.
Warwick
10% seasonality (transmission in summer trough is 90% of winter transmission) in central scenarios.
20% and 40% accompanying scenarios.
Waning immunity
Imperial College
Exponential decay in infection-induced immunity with an average time to loss of protection of 3 years.
LSHTM
Waning of natural and vaccine-induced immunity by 15% over 1 year; sensitivity analysis without waning also included.
Warwick
None over the timescale modelled.
Appendix 2: Regional estimates of R and growth rates
Table 1: Combined estimates of R values and growth rates in England, and NHS England regions (90% confidence interval) [footnote 8]. These estimates represent the transmission of COVID-19 2 to 3 weeks ago, due to the time delay between someone being infected, developing symptoms, and needing healthcare.
| Nation | R | Growth rate per day | Doubling time |
|---|---|---|---|
| England | 1.2 to 1.5 | +3% to +7% | 11 to 20 days |
| NHS England region | R | Growth rate per day | Doubling time |
|---|---|---|---|
| East of England | 1.1 to 1.5 | +2% to +7% | 11 to 33 days |
| London | 1.1 to 1.4 | +2% to +6% | 13 to 33 days |
| Midlands | 1.2 to 1.5 | +4% to +8% | 9 to 16 days |
| North East and Yorkshire | 1.3 to 1.6 | +5% to +8% | 8 to 13 days |
| North West | 1.1 to 1.2 | +1% to +4% | 19 to 35 days |
| South East | 1.3 to 1.6 | +4% to +9% | 8 to 16 days |
| South West | 1.3 to 1.6 | +5% to +8% | 9 to 14 days |
Appendix 3: Roadmap steps
Full details of the Roadmap for England are available [footnote 9]. A summary is given here.
Step 1a: 8 March
- Schools and colleges return
- Higher education on practical courses return
- Recreation and exercise outdoors with household or support bubble, or with one person from outside their household
- Care home residents allowed one regular visitor
Step 1b: 29 March
- Outdoor sport and leisure facilities
- Rule of 6 or 2 households outside
Step 2: 12 April
- Non-essential retail
- Personal care
- Indoor leisure facilities
- Outdoor attractions
- Outdoor hospitality
Step 3: 17 May
- Indoor hospitality, entertainment, and leisure
- 30-person limit outside
- Rule of 6 or 2 households advised inside
- Return to face-to-face teaching for all higher education
- Large events (outdoor 50% capacity, limit 4,000; indoor 50% capacity, limit 1,000)
Step 4: No earlier than 19 July
Full unlock with long-term mitigations and guidance
-
The World Health Organisation recently recommended using letters of the Greek alphabet when referring to SARS-CoV-2 variants. Current variants of concern labelling stands as B.1.1.7 as alpha, B.1.351 as beta, P.1 as gamma, and B.1.617.2 as delta. ↩ ↩2
-
In each of these scenarios, R drops over time after 19 July as vaccination and infection reduce the number of people who remain susceptible. ↩
-
EMG, SPI-M and SPI-B: Considerations in implementing long-term ‘baseline’ NPIs; SAGE 87 22 April 2021 ↩
-
Public Health England COVID-19 vaccine surveillance report Week 26 ↩
-
Note, the transmission advantage of delta over alpha is included in these R excluding immunity estimates. ↩
-
Further scenarios with more pessimistic vaccine effectiveness assumptions are given in the accompanying modelling paper. ↩
-
The estimated intervals for R and growth rate may not exactly correspond to each other due to the submission of different independent estimates and rounding in presentation. ↩
-
Further details can also be found at COVID-19 Response – Spring 2021 (Summary) ↩