SPI-M-O: Summary of further modelling of easing restrictions – Roadmap Step 2, 31 March 2021
Updated 13 May 2022

© Crown copyright 2022
This publication is licensed under the terms of the Open Government Licence v3.0 except where otherwise stated. To view this licence, visit nationalarchives.gov.uk/doc/open-government-licence/version/3 or write to the Information Policy Team, The National Archives, Kew, London TW9 4DU, or email: psi@nationalarchives.gov.uk.
Where we have identified any third party copyright information you will need to obtain permission from the copyright holders concerned.
This publication is available at https://www.gov.uk/government/publications/spi-m-o-summary-of-further-modelling-of-easing-restrictions-roadmap-step-2-31-march-2021/spi-m-o-summary-of-further-modelling-of-easing-restrictions-roadmap-step-2-31-march-2021
Summary
1. R in England is estimated to be between 0.8 and 1.0, higher than that estimated before schools reopened (between 0.6 to 0.8). As yet, the full effect of schools has not been fully reflected in these estimates nor has the impact of easing restrictions from 29 March.
2. The modelling presented here does not account for waning immunity nor the future emergence of immune- or vaccine-escape variants. The B.1.351 strain of SARS-CoV-2 is of particular concern for the UK, given the known reduced protection against mild to moderate disease from some vaccines.
3. There is considerable uncertainty about the level of control that can be achieved at each step of the Roadmap, and therefore the subsequent trajectory of hospital admissions and deaths. It remains critical to evaluate the effect of each step before taking the next.
4. While more data have accrued on real-world vaccine effectiveness and coverage, modelling results remain highly dependent on assumptions about unknown factors including the rate of transmission at each step as a result of behaviour changes; the extent to which baseline measures continue to reduce transmission once restrictions are lifted; the impact of seasonal changes in transmission; and future vaccine rollout speed. High vaccine coverage (90% in under 50-year olds) is assumed here. Uncertainty increases when looking further into the future.
5. Any resurgence in hospital admissions and deaths following Step 2 of the Roadmap alone is highly unlikely to put unsustainable pressure on the NHS.
6. It is highly likely that there will be a further resurgence in hospitalisations and deaths after the later steps of the Roadmap. The scale, shape, and timing of any resurgence remain highly uncertain; in most scenarios modelled, any peak is smaller than the wave seen in January 2021, however, scenarios with little transmission reduction after Step 4 or with pessimistic but plausible vaccine efficacy assumptions can result in resurgences in hospitalisations of a similar scale to January 2021.
7. Maintaining baseline measures to reduce transmission once restrictions are lifted is almost certain to save many lives and minimise the threat to hospital capacity.
8. Even accounting for some seasonal variation in transmission, the peak could occur in either summer or late summer and autumn. It is possible that seasonality could delay or flatten the resurgence but is highly unlikely to prevent it altogether.
Key changes since the paper of 17 February:
-
Both Steps 1 and 2 (only) and the whole Roadmap have been modelled.
-
Uptake assumptions are slightly higher, reflecting observed behaviours and changes in stated intentions in polling. In line with ONS’s Opinion and Lifestyle Survey[footnote 1], the central scenario assumes 95% uptake in 50- to 80-year olds and 90% in 18- to 50-year olds, compared to 85% and either 85% or 75% respectively in the previous work, as suggested by then contemporaneous polling[footnote 2]. The latest published data shows that uptake has now exceeded 90% in all age groups over 60[footnote 3].
-
The central rollout scenario provided by the Cabinet Office is considerably slower, at an average of 2.7m doses per week in England until the end of July (2m thereafter), compared to 3.2m per week in the previous iteration (3.9m thereafter).
-
To reflect emerging evidence, Warwick now assume 90% effectiveness against both hospitalisation and deaths after 2 doses of either vaccine, compared to a weighted average of 84% for Imperial. Imperial have updated their Pfizer dose 1 vaccine effectiveness assumptions for hospitalisation and death.
-
London School of Hygiene and Tropical Medicine (LSHTM) have contributed modelling with independent assumptions, particularly assuming lower vaccine effectiveness and greater transmission after the end of the Roadmap.
Key assumptions in the central scenarios
Values here are for the central scenarios presented by Imperial and Warwick. Assumptions for sensitivity analyses, LSHTM’s model and other assumptions are given in Appendix 2.
Vaccine reduction in risk of infection
| AZ Dose 1 | AZ Dose 2 | Pfizer Dose 1 | Pfizer Dose 2 | |
|---|---|---|---|---|
| Imperial | 63% | 63% | 65% | 94% |
| Warwick | 60% | 65% | 60% | 85% |
Vaccine reduction in risk of symptomatic disease
| AZ Dose 1 | AZ Dose 2 | Pfizer Dose 1 | Pfizer Dose 2 | |
|---|---|---|---|---|
| Imperial | 63% | 63% | 65% | 94% |
| Warwick | 60% | 70% | 60% | 90% |
Vaccine reduction in risk of hospital admission
| AZ Dose 1 | AZ Dose 2 | Pfizer Dose 1 | Pfizer Dose 2 | |
|---|---|---|---|---|
| Imperial | 80% | 80% | 80% | 98% |
| Warwick | 80% | 90% | 80% | 90% |
Vaccine reduction in risk of death
| AZ Dose 1 | AZ Dose 2 | Pfizer Dose 1 | Pfizer Dose 2 | |
|---|---|---|---|---|
| Imperial | 80% | 80% | 80% | 98% |
| Warwick | 80% | 90% | 80% | 90% |
Coverage achieved
| Under 50s | 50- to 80- year olds | Over 80s | |
|---|---|---|---|
| Imperial | 90% | 95% | 95% |
| Warwick | 90% | 95% | 95% |
Seasonality
Imperial: 20% peak (February) to trough (August) variation in transmission
Warwick: none in central case, other than from school holidays; explored in sensitivity analyses
Rollout speed
These are based on 2 scenarios, provided by the Cabinet Office, that may not reflect the situation most likely to occur. Central scenario: 2.7m per week in England until the end of July and then 2m per week thereafter.
Slower scenario: 2.5m per week in England until the end of July and then 2m per week thereafter.
9. Details of the Roadmap along with the full set of assumptions are given in Appendices 1 and 2 respectively.
Current epidemic estimates
10. SPI-M-O’s best estimate for R in England is between 0.8 and 1.0 and the growth rate is between -4% and 0% per day. Schools began re-opening in England from 8th March, however, many did so in a staggered way. Both R and growth rate are indicators that lag by approximately 2 to 3 weeks and, therefore, cannot yet fully reflect the latest changes in policy or behaviour, including the complete impact of school re-opening. These estimates are based on data available up to 29 March.
11. In the week commencing 8 March, before school re-opening had had any impact on SPI-M-O’s estimates, R in England was between 0.6 and 0.8 and growth rate was between -6% and -4% per day.
12. R range estimates have been increasing over the past few weeks, with significant variation at the regional and local level. SPI-M-O is not confident that R now remains below 1 in any NHS England region with the upper limit of the range for all 7 regions equal to 1 (Table 1).
Table 1: Combined estimates of R values and growth rates in England, and NHS England regions (90% confidence interval)[footnote 4].
| Nation | R | Growth rate per day |
|---|---|---|
| England | 0.8 to 1.0 | -4%to 0% |
| NHS England Regions | R | Growth rate per day |
|---|---|---|
| East of England | 0.7 to 1.0 | -6% to -1% |
| London* | 0.7 to 1.0 | -5% to -1% |
| Midlands | 0.7 to 1.0 | -5% to -1% |
| North East and Yorkshire | 0.8 to 1.0 | -4% to 0% |
| North West | 0.8 to 1.0 | -4% to 0% |
| South East | 0.7 to 1.0 | -5% to -1% |
| South West* | 0.7 to 1.0 | -5% to 0% |
13. Care should be taken when interpreting the R and growth rate estimates for London and South West regions as these estimates are based on low case numbers and / or dominated by clustered outbreaks making them insufficiently robust to inform policy decisions alone. Estimates of R and the growth rates per day are less reliable and less useful in determining the state of the epidemic when disease incidence is low or where there is significant variability in the population, for example, local outbreaks. Both are average measures and will smooth over outbreaks at small spatial scales or over short periods of time.
14. There is considerable heterogeneity at a regional and sub-regional level that is not captured in these estimates. Areas with higher prevalence will be important for future patterns of infections as restrictions are eased. This will be potentially exacerbated if growth rates do not increase uniformly across the country.
Medium term projections and scenarios
15. SPI-M-O’s medium-term projections combine estimates from several independent models to consider the possible trajectory of the epidemic if no further changes were to take place. They represent what the trajectory of the epidemic might be if it continued to follow the trends seen in data up to 29 March. These are neither forecasts nor predictions and cannot fully reflect recent changes in transmission that have not yet filtered through into surveillance data, such as cases, hospital admissions, and deaths.
16. These do, however, include the impact of vaccinations and modelling groups have used data from contact surveys, previous findings[footnote 5], and their own expert judgement to incorporate the impact of re-opening schools. Projections are particularly uncertain during periods of transition and, as a result, these projections only extend for the next 4 weeks.
17. A subset of the same SPI-M-O models that are used to produce the medium-term projections have been used to explore the potential impact of the relaxation of restrictions to be introduced on 29th March in England. These scenarios assume R values of 0.8, 1.1, 1.3, and 1.5, and run for 4 weeks until 27th April to illustrate what SPI-M-O considers to be a plausible range of possible trajectories for COVID-19 hospital admissions in England. As with SPI-M-O’s medium-term projections, these scenarios include the impact of vaccines and take into consideration the estimated impact of school openings and Easter holidays on transmission.
18. The overlapping confidence intervals of these scenarios demonstrate that it will be difficult to differentiate between these scenarios ahead of any further easing decisions in England.
19. Figure 1 shows the combined scenarios for hospital admissions over a range of R values (0.8 – blue; 1.1 – yellow; 1.3 – red; 1.5 – green) in England and are run over a 4-week period from 30th March. SPI-M-O’s medium-term projection of the epidemic is included (grey band) to provide context if the current restrictions were maintained without the impact of any further easements, however, it is almost directly aligned with the blue band (R=0.8).
20. Even under a scenario where transmission increases to, for example, R=1.3 but not as high as R=1.5, no substantial increase in hospitalisations is expected over this 4-week period. Consequently, it will be difficult to determine what the impact of 29th March relaxations has been from this data stream before the end of April.
Figure 1: 4-week scenarios for daily hospital admissions in England over a range of R values (0.8 – blue; 1.1 – yellow; 1.3 – red; 1.5 – green) reflecting the possible impact of the easements from 29th March. All scenarios show interquartile ranges of model combinations as the shaded band.
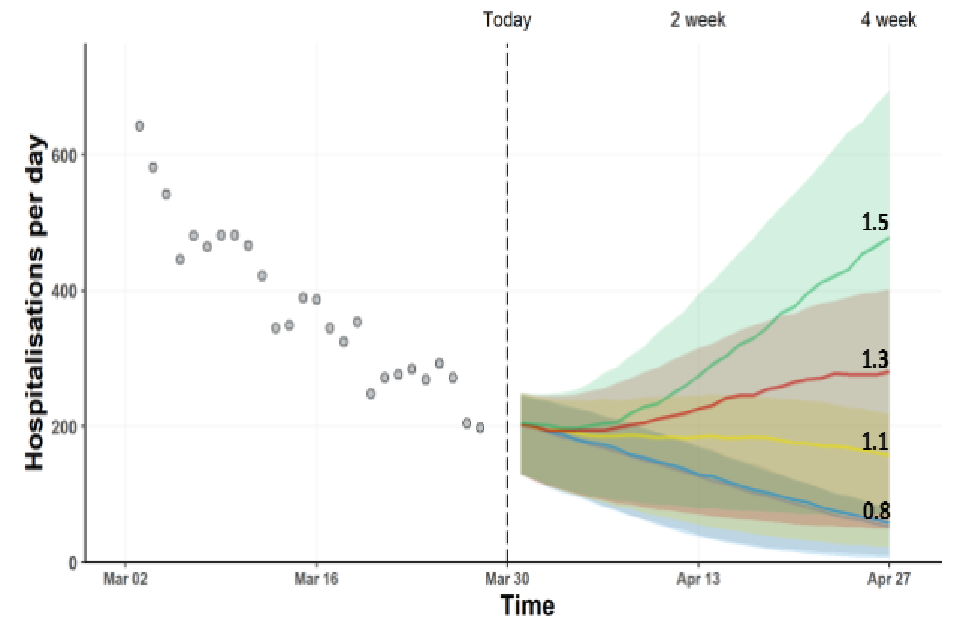
Fan chart showing admissions remain relatively flat in April when R=1.1, but rise in scenarios where R=1.3 or 1.5 on 29 March. Admissions continue to fall in the R=0.8 scenario and medium-term projections. Interquartile ranges overlap for all scenarios.
Estimated impact of Step 2 alone
21. SPI-M-O has considered the results from 3 academic groups that have independently modelled the effect of taking Step 2 of the Roadmap and not Steps 3 and 4. The scenario assumes that, after Step 2 is taken, population mixing is maintained at the same level indefinitely. While this specific scenario is highly unlikely, it allows an assessment of whether taking Step 2 could lead to an unsustainable rise in hospital admissions and deaths. A full set of modelling assumptions are given in Appendix 2. This modelling does not account for any further changes to Higher Education.
22. LSHTM have modelled a lower vaccine effectiveness than the other groups. These results are therefore considered later in this document as sensitivity analyses.
23. The trajectories of infections, hospital occupancy, and deaths for a range of plausible R estimates resulting from Step 2 of the roadmap (including changes made on 29th March) are given in Figure 2. Warwick estimate in their central scenario that Step 2 could increase
R (excluding the effect of immunity) from 1.49 (95% CI 1.27 to 1.65) to 1.76 (95% CI 1.59 to 1.90); Imperial College London model a similar increase up to 1.90 (95% CI 1.62 to 2.21).
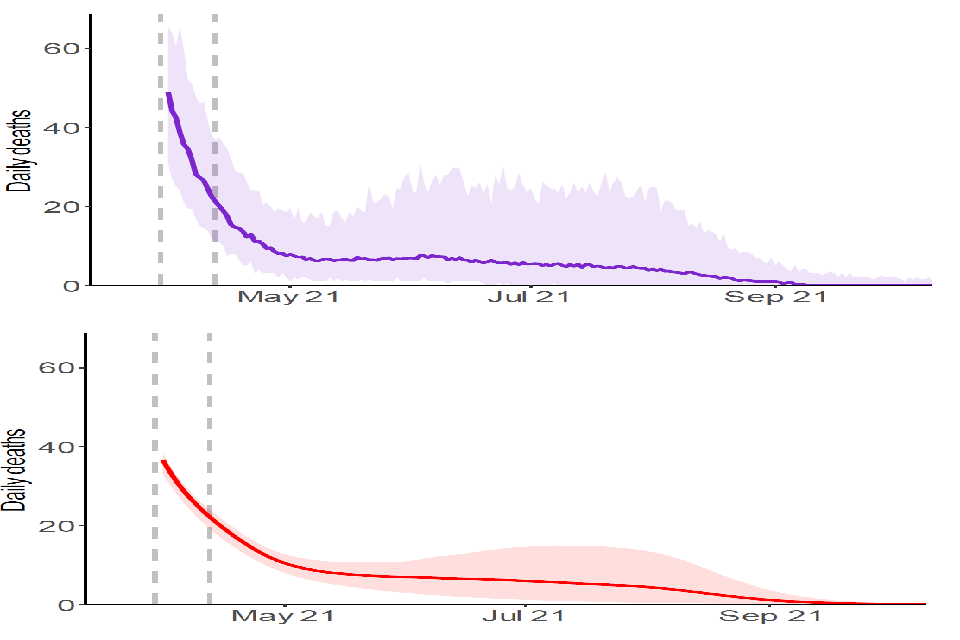
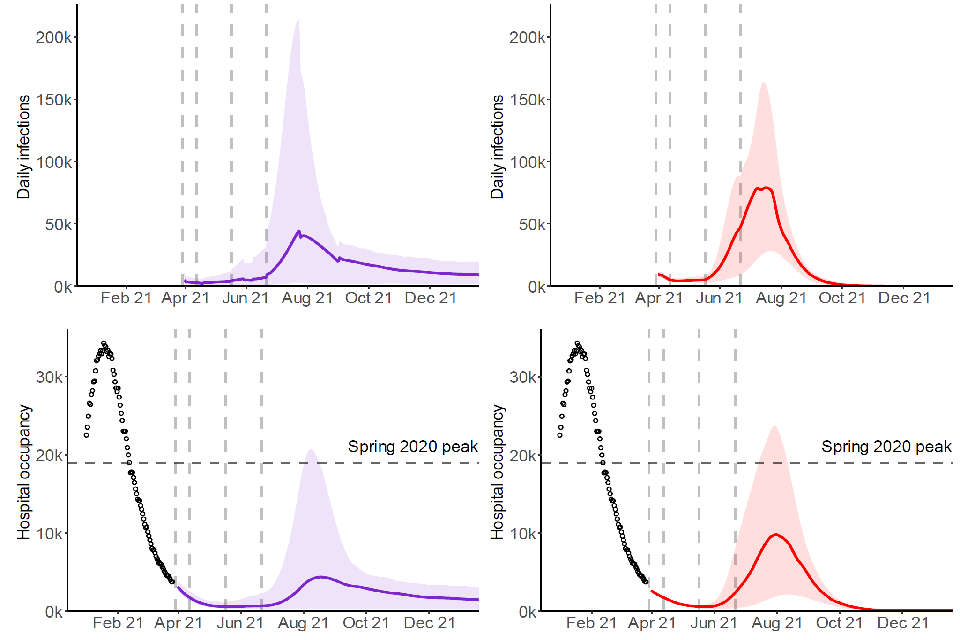
Figure 2: England infections (top), hospital bed occupancy (middle), and deaths (bottom) in the Imperial (left – purple) and Warwick (right – red) models, assuming central assumptions, including 90% uptake in the under 50-year olds. Shaded regions show the 95% credible intervals.
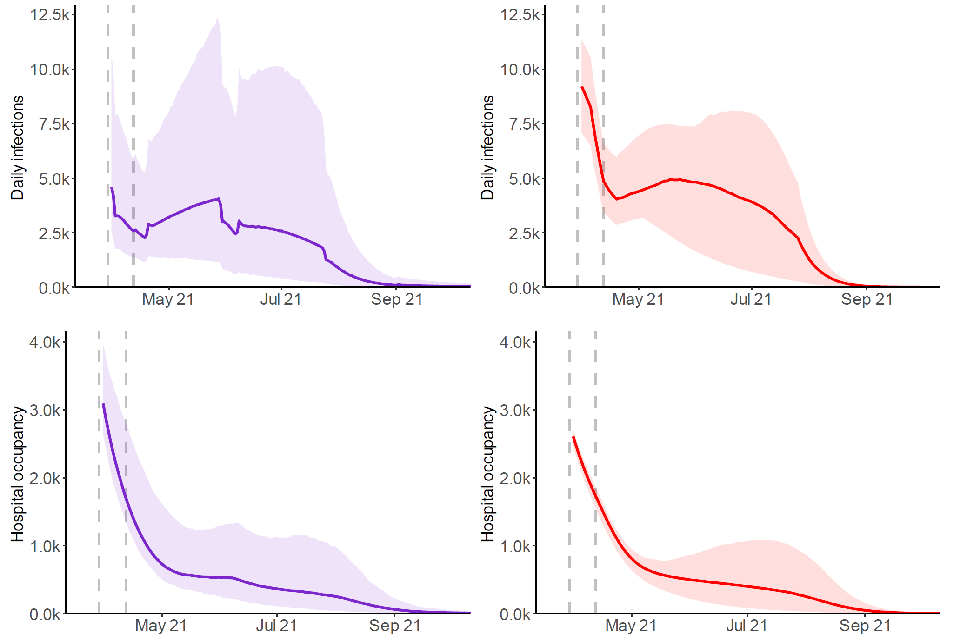
Two sets of line charts showing median occupancy and deaths decline or are relatively flat in both models if only Step 2 is taken, though credible intervals are also consistent with a modest increase in summer. Both models show a resurgence in infections.
Two sets of line charts showing median occupancy and deaths decline or are relatively flat in both models if only Step 2 is taken, though credible intervals are also consistent with a modest increase in summer. Both models show a resurgence in infections.
24. Warwick and LSHTM do not consider the impact of seasonality in their central scenario while Imperial assume a ±10% relative change throughout the year[footnote 6]. Based on sensitivity analyses (discussed later in this paper), including seasonality in the Step 2 modelling did not substantially affect the results beyond reducing and broadening the peak in hospitalisations compared to a scenario with no seasonality.
25. There is agreement that in this scenario, transmission is likely to increase such that the effective R slightly exceeds 1, resulting in an increase in incidence of infection. The ongoing vaccination programme, however, means that this leads to only a relatively modest increase in hospital admissions and deaths. The fairly broad credible intervals encompass a range of possible outcomes that are consistent with Step 2 alone resulting in either deaths and occupancy remaining flat, or doubling (albeit from a relatively low level).
26. In addition to their central scenario, Warwick consider a range of scenario analyses for the extent of transmission after Step 2 (Figure 3). As expected, the higher R is during this time, the larger the resurgence. It can take a long time until the combination of the vaccine rollout and increased immunity from infection counteracts this increase in transmission.
27. The highest rates of transmission result in several hundred deaths a day, but hospital occupancy remains below the peak seen in January 2021. Most scenarios, however, are considerably less pessimistic than this. In these scenarios, “R” denotes “R excluding the effect of vaccine or natural immunity”, so the effective R would be lower in each case.
Figure 3: Sensitivity analysis from the Warwick model of Step 2 only, considering the different impacts of R on the scale of resurgence as a result. Shaded regions show the 95% credible intervals.
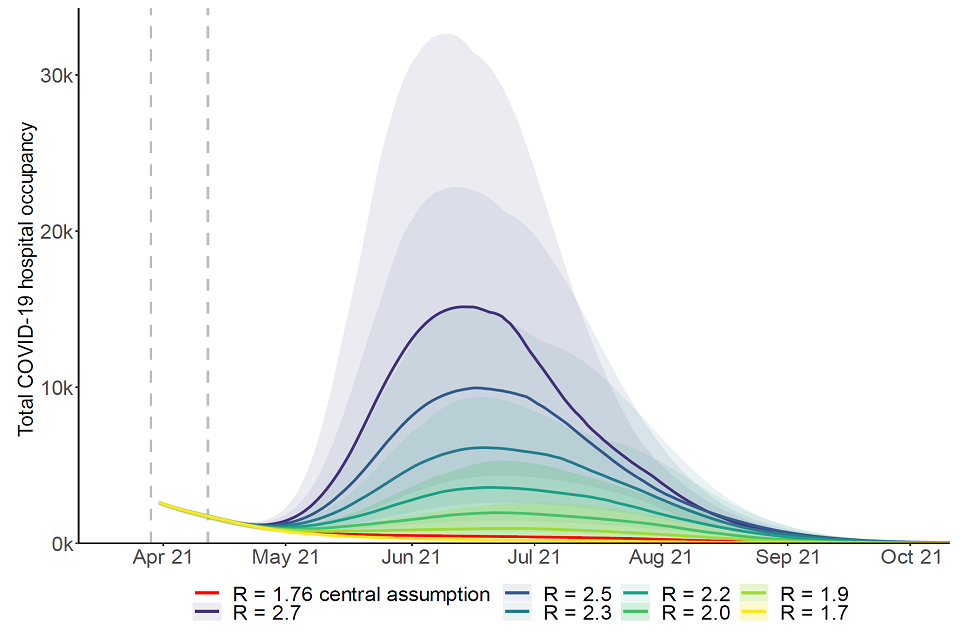
Line chart showing the scale of resurgence in hospital occupancy following Step 2 alone increases with R excluding immunity post-Step 2. Peak median occupancy after Step 2 rises over 8-fold between the default (Rei = 1.76) and highest scenarios (Rei=2.7).
Modelling of the whole Roadmap
28. The same 3 academic groups have also modelled the full Roadmap, with the assumption that each step of easing will be taken at the earliest possible date. Details of these dates and the changes due to occur at each step can be found in Appendix 1[footnote 7]. As previously stated, the scale of uncertainty in this and previous modelling means that it would be inadvisable to tie changes to dates without careful consideration of the situation at the time leading up to the proposed relaxation[footnote 8]. It remains critical to evaluate the effect of each step before taking the next.
29. In the central analyses of the full Roadmap, the 3 groups made assumptions that:
-
B.1.1.7 is the dominant strain and other novel variants of concern are not explicitly modelled;
-
Immunity does not wane (neither vaccine- nor infection-induced). The B.1.351 strain of SARS-CoV-2 is of particular concern for the UK given the known reduced protection against mild to moderate disease from some vaccines[footnote 9];
-
There is significant transmission reduction as a result of baseline measures remaining in place after Step 4; and
-
There is a moderate seasonal element to transmission (Imperial) or no seasonal element to transmission, other than school holidays (LSHTM and Warwick).
30. The results presented here may be very different if any of these assumptions were changed. Sensitivity analyses have been conducted to consider the impact of less stringent baseline measures, and waning immunity is not included in scenarios presented here; both are discussed later in this paper.
31. As with previous SPI-M-O modelling of easing restrictions, all scenarios from the 3 groups lead to a distinct third wave; there is significant uncertainty in both the timing and scale of its peak with results differing between the groups and across the sensitivity analyses. For the central scenarios modelled (with significant transmission reduction after Step 4, very high uptake and no waning immunity or escape variant), the peaks are estimated to be lower than those seen in January 2021 and likely below those seen in Spring 2020 (Figure 4). The resurgence is a result of some people (mostly children) being ineligible for vaccination; others choosing not to receive the vaccine; and others being vaccinated but not perfectly protected (including those who have only received 1 dose, rather than 2). This means population immunity – which is the reason the waves modelled here start to shrink – is not achieved from vaccination without further infections.
32. The resurgence in both hospitalisations and deaths is dominated by those that have received 2 doses of the vaccine, comprising around 60% and 70% of the wave respectively. This can be attributed to the high levels of uptake in the most at-risk age groups, such that immunisation failures account for more serious illness than unvaccinated individuals. This is discussed further in paragraphs 55 and 56.
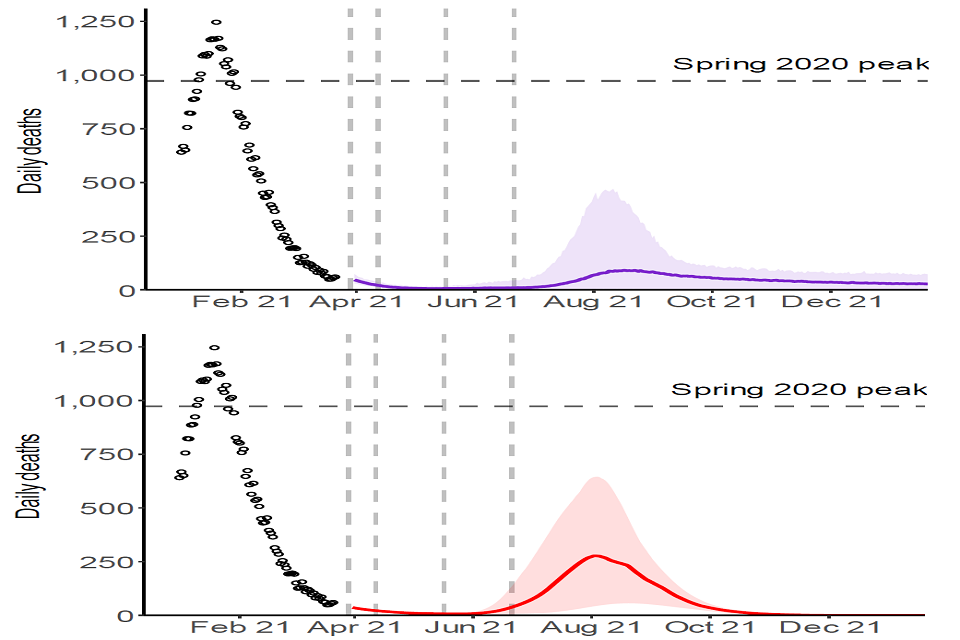
Figure 4: England infections (top), hospital bed occupancy (middle), and deaths within 28 days of a positive test (bottom) in the Imperial (left – purple) and Warwick (right – red) models, assuming central assumptions including 90% coverage in the under 50-year olds and significant reduction in transmission from baseline measures continue after Step 4. Peaks in occupancy and daily deaths from January 2021 and levels seen in Spring 2020 are shown by dashed horizontal lines. Vertical dashed lines show the dates at which each Roadmap step is taken. Shaded regions show the 95% credible intervals.
Two sets of fan charts showing a resurgence in infections, occupancy and deaths after Steps 2-4. Median occupancy peaks in July/Aug are below Spring 20 levels, but with wide intervals ranging above this. Warwick peaks are slightly higher than Imperial.
Two sets of fan charts showing a resurgence in infections, occupancy and deaths after Steps 2-4. Median occupancy peaks in July/Aug are below Spring 20 levels, but with wide intervals ranging above this. Warwick peaks are slightly higher than Imperial.
33. While still substantial, the total deaths and hospitalisations are lower in the central scenarios than in February’s modelling. One key reason for this is that uptake is assumed to be higher than the previous iteration of modelling, which assumed 85% uptake in 50- to 80-year olds in line with polling; this modelling assumes 95% as a result of further recent increases in vaccine acceptability. Efficacy of vaccination is also more optimistic. SPI-M-O’s earlier modelling also did not consider this particular set of options for relaxation and so no direct comparison is possible.
34. It is noteworthy that the resurgence in hospital admissions is accompanied by a very large number of infections, with daily incidence levels of 100,000 well within the modelled range. This demonstrates the changing relationship between infections and serious outcomes.
35. There are, however, still significant risks and uncertainties; the estimated impact on transmission of each step of easing remains unknown and novel variants of concern could have greater effects than previously considered. This could include the risk that relaxation plans could be overwhelmed with waves of hospitalisations and deaths larger than those seen during the peak in January 2021. The credible intervals shown in Figure 4 demonstrate that, even with several assumptions fixed, the Roadmap is consistent with either a small resurgence or one with peak hospital occupancy similar to Spring 2020.
Sensitivity to transmission after Step 3
36. One difference between the groups’ results in Figure 4 is the timing of the resurgence. A key driver of this is the assumptions made about transmission after Steps 3 and 4. Warwick results show large increases in transmission happening immediately after Step 3 of the Roadmap (with R_excluding_immunity of 2.4 to 2.7) whereas Imperial assume a smaller increase in transmission at this stage (with R_excluding_immunity of 1.8 to 2.6), which limits growth until the next month. As a result, Warwick’s modelling peaks in summer but Imperial’s modelling has a peak in late summer. This suggests it is not possible to predict the timing of the next resurgence with any degree of certainty.
37. SPI-M-O notes that, in the central scenario, the number of deaths and hospital admissions is likely to be low until at least late May 2021 because Step 2 is assumed to result in a relatively small increase in transmission. There are 5 further weeks of vaccination which significantly reduces the impact of Step 3. Bringing forward either Step 3 or 4 is almost certain to result in a significantly larger resurgence than holding to the dates modelled here.
38. The sensitivity of the size of the resurgence to the extent of control that can be achieved after Step 3 is further shown in Figure 5. Here, the Warwick model uses a range of different values for R (excluding the effect of immunity) in Step 3, as well as assuming a significant reduction in transmission is achieved in Step 4. It is clear that achieving a higher level of control after Step 3 significantly reduces and delays the peak of the resurgence, allowing the vaccination programme to have a greater effect. The red line in Figure 4 is the same as the red line in Figure 5.
Figure 5: England hospital bed occupancy in the Warwick model, for a range of values for R (excluding the effect of immunity) after Step 3, then significant reduction in transmission from baseline measures. Other parameters in line with their central scenario, including 90% uptake in under 50-year olds. Peaks in daily occupancy and deaths from January 2021 and levels seen in Spring 2020 are shown by dots and dashed horizontal lines respectively. Vertical dashed lines show the dates at which each Roadmap step is taken. Shaded regions show the 95% credible intervals.
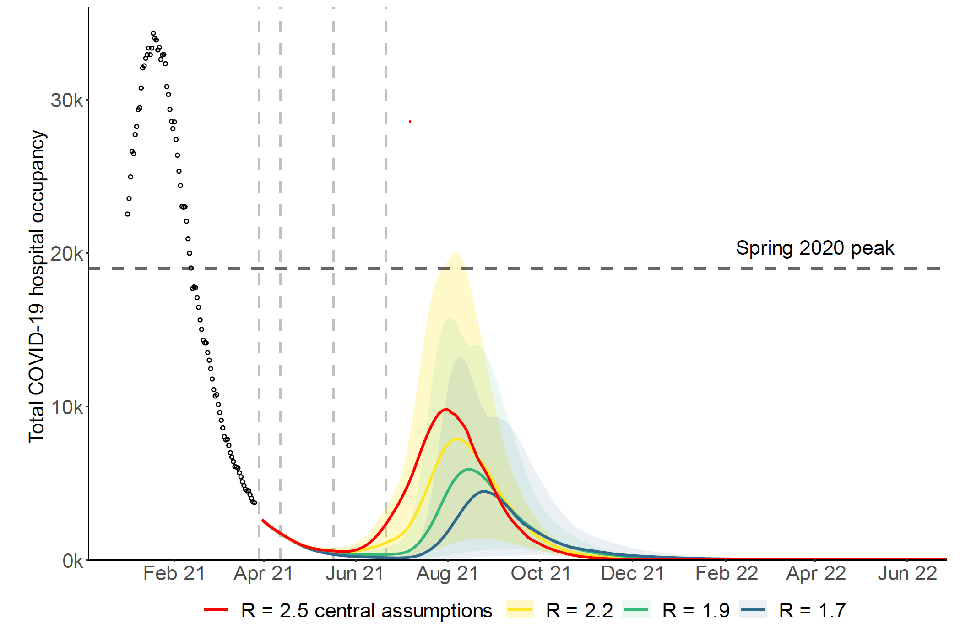
Fan chart showing the scale of resurgence in hospital occupancy increases and occurs earlier with the level of R excluding immunity post-Step 3. Peak median occupancy roughly halves from the default (Rei = 2.5) in the lowest scenario shown (Rei=1.7).
Sensitivity to transmission once all restrictions are lifted
39. SPI-M-O does not know the extent to which transmission could be reduced by baseline mitigation measures after Step 4. Such measures could be partially or exclusively voluntary; the modelling discussed here does not consider particular initiatives or policies after Step 4, but instead compares levels of transmission reduction to previous time points in the epidemic, for example, pre-pandemic levels or lockdown transmission levels. It is not possible to determine what set of policies would give the equivalent transmission reductions modelled here.
40. As previously advised by SPI-M-O[footnote 10], maintaining a large reduction in transmission from such measures after Step 4 is taken is almost certain to reduce the size of the subsequent resurgence. This latest modelling reinforces this finding, as lower adherence to baseline measures and the resulting increased transmission could lead to a peak close in scale to that seen in January 2021.
41. Figure 6 shows Imperial’s central scenario (solid line) and a sensitivity analysis (dashed line), which assumes only a modest reduction in transmission as a result of baseline measures remains once restrictions are lifted after Step 4. For their central scenario, R (excluding the effect of immunity) is assumed to be 3.0 (95% CI 2.3 to 3.8) during school terms, compared to around 4.5 if the country returned to pre-pandemic behaviours, indicating that a large reduction in transmission remains after Step 4. In the scenario analysis (dashed line), there is only a modest reduction in transmission as a result of baseline measures, with R (excluding the effect of immunity) returning to 4.0 (95% CI 3.3 to 4.8). This results in peak hospital occupancy levels comparable to previous waves.
Figure 6: England hospital bed occupancy in the Imperial model assuming significant (solid line) or modest (dashed line) reduction in transmission as a result of baseline measures after Step 4 of the Roadmap. Other parameters in line with their central scenario, including 90% uptake in under 50-year olds. Shaded regions show the 95% credible intervals.
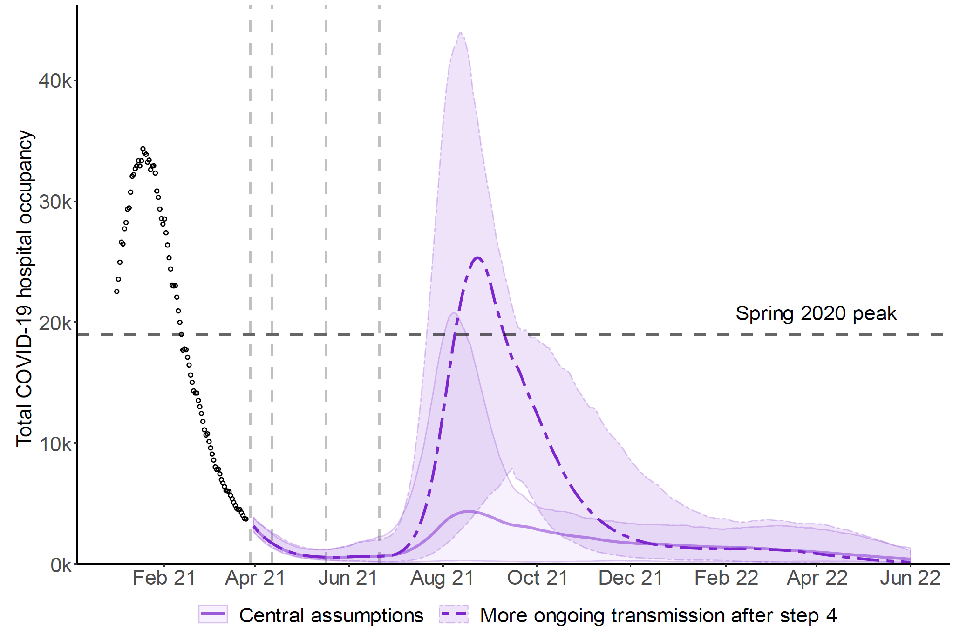
Fan chart showing a significantly larger resurgence in hospital occupancy if a modest reduction in baseline transmission (R=4.0) is assumed compared to the central assumption (R=3.0) – with a median peak almost 6-fold higher, and above spring 2020 levels.
Sensitivity to vaccine effectiveness
42. Although data on the real-world effectiveness of vaccination continues to emerge, there remain significant uncertainties, particularly with respect to the impact of second doses.
43. Figure 7 shows the results of Warwick modelling for 4 different sets of average second dose vaccine effectiveness assumptions, ranging from 65% against symptomatic disease and 80% against death (blue) to 85% against symptomatic disease and 95% against death (yellow)[footnote 11]. This shows that a resurgence in deaths (albeit relatively small) is highly likely under even the most optimistic set of effectiveness assumptions (yellow), and that even with significant baseline transmission reductions after Step 4, a resurgence of similar magnitude to January 2020 is plausible under more pessimistic vaccine effectiveness assumptions.
Figure 7: England hospital bed occupancy in the Warwick model assuming a range of different vaccine assumptions for vaccine effectiveness, significant reduction in transmission from baseline measures after Step 4, and no variants that escape immunity. Effectiveness assumptions range from 65% against symptomatic disease and 80% against death (blue) to 85% against symptomatic disease and 95% against death (yellow). Shaded regions show the 95% credible intervals. Further details in Appendix 2.
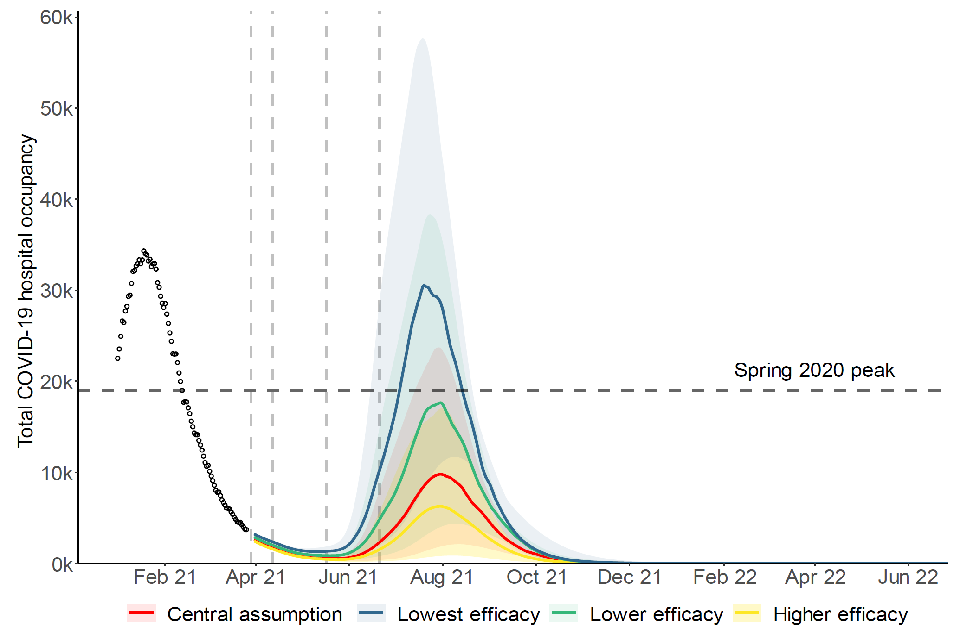
Fan chart showing the scale of resurgence in hospital occupancy increases with lower vaccine effectiveness. Under the lowest VE modelled, peak median occupancy is around 3-fold higher than the central scenario and similar to January 2021 levels.
44. Further sensitivity to a combination of lower vaccine effectiveness against infection and little transmission reduction from baseline measures following Step 4 is demonstrated by a comparison of LSHTM’s results to those of Imperial and Warwick. LSHTM assume that 2 doses of the AstraZeneca vaccine provide only 31% vaccine effectiveness against infection, and the R (excluding the effects of immunity) after Step 4 with schools open is 4.1. Results for Step 2 only are given in Figure 8 and for the whole Roadmap in Figure 9.
Figure 8: England hospital bed occupancy in the LSHTM model for Step 2 only, assuming 2 doses of AstraZeneca provide only 31% effectiveness against transmission and 85% against severe disease. Shaded regions show the 95% credible intervals.
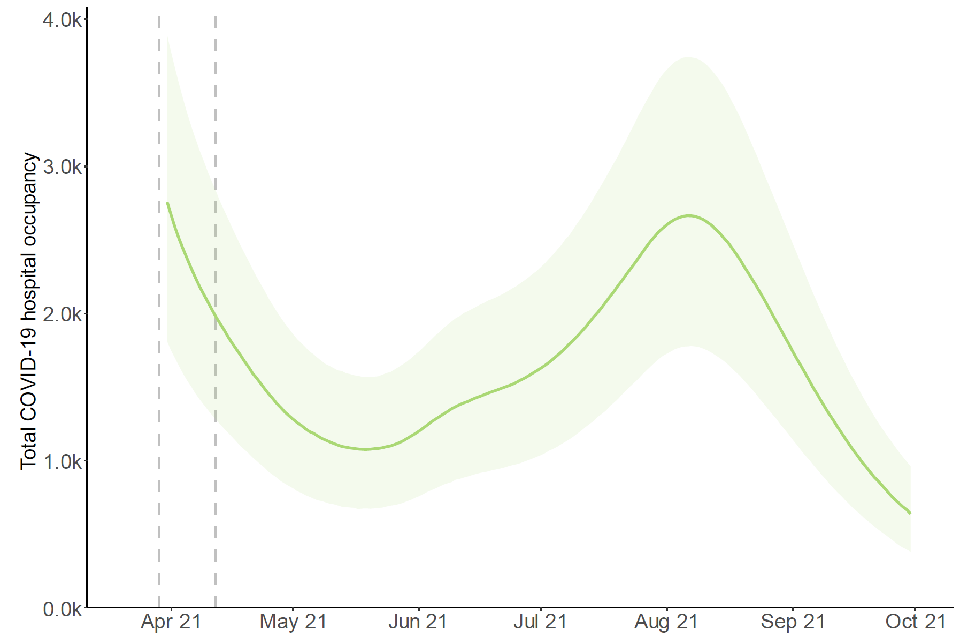
Line chart showing a resurgence in hospital occupancy (peaking in August) after Step 2 alone in the LSHTM model, above occupancy levels in the Imperial and Warwick models (Figure 2), but significantly lower than the spring 2020 and January 2021 peaks.
Figure 9: England hospital bed occupancy in the LSHTM model for the whole Roadmap, assuming 2 doses of AstraZeneca provide only 31% effectiveness against transmission and 85% against severe disease.
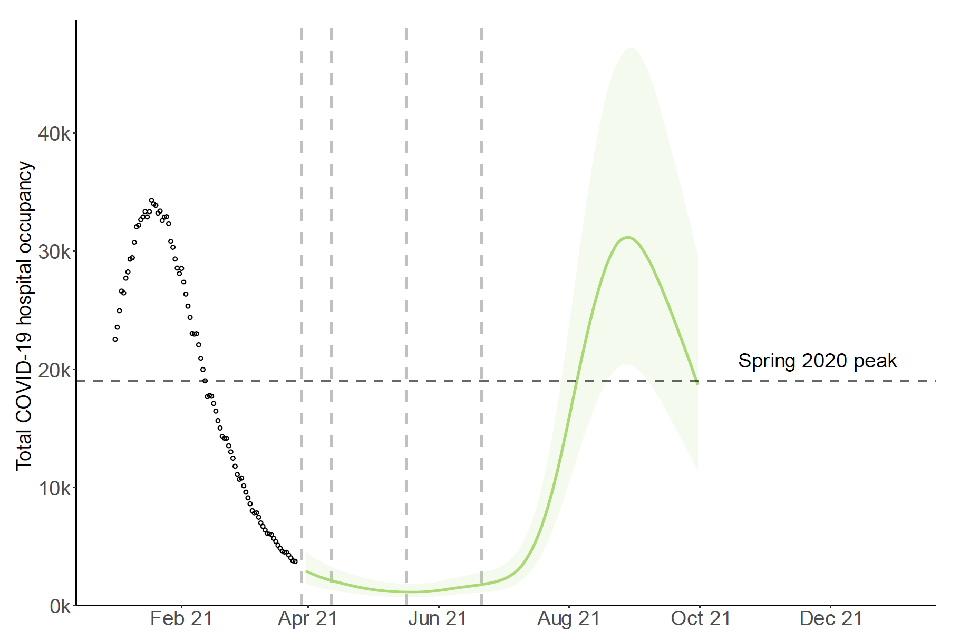
Fan chart showing a resurgence in hospital occupancy following the whole roadmap in the LSHTM model, peaking in late August and of similar magnitude to January 2021 levels. This is considerably higher than in the Imperial and Warwick models (Figure 4).
45. When considering Step 2 only (Figure 8), lower assumptions for vaccine effectiveness against infection results in a larger resurgence, with hospital occupancy approximately doubling, but remaining at considerably lower levels than in previous peaks.
46. When considering the whole Roadmap (Figure 9), the combination of lower vaccine effectiveness assumptions and limited effect of baseline measures results in a resurgence in hospitalisations of similar magnitude to that seen in January 2021. This is in line with Warwick’s finding for “lowest efficacy” in the sensitivity analysis, as shown in Figure 7.
Sensitivity to rollout speed
47. Two rollout scenarios have been modelled; the quicker of the two is presented in all the Figures here. This follows a scenario stipulated by Cabinet Office that assumes an average of 2.7m doses per week are administered in England until the end of July and 2m per week thereafter. A second slower scenario has also been modelled by each group, in which an average of 2.5m doses per week are administered in England until the end of July and 2m per week thereafter.
48. As the dates of second doses for the over 50-year olds are now largely fixed, this slower scenario has the effect of reducing the proportion of under 50-year olds who are protected at the time of Steps 3 and 4. The lower level of population immunity means the subsequent resurgence is larger but only marginally so, given the differences in rollout speed are relatively small. Details are provided in the accompanying modelling papers.
Sensitivity to seasonality
49. Work previously conducted by SPI-M-O groups has shown that seasonal variation in transmission could somewhat delay or flatten a peak of infections over the summer[footnote 12]. This could, however, mean infections increase more over the winter. SPI-M-O’s Consensus is that the peak-to-trough seasonality in transmission is between 10% to 30% (±5% to 15% from the midline), although there is low confidence in this estimate.
50. The seasonal effect may be due to intrinsic factors such as humidity or temperature that affect the virus itself, be related to behaviours of individuals that depend on the environmental conditions as they change through the year, or a mix of the two. Other mechanisms may also be important, as is the interaction with schools’ summer holidays.
51. It is possible that a summer of low prevalence could be followed by substantial increases in incidence over the following autumn and winter. Low prevalence in late summer should not be taken as an indication that SARS-CoV-2 has retreated or that the population has high enough levels of immunity to prevent another wave.
52. Any seasonality could also mean that the UK has the opportunity to build immunity through vaccination and manageable levels of infection over the spring and summer before increases in infections in autumn and winter, giving greater immunity when these increases happen and thus less disease burden and mortality.
53. SARS-CoV-2 is still a highly transmissible pathogen, irrespective of the time of year, and a resurgence in the summer is not out of the question, and this has been seen in other climates (for example, South Africa).
54. Figure 10 shows the sensitivity of the Warwick (left) and Imperial (right) models to seasonal variation in transmission (10% peak to trough variation in Warwick’s model, 20% in Imperial’s). In the Warwick model, the interplay of vaccination and infection-induced immunity means that seasonality only acts to shrink the resurgence. On the other hand, seasonality in the Imperial model both flattens and extends the epidemic. This demonstrates that seasonality could either delay or flatten the resurgence but is unlikely to prevent it altogether.
Figure 10: Results of the Warwick model (left) and Imperial model (right) with different assumptions for the seasonal variation in transmission from none (solid lines in both plots) to either ±5% (Warwick) or ±10% (Imperial). Assumes significant reduction in transmission from baseline measures after Step 4 and other central assumptions, including 90% uptake in under 50-year olds.
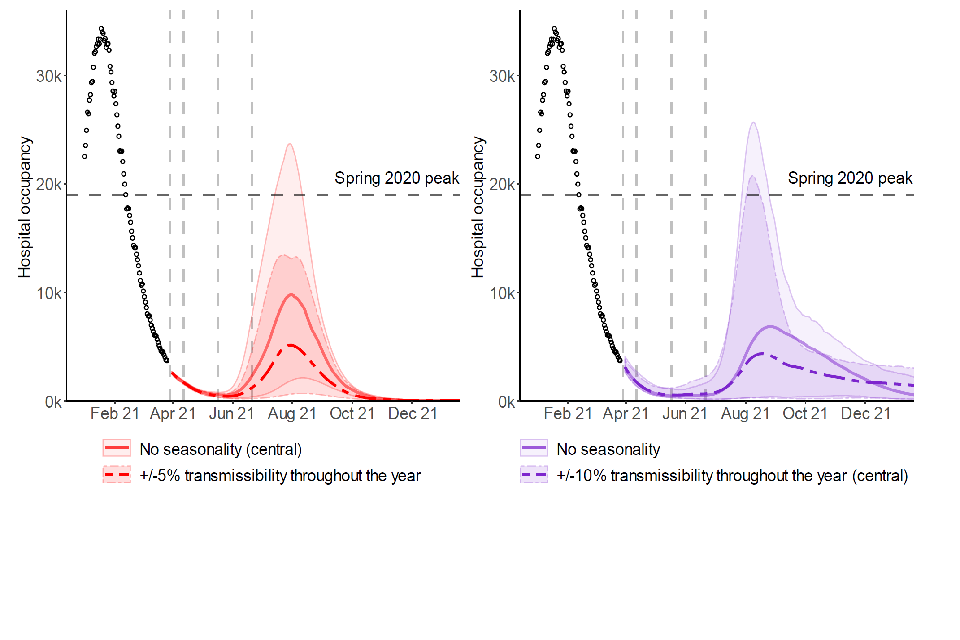
Two fan charts showing that adding seasonality reduces the summer resurgence in hospital occupancy in both models, with median peaks reducing by approximately 40-50%. In the Imperial model, seasonality also flattens the wave, extending it into winter.
Who becomes seriously ill in a resurgence?
55. Figure 11 illustrates the age and vaccination status of those hospitalised (left) and dying (rig t) over time in Warwick ’s central scenario for the whole Roadmap (equivalent to figure 4). The top plots are absolute numbers and the bottom plots are as a proportion of those admitted or dying.
56. This shows that most deaths and admissions in a post-Roadmap resurgence are in people who have received 2 vaccine doses, even without vaccine protection waning or a variant emerging that escapes vaccines. This is because vaccine uptake has been so high in the oldest age groups (modelled here at 95% in the over 50-year olds). There are therefore 5% of over 50-year olds who have not been vaccinated, and 95% x 10% = 9.5% of over 50-year olds who are vaccinated but, nevertheless, not protected against death. This is not the result of vaccines being ineffective, merely uptake being so high.
Figure 11: Results of the central scenario of the Warwick model, showing the age and vaccine status of those admitted to hospital (left) or dying (right) over time. Top plots are absolute numbers, bottom plots are proportions.
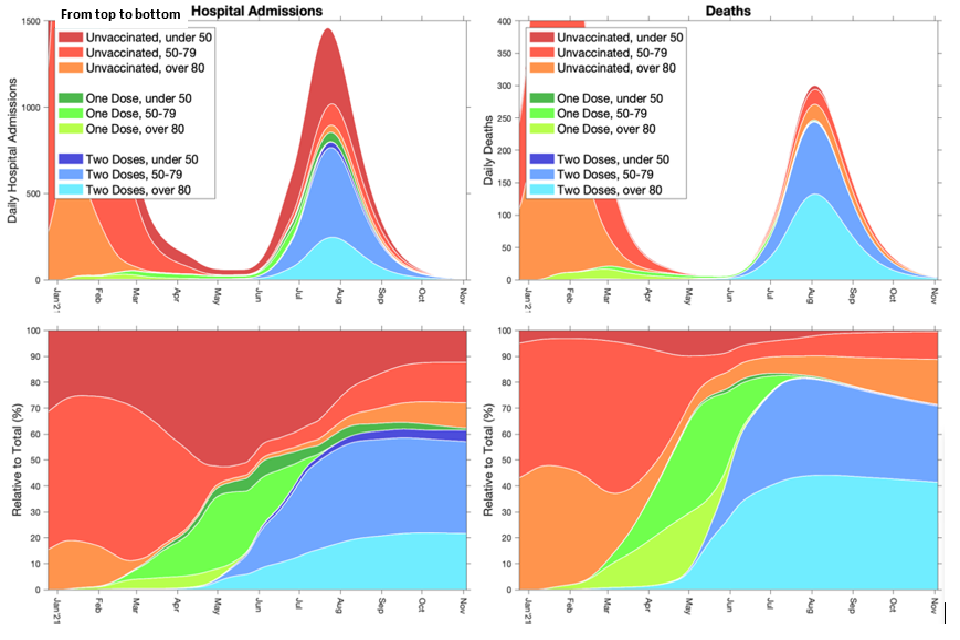
Four stacked area charts showing a rise in the proportion of admissions and deaths from vaccinated groups during 2021, plateauing at around 60% and 70% respectively by the end of the year. Deaths are almost entirely in older age groups above 50.
Implications of uneven vaccine coverage
57. These models do not account for vaccination coverage being different in different communities. Early evidence suggests that coverage has, so far, been lower in some minority ethnic groups. As a result, even if vaccination successfully drives down mortality and morbidity overall, it is highly likely that outbreaks will still happen in some communities.
How might a novel variant of concern suggest a reconsideration of easing restrictions is needed?
58. SPI-M-O has previously discussed the possible effect of novel variants of SARS-CoV-2 on transmission[footnote 13]. As measures begin to ease, SPI-M-O has considered what indications there could be that a new genetic variant of concern might warrant a reconsideration of the planned relaxations across the whole Roadmap.
59. The first signals of the emergence of a new variant, either by evolution within the UK or by importation, are likely to manifest in an increasing proportion of a given variant amongst sequenced samples; linked data such as that from COG-UK joined to vaccination data is a key data source to support such analyses. Increased prevalence of a new variant alone, however, is not necessarily a sign of concern but could be when seen in conjunction with:
- higher transmission rate (growth rate or R),
- reduced vaccine efficacy or reduced immunity from natural infection (symptomatic and severe reinfections or hospitalisations of previously infected/vaccinated individuals), and / or
- increased rates of mortality
60. Increased frequency of genetic mutations that are associated with potential or partial immune escape, such as E484K alone or in combination with other mutations, are also concerning. This could be due to evolution wit in variants, for example in the UK’s current dominant variant B.1.1.7, or importation of other new strains that already harbour these, such as B.1.351. The widespread transmission of a variant that circumvents vaccine-induced and naturally acquired immunity is a realistic possibility.
61. To date, the most recent lockdown combined with stringent travel restrictions have prevented large-scale importation of cases infected with variants of concern. Some parts of continental Europe have relatively high prevalence of B.1.351, and this variant in particular is of great concern, given the known reduced protection against mild to moderate disease from certain vaccines for this strain of SARS-CoV-2[footnote 14]; a large proportion of the UK population would be susceptible to B.1.351, whether they have been vaccinated or not. The models used here assume that the effectiveness of vaccines remains high and they do not consider the impact of new variants of concern.
62. If a variant of concern were to reduce vaccine effectiveness against severe disease and death with no reduction in transmission blocking, then similar shaped peaks of hospitalisations and deaths discussed here would likely be seen, albeit on a larger scale. If a variant of concern were to reduce vaccine effectiveness against transmission blocking (by reductions in either susceptibility or infectivity), however, the relationship between infections and severe outcomes could be completely different.
63. SPI-M-O considers slowing importation of new variants, such as B.1.351, into the UK a very important priority to allow for the next generation of vaccines to be developed. Whilst new vaccines can be developed, this will likely take many months. Measures to prevent and manage importation risks such as testing individuals, sequencing samples, and maintaining strict quarantine measures for those entering the country will remain important and may delay the spread of variants of concern.
64. It is highly likely that new vaccines will be required in the medium term; preparation for this requirement as well as measures to extend the period before said new vaccines are deployed will reduce the risk of a major surge in hospitalisations.
65. While SPI-M-O agree that the emergence and spread of some variants would be highly likely to cause issues for future relaxation plans, the committee cannot say when any reconsideration of relaxations may be required. This would entirely depend on the characteristics of the variant of concern at the time.
Waning immunity
66. These models assume that neither naturally acquired nor vaccine-induced immunity wane. This is likely to be an optimistic assumption as immunity to other coronaviruses is known to wane. Depending on the length of time immunity lasts, this has the potential to significantly exacerbate any resurgence beyond the analyses presented here. One of the accompanying modelling papers does consider its impact.
Spatial heterogeneity
67. There is considerable heterogeneity in prevalence across regions with isolated areas of concern. It is clear that some places within a region may be on a different epidemic trajectory compared with their broader region, however, these signals will not be clearly seen in the data until the rest of the region reaches a similar trajectory.
68. Some lower tier local authorities (LTLAs) are outliers with persistently high prevalence; others with high growth but increasing from a low incidence. These LTLAs are on very different epidemic trajectories to the country as a whole, or even the broad regions they lie within. It is important to continue to closely monitor such regional hotspots as restrictions are eased as these issues may be exacerbated and become major areas of concern in the future.
69. The modelling in this paper has focused on the national average, but regional breakdowns are available in the accompanying modelling papers. Given SPI-M-O’s consensus, it is highly likely there will be significant divergence regionally, if the epidemic grows as observed in early autumn 2020. It is possible to have what appears to be a controlled national scenario alongside a large regional or even several local epidemics, particularly in parts of the country which have had lower levels of vaccine uptake or fewer people previously infected.
Appendix 1: Scenario modelled
Full details of the Roadmap for England are available[footnote 15]. The relaxations considered within the modelling described here are an approximation of those below, using the equivalent impact of previous measures during the epidemic that are closest to those described. The earliest possible date for these easings are also included.
Step 1a: 8th March
- Schools and colleges return
- Higher education on practical courses return
- Recreation and exercise outdoors with household or support bubble, or with 1 person from outside their household
- Care home residents allowed 1 regular visitor
Step 1b: 29th March
- Outdoor sport and leisure facilities
- Rule of 6 or 2 households outside
Step 2: 12th April
- Non-essential retail
- Personal care
- Public buildings.
- Indoor leisure facilities
- Outdoor attractions
- Outdoor hospitality
Step 3: 17th May
- Indoor hospitality
- Indoor entertainment
- Indoor leisure
- 30-person limit outside
- Rule of 6 or 2 households advised inside
- Large events (outdoor 50% capacity – limit of 4,000; indoor 50% capacity – limit of 1,000)
Step 4: 21st June
*Full unlock with long-term mitigations and guidance
Appendix 2: Model assumptions
Vaccine reduction in risk of infection[footnote 16]
Imperial College
| Central | Pessimistic | |
|---|---|---|
| AZ 1 dose | 63% | 50% |
| AZ 2 dose | 63% | 50% |
| PF 1 dose | 65% | 55% |
| PF 2 dose | 94% | 90% |
LSHTM
| Central | |
|---|---|
| AZ 1 dose | 31% |
| AZ 2 dose | 31% |
| PF 1 dose | 70% |
| PF 2 dose | 85% |
Warwick
| Central | Very low | Low | Higher | |
|---|---|---|---|---|
| AZ 1 dose | 60% | 50% | 65% | 75% |
| AZ 2 dose | 65% | 50% | 65% | 75% |
| PF 1 dose | 60% | 50% | 65% | 75% |
| PF 2 dose | 85% | 50% | 65% | 75% |
Vaccine reduction in risk of symptomatic disease
Imperial College
| Central | Pessimistic | |
|---|---|---|
| AZ 1 dose | 63% | 50% |
| AZ 2 dose | 63% | 50% |
| PF 1 dose | 65% | 55% |
| PF 2 dose | 94% | 90% |
LSHTM
| Central | |
|---|---|
| AZ 1 dose | 73% |
| AZ 2 dose | 85% |
| PF 1 dose | 91% |
| PF 2 dose | 98% |
Warwick
| Central | Very low | Low | Higher | |
|---|---|---|---|---|
| AZ 1 dose | 60% | 65% | 75% | 85% |
| AZ 2 dose | 70% | 65% | 75% | 85% |
| PF 1 dose | 60% | 65% | 75% | 85% |
| PF 2 dose | 90% | 65% | 75% | 85% |
Vaccine reduction in risk of hospitalisation admission
Imperial College
| Central | Pessimistic | |
|---|---|---|
| AZ 1 dose | 80% | 70% |
| AZ 2 dose | 80% | 70% |
| PF 1 dose | 80% | 55% |
| PF 2 dose | 98% | 90% |
LSHTM
| Central | |
|---|---|
| AZ 1 dose | 73% |
| AZ 2 dose | 85% |
| PF 1 dose | 91% |
| PF 2 dose | 98% |
Warwick
| Central | Very low | Low | Higher | |
|---|---|---|---|---|
| AZ 1 dose | 80% | 80% | 85% | 90% |
| AZ 2 dose | 90% | 80% | 85% | 90% |
| PF 1 dose | 80% | 80% | 85% | 90% |
| PF 2 dose | 90% | 80% | 85% | 90% |
Vaccine reduction in risk of death
Imperial College
| Central | Pessimistic | |
|---|---|---|
| AZ 1 dose | 80% | 70% |
| AZ 2 dose | 80% | 70% |
| PF 1 dose | 80% | 55% |
| PF 2 dose | 98% | 90% |
LSHTM
| Central | |
|---|---|
| AZ 1 dose | 73% |
| AZ 2 dose | 85% |
| PF 1 dose | 91% |
| PF 2 dose | 98% |
Warwick
| Central | Very low | Low | Higher | |
|---|---|---|---|---|
| AZ 1 dose | 80% | 80% | 85% | 95% |
| AZ 2 dose | 90% | 80% | 85% | 95% |
| PF 1 dose | 80% | 80% | 85% | 95% |
| PF 2 dose | 90% | 80% | 85% | 95% |
Time to full vaccine protection
Imperial College
3 weeks (dose 1), 1 week (dose 2).
LSHTM
4 weeks (dose 1), 2 weeks (dose 2).
Warwick
2 weeks (dose 1), 2 weeks (dose 2).
Rollout speed (England basis)
Per Cabinet Office scenario:
- Fast: An average of 2.7m doses per week in England until week commencing 26 July and 2m per week thereafter
- Slow: an average of 2.5m doses per week in England until week commencing 26 July and 2m per week thereafter
11-week period between doses.
Coverage achieved (all ages)
Imperial College
| Central | Lower | |
|---|---|---|
| Over 50s | 95% | 95% |
| Under 50s | 90% | 80% |
| Care home residents | 95% | 95% |
| Care home workers | 85% | 85% |
LSHTM
| Higher | |
|---|---|
| 18-29 | 82.5% |
| 30-39 | 85.8% |
| 40-49 | 85.4% |
| 50-54 | 93.6% |
| 55-59 | 94.1% |
| 60-64 | 94.0% |
| 65-69 | 95.0% |
| Over 70-year olds | 98.85% |
Warwick
| Central | Scenarios | |
|---|---|---|
| Over 70s | Coverage per 29 March | Coverage per 29 March |
| 50-69 | 95% | 95% |
| Under 50 | 90% | 0-90% considered |
Vaccine prioritisation
Per JCVI ordering.
Variants
No impact of novel variants other than B.1.1.7.
R (excluding the effect of immunity) after each step of easing
Imperial College
Step 1a: 1.30 (95% CI 1.01 to 1.98)
Step 1b: 1.80 (95% CI 1.61 to 2.00)
Step 2: 1.90 (95% CI 1.62 to 2.21)
Step 3: 2.20 (95% CI 1.83 to 2.62)
Step 4:
- (central; higher impact from measures): 3.00 (95% CI 2.33 to 3.80)
- (lower impact from measures): 4.00 (95% CI 3.32 to 4.78)
R (excluding immunity) reduced by 0.5 during school holidays
LSHTM
| Lower | Central | Higher | |
|---|---|---|---|
| Step 1 | 2.09 | 2.09 | 2.09 |
| Step 2 | 2.20 | 2.37 | 2.49 |
| Step 3 | 2.35 | 2.54 | 2.68 |
| Step 4 | 3.73 | 4.11 | 4.23 |
Central estimates presented here; lower and higher estimates considered in accompanying paper.
R (excluding immunity) reduced by 0.3 to 0.5 during school holidays.
Warwick
Step 1: 1.49 (95% CI 1.27 to 1.65)
Step 2: 1.76 (95% CI 1.59 to 1.90)
Step 3: 2.53 (95% CI 2.40 to 2.69)
Step 4:
- (central): 2.97 (95% CI 2.79 to 3.14)
- (high scenario): 3.53 (95% CI 3.31 to 3.70)
- (low scenario): 2.53 (95% CI 2.35 to 2.70)
Compared to a baseline of R (excluding immunity) of approximately 4.3 with pre-COVID-19 behaviours.
Seasonality
Imperial College
20% peak (February) to trough (August) variation in transmission.
LSHTM
None.
Warwick
None (central).
5% to 25% peak to trough (scenario analyses).
Waning immunity
Imperial College
None over the timescale modelled.
LSHTM
None in results presented here, but considered in accompanying paper.
Warwick
None over the timescale modelled.
School holidays
Imperial College
Modelled.
LSHTM
Modelled.
Warwick
Modelled.
-
Coronavirus and the social impacts on Great Britain: 26 March 2021, Office for National Statistics ↩
-
COVID-19: Willingness to be vaccinated tracker, YouGov; YouGov COVID-19 Behaviour Tracker Data Hub, Imperial College London ↩
-
NHS England COVID-19 Vaccination Statistics, 25 March 2021 ↩
-
The estimate intervals for R and growth rate may not exactly correspond to each other due to the submission of different independent estimates and rounding in presentation. * Particular care should be taken when interpreting these estimates as they are based on low numbers of cases and / or dominated by clustered outbreaks and so should not be treated as robust enough to inform policy decisions alone. ↩
-
SPI-M-O: Statement on relaxation of NPIs and the re-opening of schools; SAGE 78, 28 January 2021 ↩
-
Analysis from Baker et al (2020) suggest seasonality in the UK is between 6% and 14% based on the observed dynamics of coronavirus OC43, and coronavirus HKU1; although both higher and lower values are plausible depending on characteristics of SARS-CoV-2 and the weather during the 2021 summer. ↩
-
Further detail can also be found at COVID-19 Response – Spring 2021 (Summary) ↩
-
SPI-M-O: Summary of modelling on scenarios for easing restrictions; SAGE 80 11 February 2021; SPI-M-O: Summary of modelling on roadmap scenarios; SAGE 81 18 February 2021 ↩
-
Efficacy of the ChAdOx1 nCoV-19 COVID-19 vaccine against the B.1.351 variant, Madhi et al. New England Journal of Medicine, 16 March 2021 ↩
-
SPI-M-O: Summary of modelling on scenarios for easing restrictions; SAGE 80 11 February 2021; SPI-M-O: Summary of modelling on roadmap scenarios; SAGE 81 18 February 2021 ↩
-
Full details of the assumptions are given in Appendix 2 ↩
-
SPI-M-O: Summary of further modelling of easing restrictions; SAGE 81, 18 February 2021 ↩
-
SPI-M-O: Consensus statement on COVID-19; SAGE 80, 11 February 2021 ↩
-
Efficacy of the ChAdOx1 nCoV-19 COVID-19 vaccine against the B.1.351 variant, Madhi et al. New England Journal of Medicine, 16 March 2021 ↩
-
Further details can also be found at COVID-19 Response – Spring 2021 (Summary) ↩
-
Very low, low and higher efficacy assumptions for Warwick are based on weighted averages of the 2 vaccines (30% PF, 70% AZ) ↩