SPI-M-O: Consensus statement on COVID-19, 2 February 2022
Published 18 February 2022

© Crown copyright 2022
This publication is licensed under the terms of the Open Government Licence v3.0 except where otherwise stated. To view this licence, visit nationalarchives.gov.uk/doc/open-government-licence/version/3 or write to the Information Policy Team, The National Archives, Kew, London TW9 4DU, or email: psi@nationalarchives.gov.uk.
Where we have identified any third party copyright information you will need to obtain permission from the copyright holders concerned.
This publication is available at https://www.gov.uk/government/publications/spi-m-o-consensus-statement-on-covid-19-2-february-2022/spi-m-o-consensus-statement-on-covid-19-2-february-2022
All probability statements are in line with the framework given in the Annex.
Potential for growth in transmission
1. Both behaviour change and the testing and isolation of infected people are acting to reduce transmission of SARS-CoV-2. SPI-M-O has been asked to consider the extent to which all measures and behaviour change are currently reducing transmission, compared to a pre-pandemic baseline.
2. The University of Warwick has estimated that, at present, a combination of measures and behavioural change since before the pandemic (such as, but not limited to testing, self-isolation, mask wearing, increased home working and the avoidance of high-risk settings) are reducing transmission by approximately 20% to 45%.
3. Warwick’s estimates are equivalent to there being the potential for transmission to increase by between around 25% to 80% if the population were to return to pre-pandemic behaviours and no mitigations. [footnote 1] SPI-B is considering how behaviour is likely to change in the medium to long term as the Omicron wave subsides and the remaining measures are lifted. Warwick’s analysis indicates that, while behaviour change following the lifting of restrictions has previously been gradual, a sudden change, such as an end to testing and isolation, has the scope to lead to a return to rapid epidemic growth.
4. Other factors that could act to increase or decrease transmission include waning immunity, novel variants, seasonality, and the build-up of immunity from vaccines and infection. The BA.2 variant may have a growth advantage over other Omicron sub-lineages. If this were the case, it is possible that SPI-M-O’s medium-term projections may underestimate the short-term trajectory of hospitalisations.
Evaluation of medium-term scenarios
5. On several occasions over the past 2 years, SPI-M-O has produced sets of medium-term scenarios. These are sets of scenarios in which the reproduction number, R, is set to a specific value from a given date. After this, the only change in transmission comes from a build-up in immunity. These are not forecasts nor predictions, but provide both a structured way of thinking about the implications of different changes in transmission in advance, and to evaluate the impact of those changes after implementation.
6. Figure 1 shows 5 sets of medium-term scenarios for hospital admissions in England that align to Step 3 of February’s Roadmap for removing restrictions (May 2021); Step 4 of the Roadmap (July 2021); the end of school summer holidays (September 2021); the start of winter (November 2021); and the removal of Plan B measures (January 2022). [footnote 2]
7. Of the 4 sets of modelling which can currently be evaluated, the first 2 tracked around the central scenarios modelled. In the third, the (relatively modest) increase in admissions happened later than had been expected following the return of schools. The fourth, produced prior to the emergence of the Omicron variant, was in line with the higher growth scenario before diverging as Omicron rapidly increased transmission.
8. One striking factor is that between the end of the ‘pingdemic’ (July) and the start of the Omicron wave in December, hospital admissions were relatively flat, with no periods of sustained rapid growth or decline. Although admissions to hospital were broadly flat, there were large changes in infection rates in different age groups at different times.
Figure 1: Projected COVID-19 daily hospital admissions in England, if the reproduction number, R, were to change to different values (indicated by different colour lines) at different time points (the vertical dashed lines give the dates the projections were made, based on the latest available data at the time). The overlaid circles are the number of admissions that occurred. Shaded bands show the interquartile ranges of the model combinations. The different values of R considered here are given in the table below. Note the log scale.
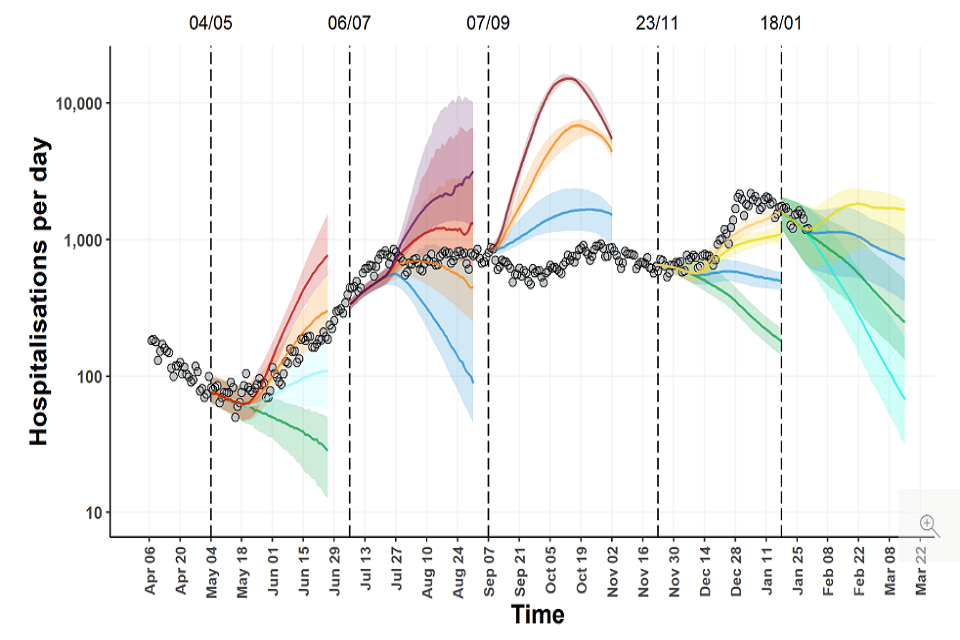
Fan chart showing admissions increasing in May and June 2021, before plateauing from July and rising in December. They broadly track scenarios modelled in the first two scenario sets and fourth set pre-omicron, but are below modelled scenarios in Autumn.
Table 1: Values of R used in Figure 1, and their associated dates.
| Date of change | R values and colour (given from bottom to top in each set of scenarios) |
|---|---|
| 17 May 2021 | 0.9 – green 1.2 – pale blue 1.5 – orange 1.8 – red |
| 19 July 2021 | 1.1 – blue 1.5 – orange 1.8 – red 2.1 – purple |
| 6 September 2021 | 1.1 – blue 1.5 – orange 2.0 – red |
| 6 December 2021 | 0.9 – green 1.1 – blue 1.3 – yellow 1.4 – pale orange |
| 26 January 2022 | 0.7 – pale green 0.9 – green 1.1 – blue 1.3 – yellow |
Annex: PHIA framework of language for discussing probabilities

0 to 5% remote chance.
10% to 20% highly unlikely.
25% to 35% unlikely.
40% to 50% realistic possibility.
55% to 75% likely or probably.
80% to 90% highly likely.
95% to 100% almost certain.
-
If mitigations and behaviour reduce transmission by 20%, then it would have to increase by 0.2/(1-0.2) = 25% to reach unmitigated levels. Similarly, 0.45/(1-0.45) = 82%. ↩
-
SPI-M-O: Summary of further modelling of easing restrictions – roadmap step 3, 5 May 2021, SAGE 88, 5 May 2021; SPI-M-O: Summary of further modelling of easing restrictions – Roadmap Step 4 on 19 July 2021, 7 July 2021, SAGE 93, 7 July 2021; SPI-M-O: Consensus statement on COVID-19, 8 September 2021, SAGE 95, 9 September 2021; SPI-M-O: Consensus statement, 24 November 2021, SAGE 97, 29 November 2021; SPI-M-O: Consensus statement on COVID-19, 19 January 2022, SAGE 104, 28 January 2022. ↩