SPI-M-O: Consensus statement on COVID-19, 12 January 2022
Updated 13 May 2022

© Crown copyright 2022
This publication is licensed under the terms of the Open Government Licence v3.0 except where otherwise stated. To view this licence, visit nationalarchives.gov.uk/doc/open-government-licence/version/3 or write to the Information Policy Team, The National Archives, Kew, London TW9 4DU, or email: psi@nationalarchives.gov.uk.
Where we have identified any third party copyright information you will need to obtain permission from the copyright holders concerned.
This publication is available at https://www.gov.uk/government/publications/spi-m-o-consensus-statement-on-covid-19-12-january-2022/spi-m-o-consensus-statement-on-covid-19-12-january-2022
All probability statements are in line with the framework given in Annex.
Situation update
1. SPI-M-O continues to consider how the waves of omicron infections and hospitalisations are spreading through the population from a variety of data sources, both by age group and at different spatial scales.
2. Patterns of cases as a result of testing, particularly in the community, remain affected by several possible confounding factors in recent weeks and so should be interpreted with caution. Testing behaviours pre- and post- the festive period, day of week effects, and recent changes in testing policies may all make trends difficult to interpret. Combinations of past exposure, vaccine coverage, behaviour, testing patterns, movement around the country, and differences between age groups will make fine temporal patterns very volatile and peaks are likely to happen at different times in different places. London, for example, has seen a higher proportion of test positivity before Christmas and lower after Christmas, whereas other regions are seeing the reverse. It will therefore be very difficult to identify or project the timing of peak omicron infections across the country.
3. This regional and age-related heterogeneity is also reflected in the latest ONS COVID-19 Infection Survey (CIS); this data source, while lagged, will be the best indicator as to whether the peak has happened. As yet, there is no sign of a purely immunity-driven peak occurring in either the case data or the CIS for the UK or England. Peaks of infections have often been asymmetric in nature during COVID-19 with many more than half of infections happening during the population decline stage and so a long tail may still need managing, even after the peak.
4. SPI-M-O has previously discussed the expectation to see outbreaks in hospital and care home settings during this wave, given omicron’s immune escape potential [footnote 1]. Analysis from the University of Manchester considering the case fatality rate within care homes projects an increase in deaths in the near term in such settings. This increase, however, is on a smaller scale, and is consistent with a much lower case fatality rate, than those seen in previous waves of the epidemic. This is highly likely a result of the combination of omicron’s decreased intrinsic severity and high vaccine effectiveness.
5. Transmission is evidently currently happening within, and case numbers are increasing in, older age groups. The expected associated increases in hospital admissions, however, are not observed. There may be a variety of possible explanations for this.
- Changes in community treatment of COVID-19, such as the use of oximetry from home, virtual wards, and the use of antiviral medications, may have lowered the general risk of hospitalisation given infection.
- There may be fewer hospitalisations (including from care homes) as a result of improved vaccine effectiveness (with higher estimates in more recent UKHSA updates), slower than expected or less waning of protection from vaccination particularly in older age groups, and/or reduced severity of omicron.
- Potential changes in behaviour, both in terms of precautionary behaviour (especially amongst those who are most vulnerable themselves and those around them), health-seeking behaviour, and increased use of testing to manage individual risk.
6. It is possible that there is a mix of trends happening at once, such as the replacement of hospitalisations as a result of delta infection by omicron and the timing of this. Nosocomial transmission within healthcare settings may also be playing a role, as may the changing proportion or number of hospital admissions as a result of COVID-19 versus those in hospital with incidental COVID-19 (admitted to hospital for a different reason).
7. Previous modelling by SPI-M-O groups [footnote 2] assumes the same protective effect of vaccinations across different age groups. Evidence from the EAVE II study in Scotland shows that COVID-19 hospitalisation rates (for individuals admitted to hospital for any reason within 14 days of community testing where the individual was not in hospital at the time of test) are lower in those infected with an S-gene negative virus, where S-gene negative status is a proxy for omicron, than with an S-gene positive virus (Figure 1). This indicates that the realised protective effect of vaccinations (and boosters in particular) remains strong in older age groups, even against omicron. More data is required to explicitly estimate the differential effect of vaccines by age.
Figure 1: COVID-19 hospitalisations among those who tested positive in the community from the EAVE II study in Scotland – rates by age group and S-gene status (S-gene negative – red; S-gene positive – blue).
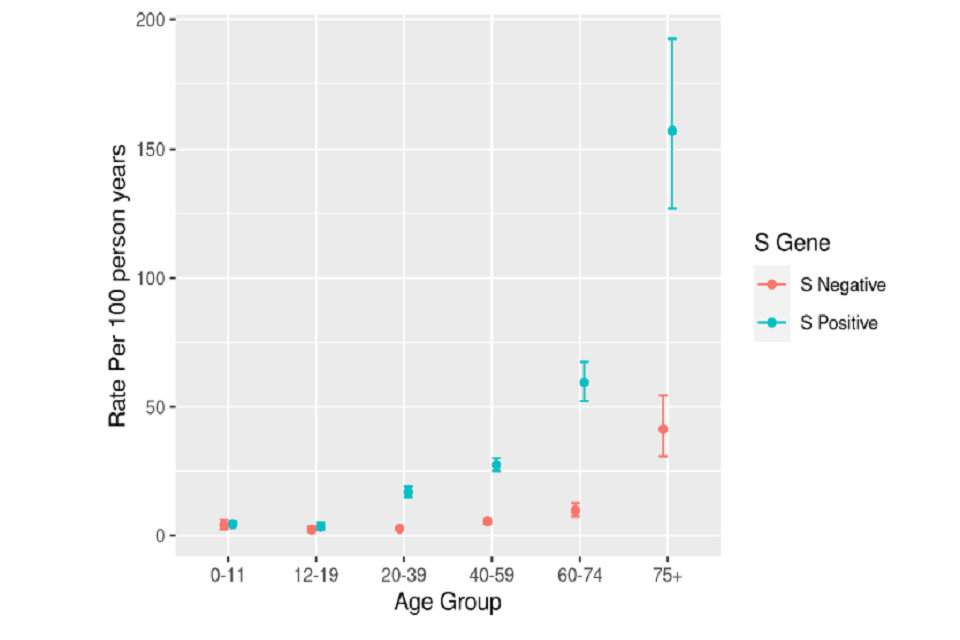
Dot plot (with ranges) showing that the rate of hospitalisation per 100 person years is higher for S-positive cases than S-negative cases, and for older age groups. In the 75+ group, the rate for S-positive is over three times higher than for S-negative.
8. It remains possible that apparent slowing increase or plateaus in hospital admissions may actually still be confounded by the impact of the festive period and its associated data lags. The slowing or drop in hospitalisations may still reflect more precautionary mixing, for example, before family gatherings over Christmas. More time is required to be able to say with any certainty that the epidemic trajectory is declining; it is just as likely that hospital admissions will remain at their current level or start to increase again, as it is that they will decrease rapidly.
Generation times
9. As discussed in SPI-M-O’s last consensus statement[footnote 3], a virus’s generation time is the average time between someone becoming infected and that person infecting others[footnote 4], and this can affect how much behaviour change is required to curb the spread of a variant. Further evidence that omicron’s generation time is likely to be shorter than that of delta continues to accrue. New analyses from London School of Hygiene and Tropical Medicine (LSHTM) [footnote 5] that use a different methodology from those previously presented to SPI-M-O show that the relative, time-varying transmission advantage observed for omicron in England during December 2021 displays patterns that are consistent with a shorter generation time. This work estimates that the mean generation time for omicron is between 1.5 to 3.2 days, which is approximately 30% shorter than LSHTM’s generation time estimates for delta and are similar to those estimates from South Korea and previously reported analyses from UKHSA. As also is the case with UKHSA’s previous work, this analysis finds that the mean generation time for omicron is lower than that of delta, but with a longer-tailed distribution.
10. These estimates of generation time, as with other estimates, fit well to the available data, but potentially remain confounded. For example, this analysis assumes that any change in reproduction number affects omicron and delta variants equally and at the same time; this may not be the case if each variant is spreading within different subgroups of the population, for example in different age groups, or those who have received different vaccination types, or if behaviour changes affected different variants at different points in time or in their epidemic trajectory.
Recent behaviour change – impact of Plan B
11. The University of Bristol developed a rapid online survey of risk mitigation behaviours that was deployed to 2 UK longitudinal cohort studies to investigate what respondents reported around their own risk mitigation behaviours. Over 95% reported taking some risk mitigation measures, with being fully vaccinated and using home testing kits the most frequently reported behaviours. Less than half of respondents (40%) reported that these changes were due to Plan B implementation, as opposed to voluntary behaviour change.
12. The group then used these data within their individual-based probabilistic model to estimate the impact such measures have on social contacts and COVID-19 transmission and ultimately the effective reproduction number and cumulative infections, hospital admissions, and deaths in England. This leads to an estimated decrease of 25% in the number of cumulative infections and, for example, a reduction in effective R from 2.5 to 3.5, to 1.8 to 2.2, suggesting a substantial impact on transmission, although not enough to reduce effective R below one. This is an important quantification of the impact of different behaviours and the relationship between policy-driven and spontaneous behaviour change. It is the first time that SPI-M-O has been able to see quantified behaviour change reflected in this way in model outputs.
Annex: PHIA framework of language for discussing probabilities

0 to 5% remote chance.
10% to 20% highly unlikely.
25% to 35% unlikely.
40% to 50% realistic possibility.
55% to 75% likely or probably.
80% to 90% highly likely.
95% to 100% almost certain.
References
-
SPI-M-O: Consensus statement on COVID-19, 15 December 2021; SAGE 99. ↩
-
SPI-M-O: Consensus Statement on COVID-19; University of Warwick: Omicron modelling; LSHTM: Omicron scenarios: 28 December restrictions; 23 December 2021 SAGE 101. ↩
-
SPI-M-O: Consensus Statement on COVID-19, 6 January 2022; SAGE 102. ↩
-
More information on generation times and serial intervals is available from Plus magazine: Why the generation time of COVID-19 is important (plus.maths.org) ↩
-
Estimation of the test to test distribution as a proxy for generation interval distribution for the Omicron variant in England, Abbott et al. 2021. ↩