Sector Skills Needs Assessment – Creative industries
Updated 6 October 2026

© Crown copyright 2026
This publication is licensed under the terms of the Open Government Licence v3.0 except where otherwise stated. To view this licence, visit nationalarchives.gov.uk/doc/open-government-licence/version/3 or write to the Information Policy Team, The National Archives, Kew, London TW9 4DU, or email: psi@nationalarchives.gov.uk.
Where we have identified any third party copyright information you will need to obtain permission from the copyright holders concerned.
This publication is available at https://www.gov.uk/government/publications/skills-england-annual-skills-report-and-sectoral-skills-needs-assessments-2026/sector-skills-needs-assessment-creative-industries
1. Handling notes
The Skills Needs Assessments (SNAs) use occupations, as defined by Standard Occupation Classification (SOC) codes, to provide an indication of the skills needs for the sectors. These allow for a consistent approach and cross-sector comparison. However, they are an approximation and do not work for all types of employment, particularly in highly specialised and emerging roles. As such, we have expanded our methods by using the newly developed UK Standard Skills Classification to identify the skill areas relevant for priority occupations. This is the first step for assessing the future demand for skills across key sectors in terms of both occupations and specific skills areas.
All estimates of future employment and skills are highly uncertain and their inclusion here is not for making precise forecasts of employment levels. Rather, the aim is to provide information about the general nature of changing employment patterns and their implications for skill requirements. The projections should be regarded as indicative of general trends and orders of magnitude, given the assumptions set out in section 5 below.
The data and methodology used to create the Skills Needs Assessments are set out in the accompanying tables and technical annex published alongside this report.
2. Executive summary
According to analysis by Skills England and the Department for Culture, Media and Sport, employment demand is set to rise sharply, with the 30 priority occupations within the creative industries projected to grow by 416,000 (27%) between 2025 and 2035. This is in addition to the estimated 493,000 workers expected to leave the workforce over that period that need to be replaced, bringing total demand to around 909,000 workers.
These roles typically require skills in creating, digital literacy, and learning and investigating, and the majority (81%) of projected additional employment in priority occupations requires workers with qualifications at level 4 and above. Half of all priority occupations in the creative industries also face demand from other priority sectors, particularly in digital roles, intensifying the difficulty to attract and retain people in these occupations. There is also a large amount of uncertainty about how AI adoption will influence the demand for roles in the future, particularly in digital roles which are projected to increase the most.
These priority occupations are already showing signs of high demand, with 59% of the occupations in critical or elevated demand across the UK economy in 2025, including 28% in critical demand.
Generative AI is rapidly transforming large sections of the creative industries. Many roles are shifting from ‘makers’ to ‘directors’ of AI outputs as professionals are now spending more time guiding tools, refining prompts, and maintaining originality.
Historically, the education pathways most important to the creative industries’ priority occupations are at level 6 and above, supported by apprenticeships at all levels and particularly in Digital Technology (practitioners). The level 6 and above routes are split between more digital routes in computing, and non-STEM subjects in media, journalism and communications; english studies; and creative arts and design (which also supplies a large proportion of graphic designers). Architecture is also an important route for its specific sub-sector. The historic data does not capture all training routes, and there are now over 70 apprenticeships standards aligned to a priority occupation and skills bootcamps that will also support these occupations.
Growth in training is most heavily concentrated in the digital pathways that feed into priority occupations, but growth is more modest for other creative industries pathways. Important training routes for priority roles have seen growth in achievements between 2021 to 2022 and 2023 to 2024 of at least 40% for digital and business management training. However, this growth has been much lower for other routes.
3. Workforce overview and demographics
The creative industries are a cornerstone of the UK’s economy and cultural identity. In 2024, they contributed over £146 billion to the economy, accounting for approximately 5.5% of the UK’s Gross Value Added (GVA). The creative industries employed 2.4 million people in 2024 (representing 7.1% of the national workforce), remaining stable from 2023 to 2024 but a considerable increase, of over 300,000 people (14.7%), from the pre-pandemic 2019 workforce. The creative industries encompass a wide range of industries, including advertising, architecture, crafts, design, film, music, video games, performing, and visual arts.
The Creative Industries Sector Plan sets out government’s ambitions for the creative industries, including intentions to increase business investment by the creative industries from £17 billion to £31 billion over the next 10 years.
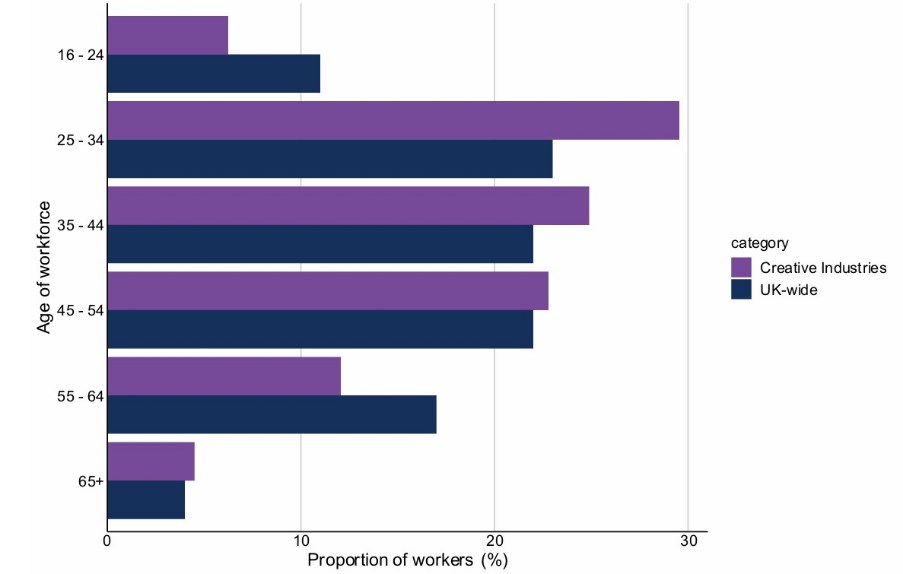
As shown in Figure 1, the creative industries has a young age profile, with the 25 to 34 age group being the largest in 2024 at 30%. This is well above the 2024 average across the UK of 23% for this age group (DCMS Sector Economic Estimates, 2026 for sector figures, APS 2024 data for UK average). However, under-25s make up a small share of total employment at only 6%. Within the creative industries, research from the Creative Industries Policy and Evidence Centre, finds that skills challenges are most acute at mid-career level. They find that, of the employers that report skills gaps, 37% of them identify that this affects staff 5 to 10 years into their career.
As shown in Figure 2, the workforce in the creative industries in 2024 is male dominated: 63% of the workforce is male, compared with 52% for across the UK.
Figure 1: Age distribution for the creative industries compared to UK-wide employment in 2024
Source: Economic Estimates: Employment January 2024 to December 2024 for DCMS Sectors, Annual Population Survey 2024 for UK average
Figure 2: Sex distribution for the creative industries compared to UK-wide employment in 2024

Source: Economic Estimates: Employment January 2024 to December 2024 for DCMS Sectors, Annual Population Survey 2024 for UK average
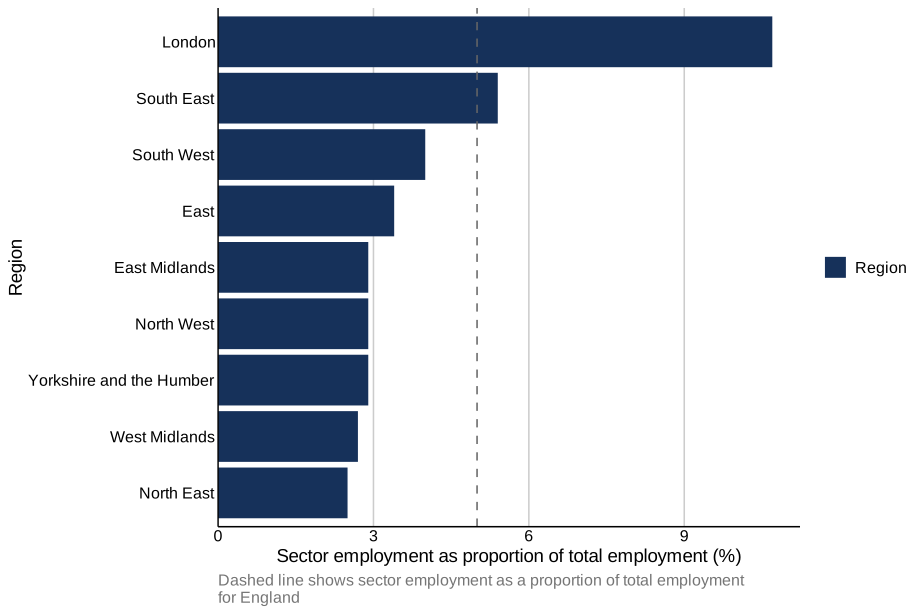
Regionally, as shown in Figure 3, London region is the largest centre of creative industries employment, with 10.7% of its workforce in creative industries roles. This is far higher than the region with the next largest proportion, the South East region (5.4%) and well above the England average. While the North East region (2.5%), West Midlands region (2.7%), and Yorkshire and the Humber region (2.9%) show far lower concentrations.
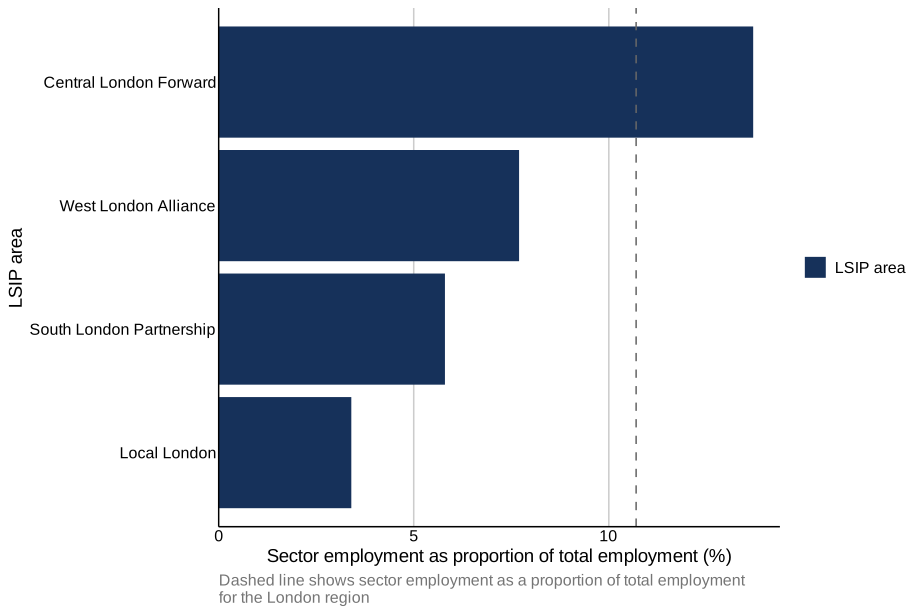
Based on BRES data, across the 4 Local Skills Improvement Plan (LSIP) areas covering London, as shown in Figure 4, concentrations vary substantially: Central London Forward LSIP geography (13.7%) is the UK’s core creative industries hub, followed by West London Alliance LSIP geography (7.7%) and South London Partnership LSIP geography (5.8%). Local London LSIP geography (3.4%) aligns more closely with national levels. BRES analyses comparisons are made using LSIP geographies as defined by the designated Employer Representative Body boundaries set out by Skills England, ensuring consistency with the official LSIP framework (Local skills improvement plans and designated employer representative bodies - GOV.UK)
Note: BRES primarily captures VAT- and PAYE-registered businesses and may therefore underrepresent sectors with high numbers of freelancers or micro-businesses, such as the creative industries. As a result, apparent regional concentrations may reflect the location of larger employers rather than the full distribution of sectoral employment.
Figure 3: Proportion of jobs in the creative industries, relative to total employment, for English regions, in 2024
Source: Business Register and Employment Survey (BRES) 2024
Figure 4: Proportion of jobs in the creative industries, relative to total employment, for London LSIP areas, in 2024
Source: Business Register and Employment Survey (BRES) 2024
4. Priority occupations and current demand
4.1 Priority occupations
Skills England has been working with the Department for Culture, Media and Sport (DCMS) to identify occupations of importance to the creative industries. The priority occupations selected for the Assessment of priority skills to 2030 have been retained, with additional occupations added based on the results of the Creative Industries Skills Audits.
There are 30 priority occupations for creative industries, 15 of which overlap with at least one other sector. There are 9 priority occupations which overlap with more than one sector, including: Programmers and software development professionals (overlapping with 7 sectors), IT business analysts, architects and systems designers (6), and financial managers and directors (4). This suggests there is cross-sector competition for the required skills within the workforce. The sectors that overlap the most with creative Industries in terms of priority occupations are: life sciences, digital and technologies, professional and business services, and financial services.
There are 15 creative industries priority occupations which do not overlap with the priority occupations selected for any other priority sectors, including:
- managers and directors in the creative industries
- graphic and multimedia designers
- archivists, conservators and curators
These occupations are unique to the sector.
Table 1: Creative industries priority occupations appearing in at least 2 other sectors
| Occupation | Number of sectors including creative industries |
|---|---|
| Programmers and software development professionals | 7 |
| IT business analysts, architects and systems designers | 6 |
| Financial managers and directors | 4 |
| IT managers | 4 |
| Marketing, sales and advertising directors | 3 |
| Information technology directors | 3 |
| Architects | 3 |
| CAD, drawing and architectural technicians | 3 |
| IT user support technicians | 3 |
Of the priority occupations identified for creative industries, 28% are in critical demand (substantially higher demand than usual) and 59% are either in critical demand or elevated demand (above average). This is based on Skills England’s Occupations in demand analysis, published in 2025. This illustrates a high level of current demand for the priority occupations identified by the creative industries.
4.2 Demand for skills
The UK’s first Standard Skills Classification (SSC) provides a mapping of relevant skill areas to occupations. Using an initial prototype of the SSC, experimental analysis was conducted to identify the skill areas which are relevant to priority occupations. Across the priority occupations in the creative industries, the top three technical skill areas are:
- developing and deploying applications
- developing and implementing marketing strategies
- installing, integrating, securing and maintaining digital technology systems
These top technical skills areas align with the findings of the Creative Industries Skills Audits, published by the Creative Policy and Evidence Centre and Work Advance (page 62). When asked about which IT skills employers expected staff to acquire over the next 3 to 5 years, 24% of employers with upskilling needs anticipated their staff needing to upskill in working with specialist software, hardware or systems and 5% anticipated upskilling needs in app programming/development.
Core Skills
The SSC also sets out 13 ‘Core Skills’, which are fundamental abilities that contribute to the capability to carry out the tasks associated with a specific job, such as numeracy, reading, and writing. They are often transferable, meaning they can be applied across different sectors of activity and roles. The SSC provides proficiency scores for core skills by occupation, on a 1 to 5 scale from minimal proficiency to expert proficiency.
The 13 Core Skills defined in the UK Standard Skills Classification (SSC) are listed below. These are foundational, transferable abilities required across occupations, and they are listed explicitly in the SSC Core Skills Explorer;
- planning and organising – setting goals, prioritising tasks, structuring approaches
- adapting – adjusting strategies or behaviour to new or changing situations
- working with others – collaborating effectively with teams or groups
- listening – understanding spoken communication, including non-verbal cues
- speaking – communicating clearly and confidently through speech
- leadership – motivating, guiding, and inspiring others
- learning and investigating – searching for, gathering, and understanding new information
- creating – developing original ideas, innovations, or solutions
- problem-solving and decision-making – identifying issues, analysing information, selecting solutions
- numeracy – applying mathematical techniques and interpreting numerical data
- digital literacy – using digital tools and technologies effectively (including AI)
- reading – interpreting written information accurately
- writing – communicating ideas clearly and persuasively in written form
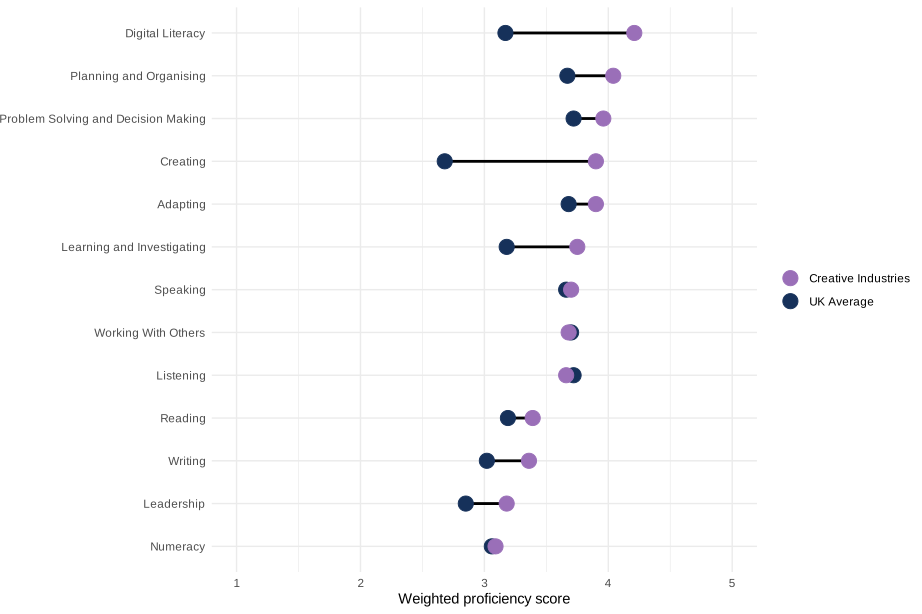
The required proficiency in core skills for creative industries’ priority occupations has been compared to the UK average. Where core skills have a higher required proficiency in priority occupations, this suggests that these skills are particularly important for these occupations. The graph below shows which core skills are important for the creative industries compared to the wider UK.
Creative industries requires notably higher proficiency in the core skills: * creating (3.9 versus 2.7) * digital literacy (4.2 versus 3.2) * learning and investigating (3.8 versus 3.2).
This aligns with the findings of the Creative Industries Skills Audits, which highlights the distinct mixture of skills (across technical, digital, core and business critical skills) that are important to the sector. In 2025, one third (32%) of creative industries employers that had recruited in the past 2 years reported difficulties filling vacancies, and most commonly this was due to candidates lacking this vital mix of skills, rather than specific qualifications.
Figure 5: Core skills proficiency for the creative industries compared to the UK
Source: Skills England analysis using the UK Standard Skills Classification
5. Future demand for priority occupations
Employment demand is set to rise sharply for priority occupations within the creative industries. They are projected to grow by 416,000 (27%) between 2025 and 2035.
5.1 Top occupations by employment growth to 2035
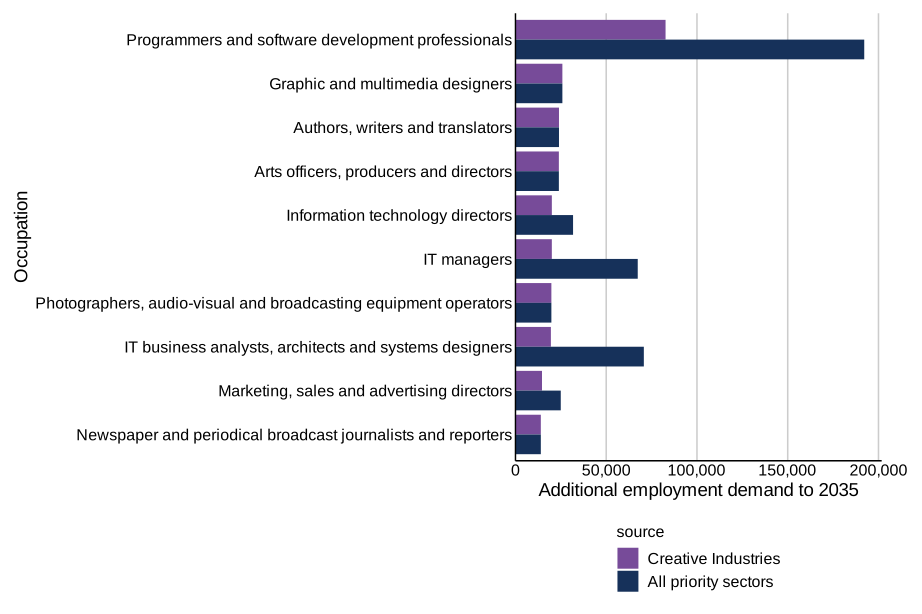
As seen in Figure 6, the occupation with the highest projected employment demand is Programmers and software development professionals, with 82,700 additional workers needed in creative industries between 2025 and 2035. This occupation is also highly demanded in other priority sectors. The total projected employment demand for Programmers and software development professionals across all priority sectors, including creative industries, is 192,200 workers.
Projected employment demand has been estimated by DCMS by extrapolating forwards the relationship between investment and Gross Value Added (GVA) in order to forecast future GVA, taking into account the target to increase investment to £31bn by 2035 (as set out in the Creative Industries Sector Plan). This is then used to predict employment up to 2035.
Figure 6: Top 10 priority occupations in the creative industries by additional employment to 2035
Source: Skills England planning scenarios based on sector-level projections
5.2 Expected qualification levels
The majority (81%) of projected additional employment in the creative industries’ priority occupations requires workers with qualifications at level 4 and above. As shown in Table 2, this is far higher than across all priority occupations for the 10 priority sectors, where 62% of projected additional employment in priority occupations requires workers qualified at level 4 and above.
Table 2: Expected qualification level of workers needed to meet demand to 2035 in priority occupations
| Priority occupations | Level 2 or 3 | Level 4 or above |
|---|---|---|
| Creative industries priority occupations | 19% | 81% |
| All priority occupations | 38% | 62% |
Source: Skills England planning scenarios based on sector-level projections
5.3 Alternative scenarios
Any future projection of how the economy will evolve is inherently uncertain. This uncertainty increases the further forward the projection extends. To improve the understanding of the uncertainty in the skills assessment projections, Skills England asked the sponsoring department to provide an alternative scenario. The total job growth in the alternative scenario is shown in Table 3 below. This alternative scenario differs to the main scenario in that it makes a more ambitious assumption about the amount of additional investment realised in the creative industries through to 2035.
In the high scenario, growth in priority occupations is higher by 397,100 workers when compared to the main scenario (813,400 and 416,300, respectively). The growth rate in the high scenario is 51%, which is 24 percentage points higher than the main scenario (27%).
Table 3: Main and high demand scenarios for creative industries
| Scenario | Increase in employment demand from 2025 to 2035 | Percentage change in employment demand from 2025 to 2035 |
|---|---|---|
| Main | 416,300 | 27% |
| High | 813,400 | 51% |
Note: Numbers rounded to nearest 100
Source: Skills England planning scenarios based on sector-level projections from the Department for Culture, Media and Sport
The uncertainty in many of the projections is much greater currently due to the accelerated adoption of AI technology. Such technology will increase the productivity of many jobs and possibly reduce the demand for new workers in affected occupations. The speed of these changes will be uneven across the economy and very uncertain.
The uncertainty driven by AI has been a particular issue for the assessment of the creative industries, not least as digital occupations have seen some of the highest projected growth rates and these occupations are seeing some of the greatest AI-related changes. For the purposes of this assessment, we have not adjusted the projections provided by sector experts to take account of AI adoption as the evidence for these changes is not currently strong. Furthermore, the growth in digital occupations is as much to do with the broad digitalisation of many sectors which is well established, as opposed to just a narrow growth in demand. However, it needs to be recognised that there is a heightened risk that projections of AI-exposed occupations including digital occupations are too high. Skills England intends to conduct some further work over the next year to understand the risks more fully.
5.4 Replacement demand
In addition to expansion demand, where we consider the additional workers needed due to expected future sector growth, there is also demand for workers required to replace existing workers in the labour market. This is known as replacement demand. This is a broad estimate, based on applying rates from economy wide projections onto the employment estimates of priority occupations within the sector.
Our analysis focusses on expansion demand and assumes current supply is sufficient to maintain the existing size of the workforce. In practice, this will not be the case for some occupations.
Each year we estimate an average of 49,300 workers needing to be replaced within priority occupations in creative industries. Over the 10-year period of 2026 to 2035, the total estimated replacement demand is 493,000 workers.
This increases the total demand for workers. When combining this with total additional employment demand to 2035 (416,000), the total demand for workers in creative industries is 909,000.
6. Influence of AI on the creative industries
Generative AI is rapidly transforming creative industries, powering tools like Adobe and Canva to streamline concepting, visualisation, editing and planning (Upcoming publication: ‘What Works for AI Upskilling in the UK, 2026’ and ‘Deep Dives with stakeholders, 2026’, and BFI, 2025).
Uptake is swift in film, music, games and advertising, but slower in heritage, theatre and smaller arts groups due to funding and ethical concerns. AI also revolutionises distribution through audience analytics and recommendations. Its silent integration via software updates highlights the urgent need for robust governance and skills. Key challenges such as copyright and protecting creators’ rights are central to AI adoption in the sector. (Upcoming publication: ‘What Works for AI Upskilling in the UK, 2026’ and ‘Deep Dives with stakeholders, 2026’).
Creative industries roles are shifting from ‘makers’ to ‘directors’ of AI outputs, as professionals are now spending more time guiding tools, refining prompts, and maintaining originality. As agentic systems automate production and scheduling, productivity rises but entry-level roles are threatened, with fewer freelance writing and image jobs available (‘CESifo Working Paper no. 11276, 2024’, and ‘Creative Industries and GenAI, 2025’).
Skills England commissioned Dr Nisreen Ameen to develop an AI Skills tools package. As part of this, evidence from deep-dive workshops with sector leads and Skills England’s research and analysis report on AI skills for the UK workforce shows that there are several areas of skills demand that are particularly impacted by AI:
- generative AI is now integrated into mainstream creative tools, transforming workflows
- intellectual property and legal considerations are now daily tasks
- AI drives interactive, immersive and personalised content, and powers audience analytics
- new roles and skills are emerging, including AI workflow designers and data stewards
- AI widens inequalities in access, especially for freelancers, and can reinforce biases against non-mainstream creators
- there is growing pressure to prove the value of human creativity alongside AI
In addition, according to the Creative Industries Policy and Evidence Centre, almost 60,000 creative workers lack full proficiency in their roles.
Dr Ameen’s research also shows that shows that AI skills in demand can be mapped to three broad domains:
Technical skills
- developing AI tools for creative processes
- crafting/testing impactful prompts
- integrating AI to enhance workflows
- using low-code or automation to boost productivity
- assessing when and how to apply AI in workflows
Non-technical skills
- interpreting AI outputs for informed decision-making
- collaborating with technologists to embed artistic intent
- shaping AI outputs to ensure originality
- clearly communicating AI’s value
- fostering creative–technical collaboration
- integrating sustainability into AI practices
Responsible and ethical skills
- copyright, consent, and attribution
- dataset traceability and transparency
- addressing bias
- upholding data protection and fairness
- assessing data-driven insights in AI outputs and assess system reliability
7. Education supply
As part of this assessment, we have considered the supply of workers in priority occupations relevant to the creative industries. Employment in the creative industries is influenced by a range of joiners (inflows) and leavers (outflows), as illustrated in Figure 7. This analysis focuses on one component of supply: inflows from education.
Education inflows capture individuals who move from education into employment in priority occupations. This group is predominantly made up of career starters, while also including a smaller number of job switchers and individuals returning to work. Taken together, these flows provide a robust and consistent indicator of the pipeline of new talent entering priority occupations and form a reliable basis for understanding the contribution of the education system to workforce supply.
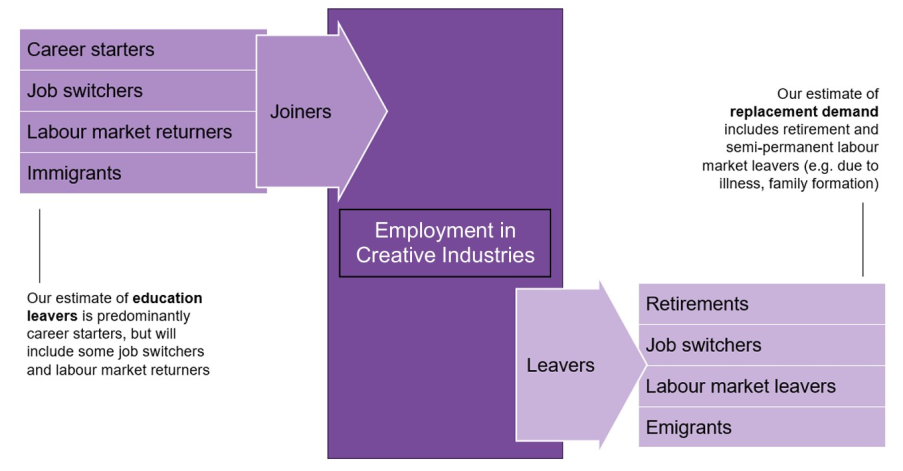
Figure 7 is a stock and flow diagram showing how people join the creative industries sector, listed as career starters, job switchers, returners, immigrants. It then shows what makes them leave: retirements, job switchers, labour market leavers, emigrants. For joiners, the diagram states that Skills England’s estimate of education leavers is predominantly career starters, but will include some job switchers and labour market returners. For leavers, the diagram outlines that Skills England’s estimate of replacement demand includes retirement and semi-permanent labour market leavers (for example, due to illness, family formation).
7.1 Important training routes
There are multiple routes by which people enter employment in a given occupation. Using information on historic pathways into these occupations and the Skills England Occupational Maps, we have identified the most prominent routes that provide direct supply into priority occupations identified for the creative industries sector. The routes relate to entry into the identified priority occupations but, as these occupations can span multiple sectors beyond creative industries. This analysis is not strictly specific to employment in the creative industries sector. These routes are summarised in Table 4.
Training routes are listed below by the proportion of education leavers in employment that enter a priority occupation listed by DCMS. The volume of education leavers is also listed for a particular route.
Key training routes broadly split into 3 types of courses:
- well-aligned routes, often technical in nature, where a high proportion of leavers progress into priority occupations, but sometimes with small cohorts
- balanced routes, where a reasonable proportion of leavers progress into priority occupations from a larger cohort
- high-volume routes, where a smaller proportion of leavers progress to priority occupations but contribute a large share of employment
Not all 3 course types are present in all sectors. For well-aligned routes, increasing the supply into priority occupations will likely require an increase in enrolments. Whereas for other routes that are less well-aligned, increasing the progression rates into priority occupations may be more effective.
Table 4: Key routes related to priority occupations for the creative industries sector
| Pathway | Subject area | Level group | Number of education leavers entering priority occupations | Percentage of employed education leavers entering priority occupations |
|---|---|---|---|---|
| Higher Education | Computing | Level 6+ | 6,040 | 49% |
| Apprenticeship | Digital technology (practitioners) | Level 2/3 | 1,580 | 40% |
| Apprenticeship | Digital technology (practitioners) | Level 4/5 | 680 | 38% |
| Apprenticeship | Digital technology (practitioners) | Level 6+ | 400 | 38% |
| Higher Education | Media, journalism and communications | Level 6+ | 2,170 | 38% |
| Higher Education | Creative arts and design | Level 6+ | 4,890 | 30% |
| Higher Education | Architecture, building and planning | Level 6+ | 2,060 | 30% |
| Higher Education | English studies | Level 6+ | 1,460 | 22% |
| Higher Education | Business and management | Level 6+ | 7,640 | 20% |
Source: Skills England estimates based on employment in 2022 to 2023 tax year
Note: The routes relate to entry into the priority occupations identified by DCMS but, as these occupations can span multiple sectors beyond creative industries, this analysis is not strictly specific to employment in the creative industries sector.
The 9 routes outlined in Table 4 account for 56% of education leavers entering priority occupations relevant to the creative industries. As 6 of the 7 routes are level 6+ higher education courses, this suggests that higher education is a key pathway into creative Industries priority occupations. However, the important routes cover a range of subjects, reflecting the varied skills needs of the sector. The creative industries’ digital skills needs are reflected in the rates of education leavers entering priority occupations. These are highest for computing and digital subjects.
Some newer training routes are not included in the historic data, including newer apprenticeship standards and Skills Bootcamps. Overall, based on the Skills England Occupational Maps, there are 71 apprenticeship standards linked to priority occupations in the creative industries. In the 2024 to 2025 data, the majority of achievements on live standards were in digital technology (practitioners) (62%), followed by marketing and sales (17%), and media and communication (10%). These additional subject areas have not been included as historically they have low proportions of education leavers progressing to priority occupations. However, there may be some newer standards that have a closer link to employment in the creative industries. In future, Skills England will analyse the destinations of leavers from these standards.
7.2 Trends in training routes
We can get a sense of how supply into priority occupations is changing by looking at the number of learners successfully completing a course that is aligned with these occupations. Where achievements have grown, this could suggest that these courses will continue to be key pathways into priority occupations in the creative industries. Table 5 gives an overview of the change in achievement figures for the key routes over the 2 years between 2021 to 2022 and 2023 to 2024.
Table 5: Growth in achievements for key routes related to priority occupations for the creative industries sector
| Pathway | Subject area | Level group | Achievements in 2023 to 2024 | Growth in achievements since 2021 to 2022 |
|---|---|---|---|---|
| Apprenticeship | Digital technology (practitioners) | Level 4/5 | 4,190 | +82% |
| Apprenticeship | Digital technology (practitioners) | Level 2/3 | 6,960 | +49% |
| Apprenticeship | Digital technology (practitioners) | Level 6+ | 1,840 | +46% |
| Higher Education | Business and management | Level 6+ | 187,750 | +41% |
| Higher Education | Computing | Level 6+ | 50,280 | +40% |
| Higher Education | Architecture, building and planning | Level 6+ | 17,590 | +8% |
| Higher Education | Creative arts and design | Level 6+ | 37,500 | +6% |
| Higher Education | Media, journalism and communications | Level 6+ | 16,020 | +5% |
| Higher Education | English studies | Level 6+ | 14,740 | +0% |
Source: Figures provided by the Department for Education
There were also 520 learners that achieved creative and design skills bootcamps in 2023 to 2024, a large increase from 160 in 2022 to 2023.
The route which has grown at the fastest rate in terms of achievement numbers is the Digital Technology Level 4/5 apprenticeship, which grew by 82% in the number of achievements over the 2-year period. This reflects the introduction of new level 4/5 digital technology apprenticeships. This course has a high rate of entrants into priority occupations, suggesting that this course will continue to be a key pathway into priority occupations for the creative industries sector. Level 6+ higher education business and management and computing routes also grew by a large amount, at 41% and 40% respectively. However, for business and management, the rate of entrants into priority occupations for the creative industries is relatively low compared with the other key training routes. As such, growth in this course is less likely to translate to a large influx of entrants in the creative industries.