Sector Skills Needs Assessment – Construction
Updated 6 October 2026

© Crown copyright 2026
This publication is licensed under the terms of the Open Government Licence v3.0 except where otherwise stated. To view this licence, visit nationalarchives.gov.uk/doc/open-government-licence/version/3 or write to the Information Policy Team, The National Archives, Kew, London TW9 4DU, or email: psi@nationalarchives.gov.uk.
Where we have identified any third party copyright information you will need to obtain permission from the copyright holders concerned.
This publication is available at https://www.gov.uk/government/publications/skills-england-annual-skills-report-and-sectoral-skills-needs-assessments-2026/sector-skills-needs-assessment-construction
1. Handling notes
The SNAs use occupations, as defined by Standard Occupation Classification (SOC) codes, to provide an indication of the skills needs for the sectors. These allow for a consistent approach and cross-sector comparison. However, they are an approximation and do not work for all types of employment, particularly in highly specialised and emerging roles, such as in the retrofit sector. To supplement information on jobs by SOC, we have expanded our methods by using the newly developed UK Standard Skills Classification to identify the skill areas relevant for priority occupations.
This is the first step for assessing the future demand for skills across key sectors in terms of both occupations and specific skills areas. All estimates of future employment and skills are highly uncertain and their inclusion here is not for making precise forecasts of employment levels. Rather, the aim is to provide information about the general nature of changing employment patterns and their implications for skill requirements. The projections should be regarded as indicative of general trends and orders of magnitude, given the assumptions set out in section 5 below.
Job projections to support energy efficiency and clean heating policies have not been included in this assessment but have been captured in the Clean Energy Skills Needs Assessment. However, there is likely to be crossover between roles in the clean energy and construction sectors. Further details of projected employment in the repairs, maintenance and improvements sector can be found in the Warm Homes Plan.
The data and methodology used to create the Skills Needs Assessments are set out in the accompanying tables and technical annex published alongside this report.
2. Executive summary
In the construction sector as a whole, Department for Business and Trade (DBT) analysis suggests a large shortfall of construction labour by 2030. Skills England builds on this to consider supply and demand components in more detail, for specific priority occupations in the sectors. The key findings of Skills England’s analysis are set out below.
Employment demand is set to rise sharply in the construction sector to meet government commitments, including delivering 1.5m homes in England over this Parliament, with the 30 priority occupations projected to grow by 493,000 (26%) between 2025 and 2035. This is the largest projected increase in workers across all priority sectors – driven by government targets. This is in addition to the estimated 595,000 workers expected to leave these priority occupations over this period that need to be replaced, bringing total demand to around 1m.
These roles typically require skills in problem solving and decision making, creating, and numeracy, and the majority (59%) of projected additional employment requires workers with level 2 or 3 qualifications. More than half of these occupations (19 out of 30) also face demand from other priority sectors, particularly in engineering roles, intensifying the difficulty to attract and retain people in these occupations. construction priority occupations are already showing signs of high demand, with 40% of the occupations in critical or elevated demand across the whole economy.
Historically, the education pathways most important to the priority occupations are generally at level 2/3, with the exception of architecture, building and planning higher education courses at level 6+. The key pathways at level 2/3 are supported by apprenticeships, particularly in the subject areas of building and construction, and engineering. Overall, a range of provision types appear to be important for the sector, but apprenticeships strongly dominate.
Historic data does not capture all training routes, and there are now over 100 apprenticeships standards aligned to a priority occupation, and skills bootcamps that will also support these occupations.
The growth in training is most heavily concentrated in building and construction, and Engineering pathways, helping to support the projected demand in these roles. These important training routes have seen growth in achievements between 2021 to 2022 and 2023 to 2024 of 60% and 29% respectively. There is a far lower growth of less than 10% for other routes.
3. Workforce overview and demographics
In 2025, it is estimated construction employed 2.8 million people across the UK. The construction sector is a foundational sector, integral to delivering the government’s built environment and infrastructure ambitions, including delivering the green projects needed to meet our net zero target by 2050. It is a key part of the economy, contributing over £150 billion to the UK economy in GVA in 2025. The government has announced £625 million of investment to train up to 60,000 more skilled construction workers by 2029, to help meet the government’s housebuilding, retrofit and infrastructure commitment, including building 1.5 million new homes in England over this Parliament.
The repairs, maintenance and improvement (RMI) sector is a sub-sector of the construction sector. Job projections to support energy efficiency and clean heating policies have not been included in this assessment but have been captured in the Clean Energy Skills Needs Assessment. However, there is likely to be crossover between construction and Clean Energy sectors for RMI roles. Further details of projected employment in this sector can be found in the Warm Homes Plan.
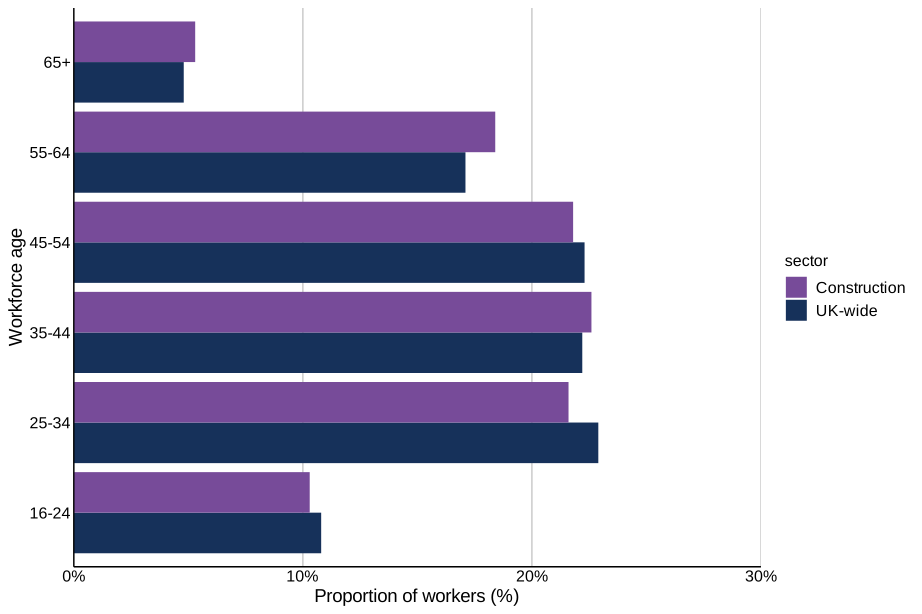
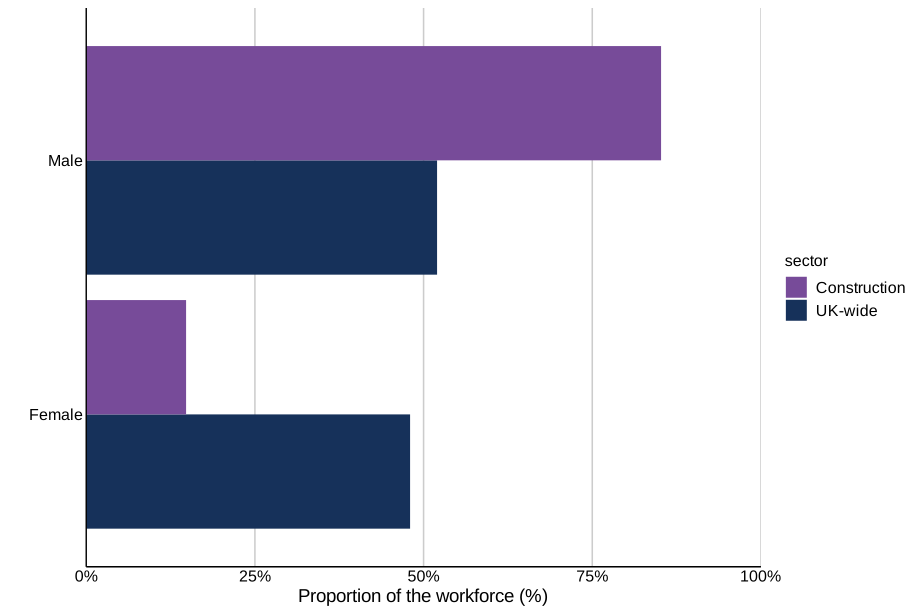
The demographics of the construction sector display clear similarities and differences to that of UK-wide employment. As shown in Figure 1, the age profile of the workforce broadly mirrors that of the UK workforce. The largest age group in construction is 35-44 (22.6%), which is a very similar proportion to the UK average (22.2%). However, as shown in Figure 2, the workforce is highly male-dominated, at 85% male. This is considerably higher than across UK-wide employment, where 52% of the workforce is male.
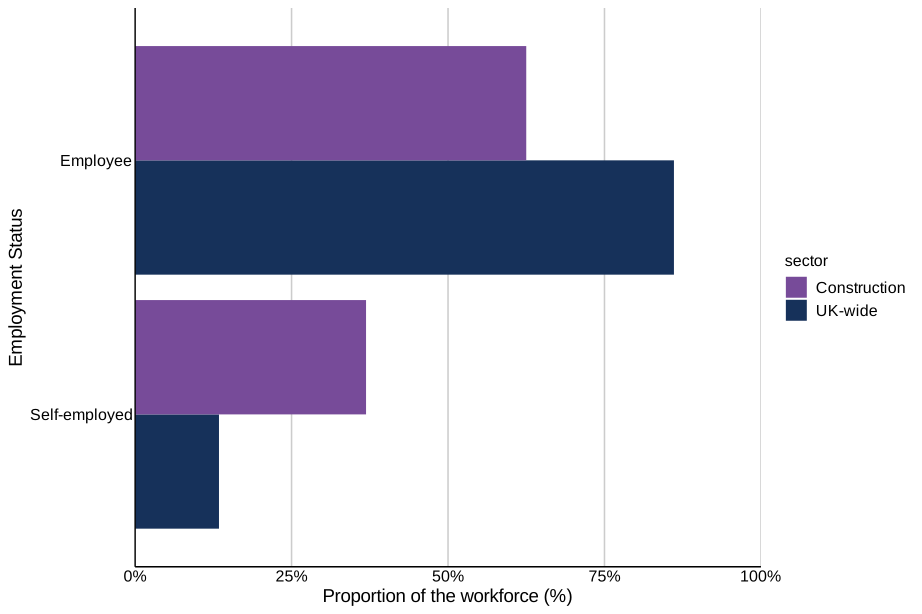
Figure 3 shows the employment status for the construction workforce, which is characterised by a relatively higher proportion of workers who are self-employed (rather than being employees) compared to UK-wide employment.
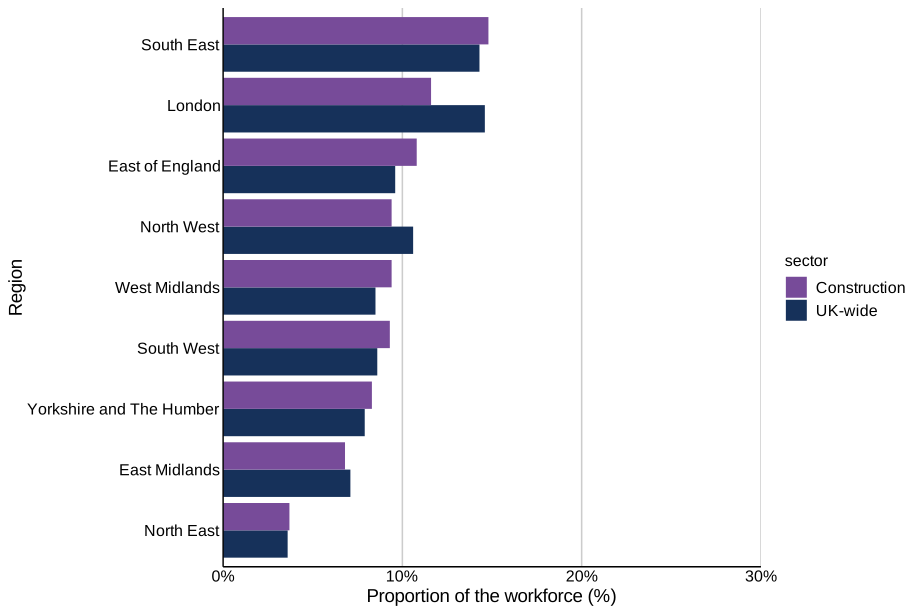
Regionally, the spread of the construction workforce broadly mirrors the spread of UK-wide employment. This is shown in Figure 4. The construction workforce is most concentrated in the South East of England (14.8% of workers). However, this is very similar to the UK average (14.3%). London records a smaller proportion of construction workers, even though overall volumes of workers remain high, with Central London recording the largest number of construction workers (see below).
Figure 1: Age distribution for construction compared to UK-wide employment in 2025
Source: Annual Population Survey 2025
Figure 2: Sex distribution for construction compared to UK-wide employment in 2025
Source: Annual Population Survey 2025
Figure 3: Employment status distribution for construction compared to UK-wide employment in 2025
Source: Annual Population Survey 2025
Figure 4: Regional distribution for construction compared to UK-wide employment in 2025
Source: Annual Population Survey 2025
Local Skills Improvement Plan areas cover 39 areas across England, including 4 distinct areas covering London. Using the Business Register and Employment Survey, employment volumes are highest in large urban and growth areas, with Central London Forward LSIP geography recording the largest construction workforce (approximately 81,000 jobs), while smaller or more rural areas such as Worcestershire LSIP geography employ around 12,000 people in construction. Some LSIP geographies show a much stronger reliance on construction as a share of total employment. For example, the Greater Essex and Kent and Medway LSIP geographies each record around 8% of their workforce in construction, indicating a comparatively high concentration of sector activity relative to their overall labour markets.
Concentrations also vary substantially within LSIP geographies themselves. In the Greater Essex LSIP geography, construction accounts for around 16% of total employment in Epping Forest, reflecting a strong local dependency on the sector, compared with just 5% in the Southend-on-Sea LSIP geography. Over time, construction employment has shown modest national growth but uneven local trajectories. Between 2021 and 2024, construction employment increased by around 79,000 overall, with employment rising in 28 LSIP geographies and falling in 13. Growth was strongest in places such as the York and North Yorkshire LSIP geographies, which saw a 31% increase, while the sharpest decline occurred in the Cumbria LSIP geography (-10%). Relative concentration changes further highlight divergence in local importance, with construction strengthening its role most in areas such as Hull and East Yorkshire LSIP geographies but weakening in the Cheshire and Warrington and Cumbria LSIP geographies.
Note: BRES primarily captures VAT- and PAYE-registered businesses and may therefore underrepresent sectors with high numbers of freelancers or micro-businesses. As a result, apparent regional concentrations may reflect the location of larger employers rather than the full distribution of sectoral employment.
4. Priority occupations and current demand
4.1 Priority occupations
Skills England has been working with the Department for Business and Trade (DBT) and Ministry of Housing, Communities & Local Government (MHCLG) to identify occupations of importance to the construction sector. The priority occupations for construction have been identified based on DBT modelling calculations of the workforce shortage by occupation, with specific additional housebuilding occupations added due to their importance for the government’s housebuilding target. This differs to the definition used to identify priority occupations in Housebuilding in the Assessment of Priority Skills to 2030, published in 2025. Further information can be found in the accompanying Skills Needs Assessments technical annex publication.
There are 30 priority occupations for construction, 19 of which overlap with at least one other sector. There are 5 occupations which overlap with more than one other sector, including engineering professionals not elsewhere classified (n.e.c.) which was selected as a priority by 5 sectors including construction, civil engineers (selected by 4 sectors), and Architects (selected by 3 sectors). Whereas, there are 11 construction priority occupations which were only selected by this sector, including conservation professionals, environment professionals, and chartered surveyors.
In terms of priority occupations, construction overlaps the most with clean energy, which shares 17 priority occupations.
Table 1: Construction priority occupations appearing in at least two other sectors besides construction
| Occupation | Number of sectors including construction |
|---|---|
| Engineering professionals n.e.c. | 5 |
| Civil engineers | 4 |
| Architects | 3 |
| CAD, drawing and architectural technicians | 3 |
| Metal working production and maintenance fitters | 3 |
Note: Priority occupations for the construction sector were selected due to their importance and considerable expected growth. Some occupations are not included in the analysis due to their limited expected growth but have been identified by the Ministry of Housing, Communities and Local Government as important in supporting housebuilding. These occupations are as follows:
SOC description
- estate agents and auctioneers
- skilled metal, electrical and electronic trades supervisors
- stonemasons and related trades
- crane drivers
- steel erectors
- pipe fitters
- building and civil engineering technicians
Note: Priority occupations for the construction sector were selected because of their importance and their considerable expected growth. Some occupations are not included in the analysis due to their limited expected growth but have been identified by DESNZ as supporting repair, maintenance and improvement (RMI). These occupations are as follows:
SOC description
- estimators, valuers and assessors
- building and civil engineering technicians
Of the priority occupations in construction, 20% are in critical demand (substantially higher demand than usual) and 40% of priority occupations are either in critical demand or elevated demand (above average). This is based on Skills England’s occupations in demand analysis, published in 2025. This illustrates a high level of current demand experienced in the priority occupations identified by the sector.
4.2 Demand for skills
The UK’s first Standard Skills Classification (SSC) provides a mapping of relevant skill areas to occupations. Using an initial prototype of the SSC, experimental analysis was conducted to identify the skill areas which are relevant to priority occupations. Across the priority occupations in the construction sector, the top 3 technical skill areas are:
- installing building interior systems and equipment
- building external structures and surfaces
- inspecting and testing structures and equipment
Core Skills
The SSC also sets out 13 ‘Core Skills’, which are fundamental abilities that contribute to the capability to carry out the tasks associated with a specific job, such as numeracy, reading, and writing. They are often transferable, meaning they can be applied across different sectors of activity and roles. The SSC provides proficiency scores for core skills by occupation, on a 1 to 5 scale from minimal proficiency to expert proficiency.
The 13 Core Skills defined in the UK Standard Skills Classification (SSC) are listed below. These are foundational, transferable abilities required across occupations, and they are listed explicitly in the SSC Core Skills Explorer.
- planning and organising – setting goals, prioritising tasks, structuring approaches
- adapting – adjusting strategies or behaviour to new or changing situations
- working with others – collaborating effectively with teams or groups
- listening – understanding spoken communication, including non-verbal cues
- speaking – communicating clearly and confidently through speech
- leadership – motivating, guiding, and inspiring others
- learning and investigating – searching for, gathering, and understanding new information
- creating – developing original ideas, innovations, or solutions
- problem-solving and decision-making – identifying issues, analysing information selecting solutions
- numeracy – applying mathematical techniques and interpreting numerical data
- digital literacy – using digital tools and technologies effectively (including AI)
- reading – interpreting written information accurately
- writing – communicating ideas clearly and persuasively in written form
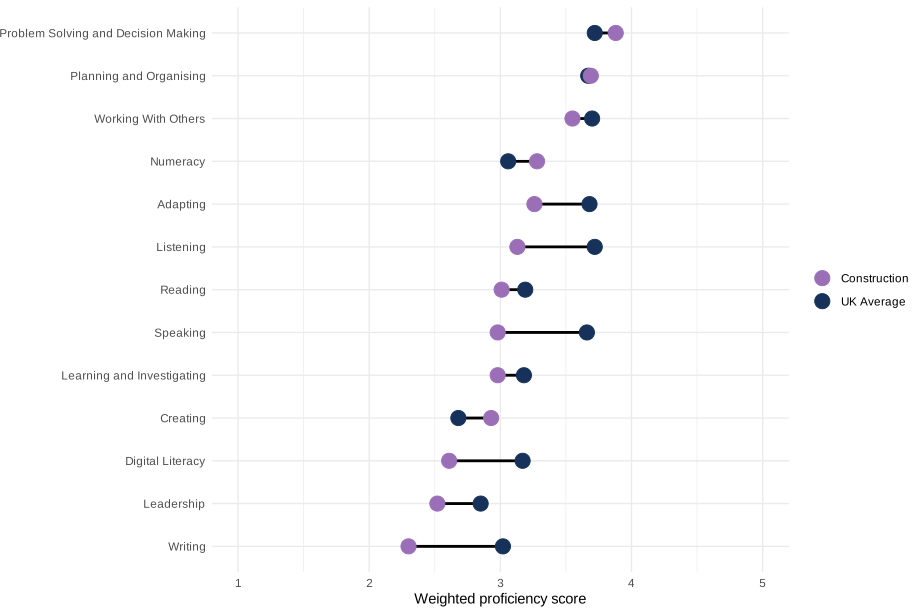
The required proficiency in core skills for the priority occupations have been compared to the UK average. Where core skills have a higher required proficiency in priority occupations, this suggests that these skills are particularly important for these occupations. The graph below shows which core skills are important for the construction sector compared to the wider UK.
Construction requires higher proficiency in the core skills: Problem Solving and Decision Making (3.9 versus 3.7 for the UK), Creating (2.9 versus 2.7 for the UK), and Numeracy (3.3 versus 3.1 for the UK).
In addition to the core skills identified by the SSC, there are several foundational, basic skills that can be used in different settings and sectors. These include welding, electrical and electronics skills. The mix of these skills, alongside the core skills identified by the SSC, is especially important when recruiting to the sector.
Figure 5: Core skills proficiency for the construction sector compared to the UK
Source: Skills England analysis using the UK Standard Skills Classification
5. Future demand for priority occupations
Employment in priority occupations within construction, to deliver government housing and infrastructure commitments, is projected to grow by 493,000 (26%) between 2025 and 2035. These estimates are derived from wider workforce modelling from the Department for Business and Trade (DBT) of the demand and supply for the whole construction workforce, which aims to quantify the potential size of the labour shortage by occupation in future years under different scenarios. It should be noted that these estimates are contingent on achieving the government’s commitments in housing, retrofit and infrastructure (including delivering 1.5 million new homes in England over this parliament). This is also highly dependent on the level of finance, planning, materials in industry and the time lag it takes for the workforce to reach the required level of competence.
The technical annex of this report provides further detail on the results and methodology for DBT’s wider workforce modelling for the construction sector.
5.1 Top occupations by employment growth to 2035
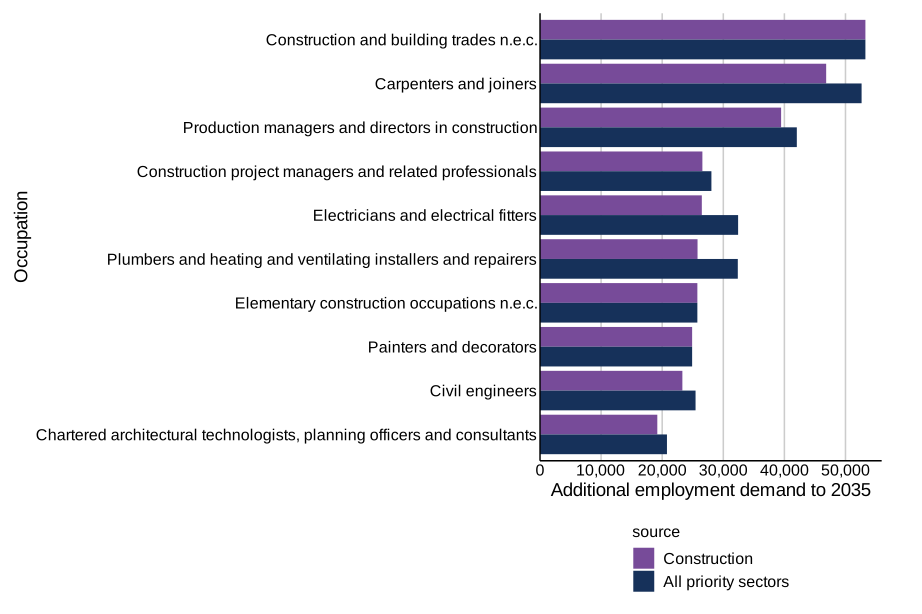
As seen in Figure 6, the occupation with the highest projected employment demand is construction and building trades not elsewhere classified (n.e.c.), with 53,300 additional workers needed between 2025 and 2035.
Job holders in this occupation undertake a variety of tasks in the construction, alteration, maintenance and repair of buildings, steeples, industrial chimneys and other tall structures, and of underwater structures not elsewhere classified. (Standard occupational classification 2020 Volume 1: structure and description of unit groups, ONS, 2025, p. 264).
This occupation does not overlap with the priority occupations selected for any other priority sectors. The additional employment projections have been estimated by DBT based on their construction workforce analysis, apportioned to occupations (see details in the technical annex).
Figure 6: Top 10 priority occupations in the construction sector by additional employment to 2035
Source: Sector projections provided by the Department for Business and Trade
5.2 Expected qualification levels
Considering the expected qualification levels of priority occupations, the majority (59%) of projected additional employment requires workers with level 2 or 3 qualifications, a higher proportion than across all priority occupations in all priority sectors, where it is 38% at level 2 or 3.
This is the current view of qualification level across priority occupations. Future demand in skills, qualifications and competence may change, particularly as the sector continues to respond to the Building Safety Act 2022.
Table 2: Expected qualification level of workers needed to meet demand to 2035 in priority occupations
| Priority Occupations | Level 2 or 3 | Level 4 or above |
|---|---|---|
| Construction priority occupations | 59% | 41% |
| All priority occupations | 38% | 62% |
Source: Skills England planning scenarios based on sector-level projections.
5.3 Alternative scenarios
Any future projection of how the economy will evolve is inherently uncertain. This uncertainty increases the further forward the projection extends. To improve the understanding of the uncertainty in the skills assessment projections, the Department for Business and Trade have provided a total of 4 demand scenarios based on different assumptions. These can be found in the technical annex below.
5.4 Replacement demand
In addition to expansion demand, where we consider the additional workers needed due to expected future sector growth, there is also demand for workers required to replace existing workers in the labour market. This is known as replacement demand. This is a broad estimate, based on applying rates from economy wide projections.
Our analysis focusses on expansion demand and assumes current supply is sufficient to maintain the existing size of the workforce. In practice, this will not be the case for some occupations.
Each year we estimate an average of 59,500 workers needing to be replaced within priority occupations in construction. Over the 10-year period of 2026 to 2035, the total estimated replacement demand is 595,000 workers.
This increases the total demand for workers. When combining this with total additional employment demand to 2035 (493,000), the total demand for workers in construction is 1,088,000.
6. Education supply
As part of this assessment, we have considered the supply of workers in priority occupations relevant to the construction sector. Employment in the sector is influenced by a range of joiners (inflows) and leavers (outflows), as illustrated in Figure 7. This analysis focuses on one component of supply: inflows from education.
Education inflows capture individuals who move from education into employment in priority occupations. This group is predominantly made up of career starters, while also including a smaller number of job switchers and individuals returning to work. Taken together, these flows provide a robust and consistent indicator of the pipeline of new talent entering priority occupations and form a reliable basis for understanding the contribution of the education system to workforce supply.
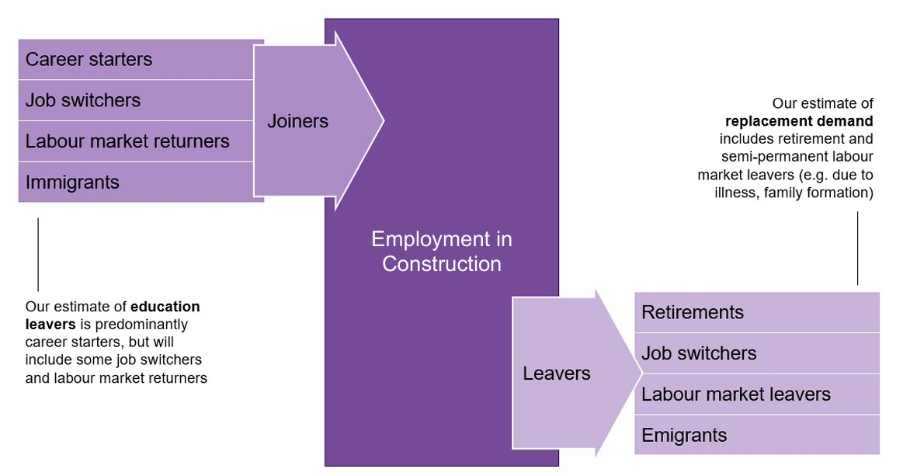
Figure 7 is a stock and flow diagram showing how people join the construction sector, listed as career starters, job switchers, labour market returners, immigrants. It then shows what makes them leave: retirements, job switchers, labour market leavers, emigrants. For joiners, the diagram states that Skills England’s estimate of education leavers is predominantly career starters, but will include some job switchers and labour market returners. For leavers, the diagram outlines that Skills England’s estimate of replacement demand includes retirement an semi-permanent labour market leavers (for example, due to illness, family formation).
6.1 Important training routes
There are multiple routes by which people enter employment in a given occupation. Using information on historic pathways into these occupations and the Skills England Occupational Maps, we have identified the most prominent routes that provide direct supply into priority occupations identified for the construction sector. The routes relate to entry into the occupation but cover all industries and are not specific to employment in the construction sector. These routes are summarised in Table 3.
Training routes are listed below by the proportion of education leavers in employment that enter a priority occupation. The volume of education leavers is also listed for a particular route.
Key training routes broadly split into 3 types of courses:
- well-aligned routes, often technical in nature, where a high proportion of leavers progress into priority occupations, but sometimes with small cohorts
- balanced routes, where a reasonable proportion of leavers progress into priority occupations from a larger cohort
- high-volume routes, where a smaller proportion of leavers progress to priority occupations but contribute a large share of employment
Not all 3 course types are present in all sectors. For well-aligned routes, increasing the supply into priority occupations will likely require an increase in enrolments. Whereas for other routes that are less well-aligned, increasing the progression rates to priority occupations may be more effective.
Table 4 does not include high-volume bespoke, short-course routes, such as Skills Bootcamps or sector-based work academy programmes (SWAPs), which often lead into labourer roles and apprenticeships for more specialised trades.
Table 3: Key routes related to priority occupations relevant to construction
| Pathway | Subject area | Level group | Number of education leavers entering priority occupations | Percentage of employed education leavers entering priority occupations |
|---|---|---|---|---|
| Apprenticeship | Building and construction | Level 2/3 | 3,600 | 70% |
| Apprenticeship | Engineering | Level 2/3 | 4,910 | 63% |
| Higher Education | Architecture, building and planning | Level 6+ | 4,050 | 58% |
| Further Education | Building and construction | Level 2/3 | 2,950 | 28% |
Source: Skills England estimates based on employment in 2022/23 tax year
Note: The routes relate to entry into the priority occupations identified by DBT but, as these occupations can span multiple sectors beyond construction, this analysis is not strictly specific to employment in the construction sector.
These 4 routes in Table 3 account for 53% of education leavers entering priority occupations for the sector. This shows important training routes for construction include higher education, further education including T Levels, and apprenticeships. Therefore, for supply into the construction sector, a broad range of provision types are important. However, apprenticeships comprise 2 of the 5 key routes. The sector has well established apprenticeship routes into priority occupations and these cover a wide range of roles. Engineering level 2/3 apprenticeships have a high rate of leavers entering priority occupations in construction (63%), but it is building and construction level 2/3 apprenticeships that best serve the sector in terms of conversion, with 70% of education leavers from this route entering priority occupations.
For higher education, architecture, building and planning at level 6+ is a key route. This route provides a high number of entrants into priority occupations, particularly architectural roles but also quantity surveyors and chartered surveyors.
Some newer training routes are not included in the historic data, including newer apprenticeship standards and Skills Bootcamps.
Overall, based on the Skills England Occupational Maps, there are 117 apprenticeship standards linked to priority occupations in the sector, and 12 new standards have been introduced since August 2022 covering more specialised areas linked to priority occupations. In the 2024 to 2025 data, 91% of achievements on live standards were at level 2 or level 3. Apprenticeships at higher levels may have a close link to employment in the construction sector, but the volumes of learners for these are relatively low.
6.2 Trends in training routes
We can get a sense of how supply into priority occupations is changing by looking at the number of learners successfully completing a course (defined as ‘achievements’) that is aligned with these occupations. Where courses have grown in achievement numbers, this could suggest that these courses will continue to be key pathways into priority occupations in the sector. Table 4 gives an overview of the change in achievement figures for the key routes over the 2 years between 2021 to 2022 and 2023 to 2024.
Table 4: Growth in achievements for key routes related to priority occupations
| Pathway | Subject area | Level group | Achievements in 2023 to 2024 | Growth in achievements since 2021 to 2022 |
|---|---|---|---|---|
| Apprenticeship | Building and construction | Level 2/3 | 11,050 | +60% |
| Apprenticeship | Engineering | Level 2/3 | 12,910 | +29% |
| Higher Education | Architecture, building and planning | Level 6+ | 17,590 | +8% |
| Further Education | Building and construction | Level 2/3 | 26,270 | +7% |
Source: Figures provided by the Department for Education
Note: Further Education figures for level 2/3 cover full level 2/3 only.
There were also 4,700 learners that achieved construction skills bootcamps in 2023 to 2024, increased from 2,000 in 2022 to 2023.
Construction apprenticeships have high growth, which in combination with a high rate of entrants into priority occupations means apprenticeships are likely to continue to be important for the sector. There is steady growth in other areas.
7. Technical annex - DBT construction modelling
This annex outlines construction workforce modelling conducted by the Department for Business and Trade (DBT).
DBT have produced workforce forecasts for the construction sector, divided into 3 main sections: the baseline workforce supply forecast, the demand forecasts, and calculations of the labour shortage.
7.1 Modelling and results
Construction is a foundational industry, providing critical inputs and infrastructure to all growth sectors within the Industrial Strategy. However, a reduction in the overall size of the workforce, and a lack of competent workers in a number of construction occupations is consistently cited as a key area for concern, with contributing factors including an ageing workforce and difficulty attracting and retaining enough new entrants to the workforce.
DBT analysis of the demand and supply of construction workers aims to quantify the size of the labour shortage by occupation in future years, focusing on the influence of the infrastructure and built environment commitments made by the current government.
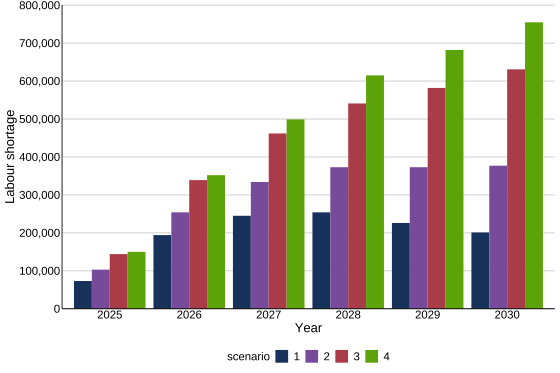
Workforce demand is comprised of two key components, business as usual (BAU) and additional demand from government commitments, such as housebuilding. For DBT’s low scenario (scenario 1), it has been estimated that under BAU conditions, the gap between demand and supply is around 132,000 lower than 2024 levels. Whereas, an estimated 333,000 workers will be required for housebuilding between 2024 and 2030 to fulfil the government’s commitment to build 1.5m homes in England this Parliament. Therefore, the aggregate labour shortage is (-132,000 + 333,000 =) 201,000. For DBT’s high scenario (scenario 4), these figures are 422,000 and 333,000, respectively, totalling an aggregate shortfall of construction workers of 755,000. This means the shortfall of construction labour is estimated to be between 201,000 and 755,000 by 2030. It is estimated that future supply could meet this level of demand, but it would be at the upper edge of what is considered a likely range.
Business as usual demand forecasts
Four BAU demand forecast scenarios were produced, to represent a range of possible futures:
- D1 - demand declines overall, for example if repair, maintenance, and improvements (RMI) become more expensive as firms and workers pivot to housebuilding (reduction in demand in this scenario was chosen as the 2023-2024 level of -1.1% across the construction industry according to Experian)
- D2 - demand is constant at 2024 levels
- D3 - represents the main scenario used in this report, where demand grows as per the CITB Construction Workforce Outlook (CWO) forecast extrapolated to 2030, but BAU housebuilding is kept constant
- D4 - demand grows as per Experian’s forecast (UK Construction Forecast Summer 2025, Experian) extrapolated to 2030, but BAU housebuilding is kept constant
We caveat that future demand in each scenario was calculated based on the increase beyond the current workforce. We assume that the current workforce is sufficient to meet demand. We know that this is not the case, but we are not able to quantify the difference to include in the forecast.
Figure 8: DBT construction workforce analysis: Labour shortage in the construction sector
7.2 Baseline workforce supply forecasting
The output of the first phase is a forecast of the supply of workers for coming years, based on historical data. A Bayesian Structural Time Series (BSTS) model was used to forecast the overall size of the workforce, and this was combined with a stock and flows model which was used to understand the decomposition of net changes in workforce over time.
Supply forecast with BSTS model
The BSTS model uses data from the Labour Force Survey, filtered for construction SIC section F only, and then scaled up using a subsector breakdown from 2023 industry employment data to cover workers in construction who fall under SIC section M (Professional, Scientific and Technical Activities), such as some architects and engineers working in construction services firms. The model uses past trends to predict what is likely in the future.
7.3 Demand forecasts
This stage of the work involved analysis of the demand for workers in the construction sector. This was done in two strands: business as usual (BAU) demand and demand relating to government commitments (such as housebuilding, retrofit, and infrastructure). The total demand forecast is the sum of BAU demand and government commitment demand.
In both strands, construction labour productivity is assumed to remain constant. An improvement in productivity, for example due to increased skill levels, or adoption of modern methods of construction (MMC), would decrease workforce demand over time, but is unlikely to have a large effect by 2030. For example, a 2019 CITB report estimated that if the previous government’s 300k per annum housing target had been achieved by 2025 to 2026 with half of new homes built with MMC, labour demand in housebuilding could have decreased by up to 5%.
Other government department returns
Other government department (OGD) demand forecast returns were sought for:
- housebuilding including Residential Planning Capacity, Registered Building Inspectors and Architects needed for housebuilding (MHCLG)
- housing quality (MHCLG)
- retrofit (DESNZ)
- infrastructure (NISTA)
- building safety + cladding (MHCLG)
Of the above, the 3 main contributors to the demand forecast in terms of volume are homebuilding, infrastructure and domestic repair, maintenance and improvement (RMI), including retrofit; figures for retrofit and housing quality were not available at the time of writing. Housing quality covers the Renters’ Rights Bill (including extending the Decent Homes Standard to the private rented sector), and Awaab’s Law. Registered Building Inspectors and residential planning capacity were included in the housebuilding return. Due to timing, the workforce required for £9 billion Defence Housing Strategy have not been included this iteration of the model.
Housebuilding (MHCLG)
MHCLG analysts have calculated the number of additional workers needed to complete the government ambition to build 1.5m homes in England – the total number of additional workers required was estimated at 333,000. This estimate is uncertain and is highly sensitive to assumptions – more information is provided in the Skills England Assessment of Priority Occupations publication.
Infrastructure (NISTA)
The updated infrastructure pipeline labour modelling was published in March 2026.
The pipeline details 734 planned projects covering £718 billion of private and public sector investment over the next decade. It also indicates the average annual workforce required of between 629,000 and 706,000 over the next five years – with construction jobs accounting for over two thirds of this demand.
Work started on producing the Skills Needs Assessments before this was published and therefore uses the trajectories relating to the demand scenarios from the BAU forecasts. Note that this approach may not reflect the required changes in the mix of occupations as spending shifts between underlying subsectors.
7.4 Labour shortage
The third phase of this work brings together the outputs from the first two stages, with the difference between forecast demand and supply resulting in estimates of the total labour shortage.
Total shortage
To find the level of aggregated workforce requirements, we subtract the total workforce supply from the total demand for workers. As there were 4 demand scenarios, this resulted in a range of 4 different labour shortage scenarios. The differences between the scenarios reflect the high uncertainty in what might happen.
To create large scale growth in the construction workforce will require other routes or initiatives, such as an increase in workers moving into the sector from another, a decrease in workers leaving the sector for another, or any programmes devised by the Construction Skills Mission Board.
Occupations
BAU demand and supply forecasts were apportioned to occupation using a SIC-SOC matrix, and were combined with OGD returns which were provided by occupation. As the apportionment to occupations relies on past data, potential future changes in the mix of occupations in the workforce are not reflected.
Labour shortage by occupation
Calculations of the workforce shortage by SOC identified occupations with workforce shortages in 2030 of above a threshold of 5,000 (equating to around 30 occupations) as priority occupations. Any generic occupations were excluded, resulting in the remaining list reviewed as part of the Sectoral SNAs.