Sector Skills Needs Assessment – Clean energy
Updated 6 October 2026

© Crown copyright 2026
This publication is licensed under the terms of the Open Government Licence v3.0 except where otherwise stated. To view this licence, visit nationalarchives.gov.uk/doc/open-government-licence/version/3 or write to the Information Policy Team, The National Archives, Kew, London TW9 4DU, or email: psi@nationalarchives.gov.uk.
Where we have identified any third party copyright information you will need to obtain permission from the copyright holders concerned.
This publication is available at https://www.gov.uk/government/publications/skills-england-annual-skills-report-and-sectoral-skills-needs-assessments-2026/sector-skills-needs-assessment-clean-energy
1. Handling notes
The Skills Needs Assessments (SNAs) use occupations, as defined by Standard Occupation Classification (SOC) codes, to provide an indication of the skills needs for the sectors. These allow for a consistent approach and cross-sector comparison. However, they are an approximation and do not work for all types of employment, particularly in highly specialised and emerging roles. As such, we have expanded our methods by using the newly developed UK Standard Skills Classification to identify the skill areas relevant for priority occupations.
The Department for Energy Security and Net Zero (DESNZ) has published detailed modelling of clean energy workforce demand up to 2030 in its Clean Energy Jobs Plan (CEJP). DESNZ provided Skills England with estimates for 2023 and 2030 only. In section 5 of this report, estimates for intervening years were estimated by Skills England using simplifying assumptions (for example, a straight-line increase), and demand held flat after 2030. The CEJP analysis indicates that direct jobs in clean energy need to increase by 230,000 between 2023 and 2030, alongside an additional 190,000 indirect jobs. Based on this, Skills England assumes growth of 65,000 direct jobs between 2023 and 2025, implying an increase of around 161,000 between 2025 and 2030. DESNZ have published a breakdown of the heat and buildings contribution to clean energy workforce demand in the Warm Homes Plan.
Beyond 2030, there is a high level of uncertainty in the assumptions needed to continue this modelling. To avoid giving a potentially misleading picture, it has been agreed that projections will not be extended beyond 2030 until more reliable data is available. However, to enable comparison across other priority sectors which have demand projections to 2035, we have agreed with the Department for Energy Security and Net Zero to hold projected demand growth flat for the period from 2030 to 2035. This is also set out in section 5 below.
Note that data limitations mean it is not possible to assess the demographics of the clean energy workforce as a whole. The sector is highly diverse, with sub-sectors ranging from those dominated by SMEs to large infrastructure projects. However, available data, evidence and analysis for individual clean energy sectors can be found in Table A of the Clean Energy Skills Assessment.
The data and methodology used to create the Skills Needs Assessments are set out in the accompanying tables and technical annex published alongside this report.
2. Executive summary
According to analysis by Skills England and the Department for Energy Security and Net Zero, employment in the 31 priority occupations within clean energy sector is projected to grow by 63,000 (71%) between 2025 and 2030. This is more than that of any other priority sector as a percentage and is largely driven by the increased demand for jobs in low-carbon sectors. Taking replacement demand of 36,000 into account (due to retirement, mortality etc.), the projected growth for jobs in 2035 is 99,000.
These roles typically require a high proficiency in numeracy and the majority of projected additional employment (59%) in priority occupations require qualifications at level 2 or 3. This makes clean energy 1 of 3 sectors where the majority of expected demand is largely concentrated at low qualification levels, alongside Adult Social Care and Construction, although a substantial proportion of roles will still require higher-level qualifications (level 4 and above).
Clean energy shares common occupations and skills with other sectors such as advanced manufacturing, defence, and construction. There is substantial overlap with these sectors and 28 of the 31 priority occupations are shared with at least one other sector. In particular, there appears to be competition between priority occupations in engineering with other sectors.
Priority occupations in clean energy are currently in high demand, with 14% in critical demand (substantially higher demand than usual) and 50% in either critical or elevated demand (above average).
Adoption of AI is changing the profile of job demand in the sector, with employers increasingly prioritising AI competency skills over traditional degrees required for clean energy jobs.
Historically, the most important education pathways into priority occupations for Clean Energy are level 2 and 3 apprenticeships, supported by higher education pathways at level 6 or above. Key routes are concentrated in engineering as well as building, construction and architecture.
Growth in training provision for the most important pathways into priority occupations in clean energy has been strongest in level 2 and 3 building and construction and engineering apprenticeships. As such, these routes are expected to support the projected demand growth for the sector. Between 2021 to 2022 and 2023 to 2024, achievements increased by 60% for building and construction and 29% for engineering apprenticeships, while manufacturing apprenticeships have seen a large decline of 53%.
3. Workforce overview and demographics
As defined in the Clean Energy Jobs Plan, ‘clean energy jobs’ are jobs that directly support the low-carbon energy transition, encompassing clean energy generation, transmission and distribution, greenhouse gas removals, clean heat, and energy efficiency. This is not limited to those working in ‘clean energy sectors’ and can include roles through supply chains, as well as in traditional energy sectors linked to the energy transition or decommissioning, to meet our clean energy ambitions.
In 2025, it is estimated that clean energy employed 232,000 people across the UK. This is a Skills England estimate based on Department for Energy Security and Net Zero (DESNZ) estimates for clean energy jobs in 2023 and 2030. Clean energy jobs span various industries including renewables, nuclear, hydrogen and Carbon Capture Usage and Storage (CCUS), heat and buildings, and industrial decarbonisation. Many of these industries share common occupations and skills which are most in demand, predominantly in STEM, skilled trades, and managerial positions.
In 2025, DESNZ published the Clean Energy Jobs Plan, which sets out the growth in priority occupations within clean energy to 2030, an indication of where these jobs will be based, and the actions that the government is taking to support energy transition. This report builds on the Jobs Plan by providing further detail on current and future skills demand, identifying important pathways into the sector and assessing how well current provision is supporting routes into the sector.
Drawing on evidence from the Clean Energy Jobs Plan, clean energy employment shows strong regional variation across English regions, with substantial growth projected to 2030. In 2023, employment levels were highest in the North West (25,000 to 30,000 jobs), South West (20,000 to 25,000), and the East of England (15,000 to 20,000), reflecting existing strengths in areas such as offshore wind, nuclear, electricity networks and energy efficiency. Lower employment levels were observed in regions including the North East (5,000 to 10,000). Growth is expected across all English regions by 2030, with particularly large increases in the East of England (rising to 55,000 to 60,000 jobs), the North West (50,000 to 55,000), and the South East (40,000 to 45,000). Strong growth is also projected in Yorkshire and the Humber (30,000 to 35,000), the South West (30,000 to 35,000), and the West and East Midlands (25,000 to 30,000), while the North East is expected to grow to 15,000 to 20,000 jobs.
Looking ahead to 2030, all English regions are projected to experience strong growth in clean energy employment, though at different scales and driven by different technologies. The East of England is expected to see the largest increase, reaching 55,000 to 60,000 jobs, reflecting its central role in offshore wind, nuclear and energy infrastructure. The North West is projected to double to 50,000 to 55,000 jobs, while the South East and London are expected to reach 40,000 to 45,000 and 20,000 to 25,000 jobs respectively, driven by electricity networks, heat and retrofit, and professional services. Growth in the North East is projected to reach 15,000 to 20,000 jobs, slightly lower than other regions, reflecting a higher proportion of employment in technologies (such as hydrogen and carbon capture) that are expected to continue expanding beyond 2030.
Occupational demand patterns also vary regionally across England. Skilled construction and building trades are expected to account for at least one in 8 clean energy jobs in every region by 2030. Particularly high relative demand is expected in the East Midlands and North East, where around 10% of the existing construction workforce would be required to meet projected clean energy needs. The East of England is expected to have a higher-than-average concentration of science, research, engineering and technology roles, with 15% of clean energy jobs in these professions by 2030, compared with a national average of around 10%. Demand for skilled metal, electrical and electronic trades is expected to grow across all regions, with especially rapid growth in London, where demand in these occupations is projected to triple between 2023 and 2030.
Data limitations mean that it is not possible to assess demographics of the clean energy workforce as a whole at this stage. However, available data, evidence and analysis on sectors within clean energy are available in listed in Table A of the Clean Energy Skills Assessment.
4. Priority occupations and current demand
4.1 Priority occupations
Skills England has been working with the Department for Energy Security and Net Zero (DESNZ) to identify occupations of importance to the clean energy sector. These are aligned with the Clean Energy Jobs Plan, published in 2025. Occupations were selected for the clean energy Jobs Plan if they showed indications of higher demand and evidence of constrained supply. These were sense checked with DESNZ sector teams and industry bodies. Full details of the methodology used can be found in the Clean Energy Jobs Plan Technical Annex.
These priority occupations for clean energy account for around 40% of total demand in clean energy, reflecting the sector’s diverse range of activities. The prioritisation framework used by DESNZ to select priority occupations is not intended to be definitive, but instead provides a focused shortlist to help target support where it is likely to have the greatest impact.
There are 31 priority occupations for clean energy, 28 of which overlap with at least one other sector. The sectors with which clean energy has the most overlap in terms of priority occupations are construction, advanced manufacturing, and defence. Specifically, clean energy shares common engineering occupations with other sectors such as advanced manufacturing, defence, and digital and technology.
Three clean energy priority occupations do not overlap with the priority occupations selected for any of the other priority sectors: Electrical and electronic trades n.e.c.; Plastics process operatives; and Metal working machine operatives.
Table 1: Clean energy priority occupations appearing in at least 2 other sectors
| Occupation | Number of sectors including clean energy |
|---|---|
| Engineering professionals n.e.c. | 5 |
| Civil engineers | 4 |
| Electrical engineers | 4 |
| Electronics engineers | 4 |
| Production and process engineers | 4 |
| Engineering technicians | 4 |
| Production managers and directors in manufacturing | 3 |
| Mechanical engineers | 3 |
| Engineering project managers and project engineers | 3 |
| CAD, drawing and architectural technicians | 3 |
| Welding trades | 3 |
| Metal working production and maintenance fitters | 3 |
Of the priority occupations in clean energy, 14% are in critical demand (substantially higher demand than usual) and 50% are in either critical or elevated demand (above average). This is based on Skills England’s Occupations in demand analysis, published in 2025. This illustrates a high level of current demand for the priority occupations identified in the sector.
4.2 Demand for skills
The UK’s first Standard Skills Classification (SSC) provides a mapping of relevant skill areas to occupations. Using an initial prototype of the SSC, experimental analysis was conducted to identify the skill areas which are relevant to priority occupations. Across the priority occupations in the clean energy sector, the top three technical skill areas are:
- inspecting and testing structures and equipment
- installing building interior systems and equipment
- maintaining electrical and electronic equipment
Core Skills
The SSC also sets out 13 ‘Core Skills’, which are fundamental abilities that contribute to the capability to carry out the tasks associated with a specific job, such as numeracy, reading, and writing. They are often transferable, meaning they can be applied across different sectors of activity and roles. The SSC provides proficiency scores for core skills by occupation, on a 1 to 5 scale from minimal proficiency to expert proficiency.
The 13 Core Skills defined in the UK Standard Skills Classification (SSC) are listed below. These are foundational, transferable abilities required across occupations, and they are listed explicitly in the SSC Core Skills Explorer:
- planning and organising – setting goals, prioritising tasks, structuring approaches
- adapting – adjusting strategies or behaviour to new or changing situations
- working with others – collaborating effectively with teams or groups
- listening – understanding spoken communication, including non-verbal cues
- speaking – communicating clearly and confidently through speech
- leadership – motivating, guiding, and inspiring others
- learning and investigating – searching for, gathering, and understanding new information
- creating – developing original ideas, innovations, or solutions
- problem solving and decision making – identifying issues, analysing information, selecting solutions
- numeracy – applying mathematical techniques and interpreting numerical data
- digital literacy – using digital tools and technologies effectively (including AI)
- reading – interpreting written information accurately
- writing – communicating ideas clearly and persuasively in written form
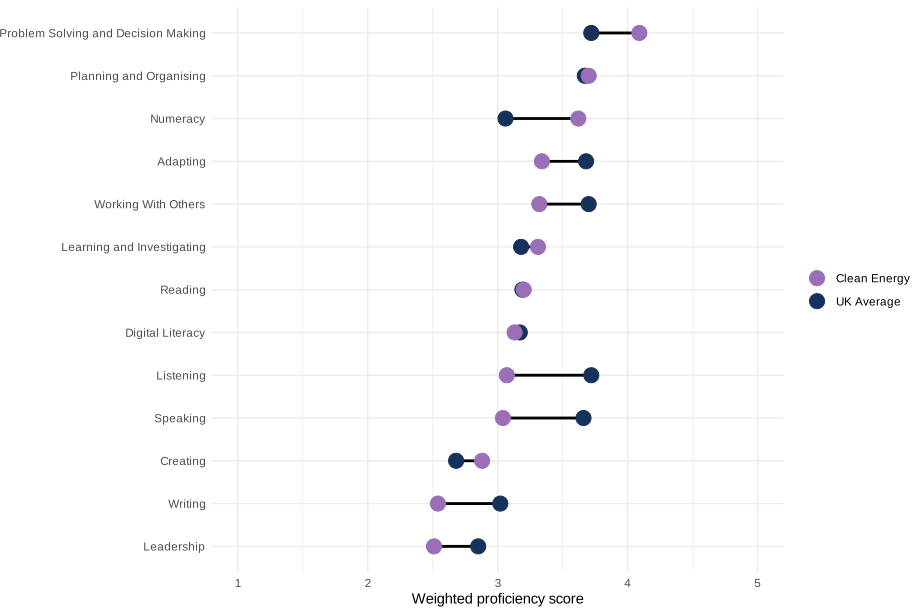
The required proficiency in core skills for the priority occupations in clean energy has been compared to the UK average. Where core skills have a higher required proficiency in priority occupations, this suggests that these skills are particularly important for these occupations. The graph below shows which core skills are important for the clean energy sector compared to the wider UK.
Clean energy requires notably higher proficiency in the core skills: Numeracy (3.6 versus 3.1).
Figure 1: Core skills proficiency for the clean energy sector compared to the UK
Source: Internal analysis using the UK Standard Skills Classification
5. Future demand for priority occupations
Employment demand is set to rise for priority occupations within the clean energy sector. They are projected to grow by 63,000 (71%) between 2025 and 2030.
Demand estimates are derived from DESNZ’s occupational analysis of direct clean energy jobs in 2023 and 2030. These estimates reflect workforce demand associated with delivering clean energy activities and are based on sector-level analysis undertaken by DESNZ. To translate sector-level demand into occupational demand, an experimental approach was developed to apportion clean energy jobs by occupation, at the 4 digit SOC level. This approach identified the relative importance of occupations based on economy-wide SOC by Standard Industrial Classification (SIC) employment breakdowns sourced from the ONS Annual Population Survey.
DESNZ provided estimates for 2023 and 2030 only. Estimates for intervening years were estimated by Skills England using simplifying assumptions (for example, a straight-line increase), and demand held flat after 2030. The Clean Energy Jobs Plan analysis indicates that direct jobs in clean energy need to increase by 230,000 between 2023 and 2030, alongside an additional 190,000 indirect jobs. Based on this, Skills England assumes growth of 65,000 direct jobs between 2023 and 2025, implying an increase of around 161,000 between 2025 and 2030.
Beyond 2030, there is a high level of uncertainty in the assumptions needed to continue this modelling. To avoid giving a potentially misleading picture, it has been agreed that projections will not be extended beyond 2030 until more reliable data is available. However, to enable comparison across other priority sectors which have demand projections to 2035, we have agreed with the Department for Energy Security and Net Zero to hold projected demand growth flat for the period from 2030 to 2035.
For a more detailed explanation please see the Clean Energy Jobs Plan Technical Annex.
5.1 Top occupations by employment growth to 2035
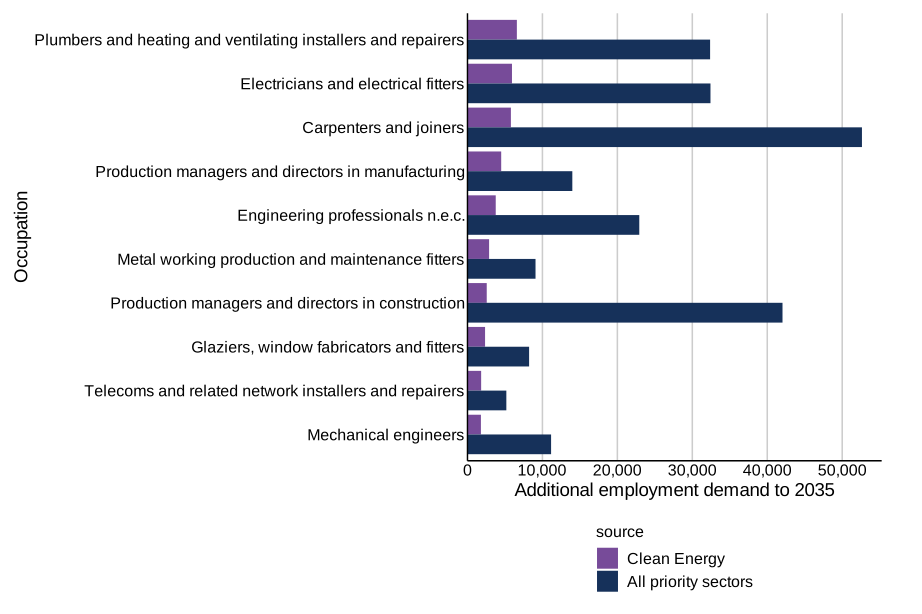
As seen in Figure 2, the occupation with the highest projected employment demand is Plumbers and heating and ventilating installers and repairers, with 6,600 additional workers needed in clean energy between 2025 and 2030. This occupation also faces demand from other priority sectors. The total projected employment demand for Plumbers and heating/ventilating installers and repairers across all priority sectors, including clean energy, is 32,400 workers.
Note that the approach for demand assumes uniform growth across all priority occupations. In practice, as the clean energy transition progresses, the relative importance and growth of different roles will change.
Figure 2: Top 10 priority occupations in the clean energy sector by additional employment to 2035
Source: Demand projections provided by DESNZ
Note: We have agreed with the Department for Energy Security and Net Zero to hold projected demand growth flat for the period 2030 to 2035 due to the large degree of uncertainty around the development of the clean energy sector.
5.2 Expected qualification levels
The majority (59%) of projected additional employment in priority occupations requires workers with qualifications at level 2 or 3, and 41% of roles require qualifications at level 4 and above. As shown in Table 2, this is a larger proportion than for across all priority occupations for the 10 priority sectors, where 38% of projected additional employment in priority occupations required workers qualified at level 2 or 3. Clean energy is 1 of 3 sectors where the majority of expected demand is at level 2 or 3 (alongside adult social care and construction) rather than level 4 or above.
Table 2: Expected qualification level of workers needed to meet demand to 2035 in priority occupations
| Priority occupations | Level 2 or 3 | Level 4 or above |
|---|---|---|
| Clean energy priority occupations | 59% | 41% |
| All priority occupations | 38% | 62% |
Source: Skills England planning scenarios based on sector-level projections
5.3 Alternative scenarios
Any future projection of how the economy will evolve is inherently uncertain. This uncertainty increases the further forward the projection extends. To improve the understanding of the uncertainty in the skills assessment projections, Skills England asked the sponsoring department to provide an alternative scenario.
The alternative scenario was developed by taking the average annual growth rate of direct employment observed in ONS Low Carbon and Renewable Energy Economy (LCREE) sectors between 2020 and 2023 and extrapolating this forward to 2030. Historical LCREE growth rates are likely to be conservative relative to expected future job growth in clean energy sectors. Furthermore, there is not perfect equivalence between LCREE sectors and clean energy – making direct comparisons more difficult.
The total job growth in the alternative scenario is shown in Table 3 below. In the Alternative scenario, growth in priority occupations is lower by 38,400 workers (24,700) compared to the central scenario (63,100). The growth rate in the Alternative scenario is 35%, which is 36 percentage points lower than the central scenario (71%).
Table 3: Central and alternative demand scenarios for clean energy growth in employment demand
| Scenario | Increase in employment demand from 2025 to 2035 | Percentage change in employment demand from 2025 to 2035 |
|---|---|---|
| Central | 63,100 | 71% |
| Alternative | 24,700 | 35% |
Numbers rounded to nearest 100
Source: Demand projections from DESNZ
Note: We have agreed with the Department for Energy Security and Net Zero to hold projected demand growth flat for the period 2030-2035 due to the large degree of uncertainty around the development of the clean energy sector.
The uncertainty in many of the projections is far greater currently due to the accelerated adoption of AI technology. Such technology will increase the productivity of many jobs and possibly reduce the demand for new workers in affected occupations. The speed of these changes will be uneven across the economy and very uncertain.
5.4 Replacement demand
In addition to expansion demand, where we consider the additional workers needed due to expected future sector growth, there is also demand for workers required to replace existing workers in the labour market. This is known as replacement demand. This is a broad estimate, based on applying rates from economy wide projections onto the employment estimates for priority occupations within the sector.
Our analysis focusses on expansion demand and assumes current supply is sufficient to maintain the existing size of the workforce. In practice, this will not be the case for some occupations.
Each year we estimate an average of 3,600 workers needing to be replaced within priority occupations in clean energy. Over the 10-year period of 2026 to 2035, the total estimated replacement demand is 36,000 workers.
This increases the total demand for workers. When combining this with total additional employment demand to 2035 (63,000), the total demand for workers in clean energy is 99,000.
6. Influence of AI on the clean energy sector
Clean energy industries are increasingly using AI tools to support the UK’s transition to net zero, with applications including predictive maintenance of clean energy assets, optimisation of energy efficiency, and forecasting of clean energy generation.
Transitioning workers from declining carbon-intensive industries and upskilling across the sector will be crucial to meeting demand, presenting large opportunities for reskilling and transferring expertise within the energy sector.
Adoption of AI across the sector is uneven with large utility companies and grid operators moving faster than SMEs, local authorities and community-scale initiatives with lack of digital capacity cited as a reason.
Traditional roles like grid engineers and maintenance supervisors are evolving into digitally empowered positions, requiring proficiency in predictive analytics, digital twins, and algorithmic modelling.
Demand for jobs is shifting rather than shrinking, with AI creating new opportunities alongside challenges. Employers are increasingly prioritising demonstrable AI competency skills over a traditional degree required for green jobs.
Skills England commissioned Dr Nisreen Ameen to develop an AI Skills tools package. As part of this, evidence from deep-dive workshops with sector leads and Skills England’s research and analysis report on AI skills for the UK workforce shows that AI skills in demand can be mapped to three broad domains:
Technical skills
- developing AI-enabled systems used in energy system planning, optimisation, and grid management
- developing predictive maintenance and fault detection tools
- working with digital twin
- geospatial analysis
Non-technical skills
- interpreting AI outputs in regulated contexts
- understanding modelling assumptions
- cross-disciplinary collaborating
- explaining AI use to regulators and stakeholders
Responsible and ethical skills
- ensuring reliability and robustness of AI-enabled forecasting and optimisation systems
- validating, monitoring and mitigating bias in local forecasting models
- safeguarding cybersecurity and critical infrastructure data
- maintaining auditability and transparency in automated decision-support systems
- aligning AI use with environmental, safety, and regulatory standards governing energy infrastructure
7. Education supply
As part of this assessment, we have considered the supply of workers in priority occupations relevant to the clean energy sector. Employment in the sector is influenced by a range of joiners (inflows) and leavers (outflows), as illustrated in Figure 3. This analysis focuses on one component of supply: inflows from education.
Education inflows capture individuals who move from education into employment in priority occupations. This group is predominantly made up of career starters, while also including a smaller number of job switchers and individuals returning to work. Taken together, these flows provide a robust and consistent indicator of the pipeline of new talent entering priority occupations and form a reliable basis for understanding the contribution of the education system to workforce supply.
Figure 3: Stock and flow of joiners and leavers into the clean energy sector
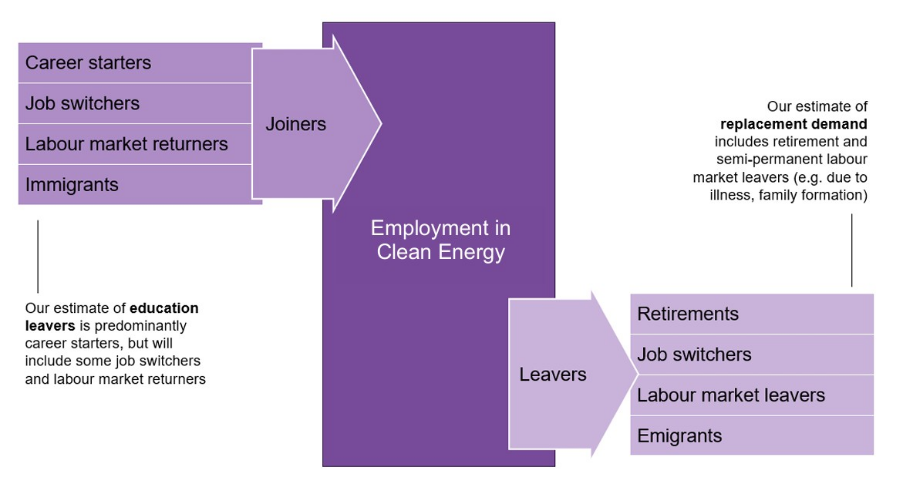
Figure 3 is a stock and flow diagram showing how people join the clean energy sector, listed as career starters, job switchers, returners, immigrants. It then shows what makes them leave: retirements, job switchers, labour market leavers, emigrants. For joiners, the diagram states that Skills England’s estimate of education leavers is predominantly career starters, but will include some job switchers and labour market returners. For leavers, the diagram outlines that Skills England’s estimate of replacement demand includes retirement and semi-permanent labour market leavers (for example, due to illness, family formation).
7.1 Important training routes
There are multiple routes by which people enter employment in a given occupation. The data available to consider these is limited. Using information on historic pathways into these occupations and the Skills England Occupational Maps, we have identified the most prominent routes that provide direct supply into priority occupations identified for the clean energy sector. The routes relate to entry into the identified priority occupations but, as these occupations can span multiple sectors beyond clean energy, this analysis is not strictly specific to employment in the clean energy sector. These routes are summarised in Table 4.
Training routes are listed below by the proportion of education leavers in employment that enter a priority occupation listed by DESNZ. The volume of education leavers is also listed for a particular route.
Key training routes broadly split into 3 types of courses:
- well-aligned routes, often technical in nature, where a high proportion of leavers progress into priority occupations, but sometimes with small cohorts
- balanced routes, where a reasonable proportion of leavers progress into priority occupations from a larger cohort
- high-volume routes, where a smaller proportion of leavers progress to priority occupations but contribute a large share of employment
Not all 3 course types are present in all sectors. For well-aligned routes, increasing the supply into priority occupations will likely require an increase in enrolments. Whereas for other routes that are less well-aligned, increasing the progression rates to priority occupations may be more effective.
Table 4: Key routes related to priority occupations for the clean energy sector
| Pathway | Subject area | Level group | Number of education leavers entering priority occupations | Percentage of employed education leavers entering priority occupations |
|---|---|---|---|---|
| Apprenticeship | Engineering | Level 2/3 | 5,640 | 72% |
| Apprenticeship | Building and construction | Level 2/3 | 3,040 | 59% |
| Apprenticeship | Manufacturing technologies | Level 2/3 | 2,520 | 45% |
| Higher Education | Engineering | Level 6+ | 5,100 | 38% |
| Higher Education | Architecture, building and planning | Level 6+ | 2,410 | 35% |
Source: Skills England estimates based on employment in 2022 to 2023 tax year
Note: The routes relate to entry into the identified priority occupations but, as these occupations can span multiple sectors beyond clean energy, this analysis is not strictly specific to employment in the clean energy sector.
The 5 routes in Table 4 account for 58% of education leavers entering priority occupations for the sector. This shows that level 6+ higher education and apprenticeships are key pathways for clean energy. Level 2/3 apprenticeships across Engineering, Building and Construction, and Manufacturing Technologies all have high proportions of education leavers entering priority occupations, with Engineering apprenticeships having the highest share entering priority occupations (72%). Across level 6+ higher education, Engineering, and Architecture, Building and Planning contribute similar numbers of education leavers entering priority occupations, though their rates are not as high as the apprenticeships mentioned above.
Further education training at level 2/3 in Building and Construction also contributes a large number of education leavers, but the share entering priority occupations is lower at 22%. Some newer training routes are not included in the historic data, including newer apprenticeship standards and Skills Bootcamps. Overall, based on the Skills England Occupational Maps, there are 140 apprenticeship standards linked to priority occupations for the sector. There have been 20 newly introduced apprenticeship standards since 2022, with majority in Engineering and Building and Construction. Apprenticeships include technician roles in Manufacturing, roles in the power industry for Engineering and the low carbon heating technician apprenticeship for Construction.
7.2 Trends in training routes
We can get a sense of how supply into priority occupations is changing by looking at the number of learners successfully completing a course that is aligned with these occupations. Where courses have grown in achievement numbers, this could suggest that these courses will continue to be key pathways into priority occupations in the sector. Table 5 gives an overview of the change in achievement figures for the key routes over the 2 years from 2021 to 2022, to 2023 to 2024.
Table 5: Growth in achievements for key routes related to priority occupations for the clean energy sector
| Pathway | Subject area | Level group | Achievements in 2023 to 2024 | Growth in achievements since 2021 to 2022 |
|---|---|---|---|---|
| Apprenticeship | Building and construction | Level 2/3 | 11,050 | +60% |
| Apprenticeship | Engineering | Level 2/3 | 12,910 | +29% |
| Higher Education | Architecture, building and planning | Level 6+ | 17,590 | +8% |
| Higher Education | Engineering | Level 6+ | 43,080 | +7% |
| Apprenticeship | Manufacturing technologies | Level 2/3 | 2,880 | -53% |
Source: Figures provided by the Department for Education
For apprenticeships, there has been very strong growth in building and construction achievements. However, achievements in Manufacturing have fallen by 53%. In level 6+ higher education courses, there has been steady growth in achievements.