Spotlight on sexually transmitted infections in the North East: 2021 data
Updated 19 January 2026
Applies to England

© Crown copyright 2026
This publication is licensed under the terms of the Open Government Licence v3.0 except where otherwise stated. To view this licence, visit nationalarchives.gov.uk/doc/open-government-licence/version/3 or write to the Information Policy Team, The National Archives, Kew, London TW9 4DU, or email: psi@nationalarchives.gov.uk.
Where we have identified any third party copyright information you will need to obtain permission from the copyright holders concerned.
This publication is available at https://www.gov.uk/government/publications/sexually-transmitted-infections-north-east-data/spotlight-on-sexually-transmitted-infections-in-the-north-east-2021-data
Summary
Sexually transmitted infections (STIs) represent an important public health problem in the North East. Out of 9 UK Health Security Agency (UKHSA) regions, it had the fourth highest rate of new STIs in 2021 (440 diagnoses per 100,000 population).
New STI diagnosis rates by upper tier local authority ranged from 267 per 100,000 population in Northumberland to 688 per 100,000 population in Middlesbrough. The number of new STIs diagnosed in North East residents decreased by 4% between 2020 and 2021.
Reductions in diagnosis of the 5 major STIs were seen in:
- gonorrhoea (6%)
- chlamydia (3%)
- genital herpes (less than 1%)
- genital warts (7%)
Syphilis increased by 9%.
Chlamydia and gonorrhoea were the most frequently diagnosed STIs (6,994 and 1,231 cases respectively). However, both STIs showed decreases when compared to 2020 (-3% and -6% respectively) and 2017 (-29% and -31% respectively). Syphilis diagnosis rates were higher than the England rate (13.3 per 100,000 population) in Middlesbrough (41.1 per 100,000 population), Stockton-on-Tees (37.0 per 100,000 population) and Redcar and Cleveland (21.1 per 100,000 population).
In June 2021, the National Chlamydia Screening Programme (NCSP) changed to focus on reducing reproductive harm of untreated infection in young women. This led to a change in the recommended chlamydia detection rate indicator (DRI) included in the Public Health Outcomes Framework (PHOF).
UKHSA recommends that local authorities work towards the revised female-only PHOF benchmark DRI of 3,250 per 100,000 females aged 15 to 24 years. This report relates to 2021 data, for the most part of which the NCSP recommended an offer of screening to all sexually active young people aged under 25 years.
In 2021, the chlamydia diagnosis rate among North East residents aged 15 to 24 years (all recorded genders) was 1,413 per 100,000 residents, against the previous recommended DRI of least 2,300 per 100,000 residents aged 15 to 24 years (all recorded genders).
Rates of new STIs vary somewhat between men and women (393 and 450 per 100,000 residents, respectively). Where gender and sexual orientation are known, gay, bisexual and other men who have sex with men (GBMSM) account for 15% of North East residents diagnosed with a new STI excluding chlamydia diagnoses reported via Chlamydia Testing Activity Dataset (CTAD) surveillance system (30% of those diagnosed with syphilis and 43% of those diagnosed with gonorrhoea).
STIs disproportionately affect young people. North East residents aged between 15 and 24 years accounted for 55% of all new STI diagnoses in 2021. A steep decline (94% decrease) has been seen between 2017 and 2021 in genital warts diagnosis rates in females aged 15 to 19 years. This follows the introduction in 2008 of vaccination against human papillomavirus (HPV), the virus that causes genital warts, for females aged 12 to 13 years.
The white ethnic group has the highest number of new STI diagnoses in the North East (9,082, 93%). Although less than 1% of new STIs are among the black Caribbean ethnic group, this group has the highest rate (1,928 per 100,000), which is 5 times the rate seen in the white ethnic group. Where country of birth was known, 92% of North East residents diagnosed with a new STI in 2021 (excluding chlamydia diagnoses reported via CTAD) were UK-born.
Conclusions
Following the disruptions in service delivery during the first year of the coronavirus (COVID-19) pandemic, the number of consultations at sexual health services (SHSs) increased between 2020 and 2021 and now exceeds the number reported in 2019. This provides evidence of a recovery in service provision, after the lifting of COVID-19 restrictions in the summer of 2021, partially driven by the continued widespread provision of online consultations.
The number of sexual health screens (for chlamydia, gonorrhoea, syphilis and HIV) in England also increased between 2020 and 2021, although the number of STI diagnoses remained stable. The increase in sexual health screens may be a result of built-up demand for SHSs as well as a return to pre-COVID-19 pandemic levels of social and sexual mixing and the substantial number of tests being accessed through online services (1 to 4).
It will remain important to continue to monitor and understand whether these changes have affected equity of access to SHSs (5, 6).
Chlamydia continues to account for the majority of STI diagnoses made in 2021, a large proportion of which are related to the NCSP. Screening rates for chlamydia have recovered gradually since the pandemic, with an increasing proportion of tests and diagnoses being made via internet services.
Although overall STI diagnoses rates remained similar between 2020 and 2021, there was an increase in bacterial STI diagnoses among GBMSM.
STIs continue to show geographic and socioeconomic variation and disproportionately impact GBMSM, people of black Caribbean ethnicity, and young people aged 15 to 24 years.
UKHSA’s main messages
Providers and commissioners have an important role in communicating messages about safer sexual behaviours and how to access services.
Important prevention messages
Using condoms consistently and correctly protects against HIV and other STIs such as chlamydia, gonorrhoea and syphilis and can prevent unplanned pregnancy.
Regular screening for STIs and HIV is essential to maintain good sexual health. Everyone should have an STI screen, including an HIV test, on at least an annual basis, if having condomless sex with new or casual partners.
In addition:
- women and other people with a womb or ovaries under the age of 25 years who are sexually active should have a chlamydia test annually and on any change of sexual partner
- GBMSM should have an annual test for HIV and STIs or every 3 months, if having condomless sex with new or casual partners
HIV pre-exposure prophylaxis (PrEP) can also be used to provide protection to people at risk of HIV while HIV post-exposure prophylaxis (PEP) can be used after condomless sex if someone has potentially been exposed to HIV, to reduce the risk of contracting HIV. Both of these can be obtained from specialist SHSs.
People living with diagnosed HIV who are on treatment and have an undetectable viral load are unable to pass on the infection to others during sex. This is known as ‘Undetectable = Untransmittable’ or ‘U=U’.
Vaccination against mpox (monkeypox) virus, HPV, hepatitis A and hepatitis B will protect against disease caused by these viruses and prevent the spread of these infections:
- GBMSM can obtain the mpox, hepatitis A and hepatitis B vaccines from specialist SHSs; these vaccines are also available for other people at high risk of exposure to the viruses
- GBMSM aged 45 years and under can also obtain the HPV vaccine from specialist SHSs
SHSs are free and confidential and offer testing and treatment for HIV and STIs, condoms, vaccination, HIV PrEP, and PEP:
- online self-sampling for HIV and STIs is widely available
- information and advice about sexual health, including how to access services, is available at Sexwise and from the national sexual health helpline on 0300 123 7123
Charts, tables and maps
Figure 1. New STI diagnosis rates by UKHSA region of residence, England, 2021
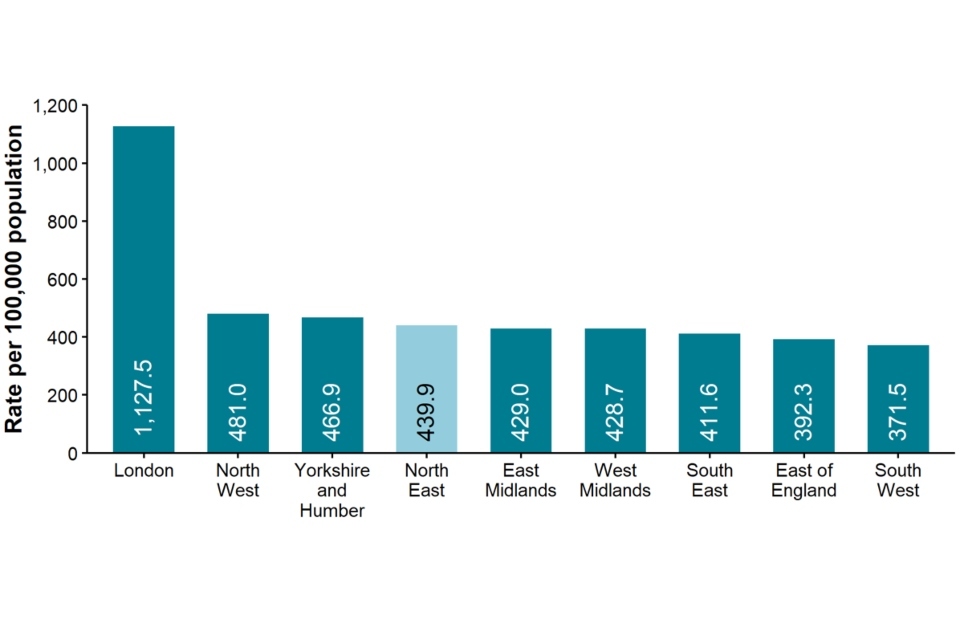
Data sources: GUMCAD STI surveillance system (GUMCAD), CTAD
Figure 1 is a bar chart showing the rate of new STI diagnosis per 100,000 population by UKHSA region of residence in 2021. The North East region has the fourth highest rate (439.9 per 100,000) in England. London has the highest rate (1,127.5 per 100,000) and the South West has the lowest (371.5 per 100,000).
Figure 2. Number of diagnoses of the 5 main STIs, North East residents, 2017 to 2021
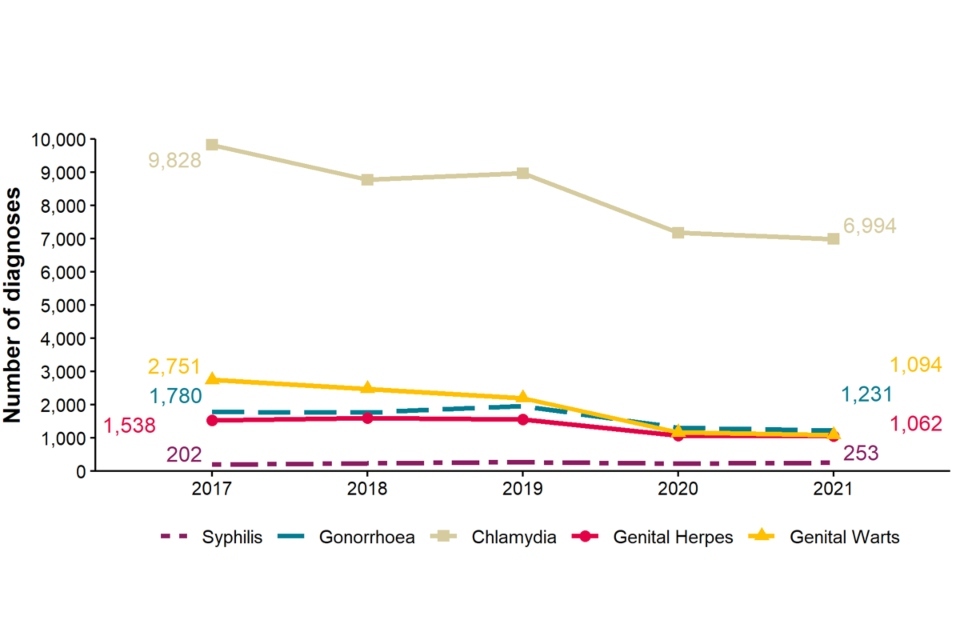
Data sources: GUMCAD, CTAD
[note 1] Any increase in gonorrhoea diagnoses may be due to the increased use of highly sensitive nucleic acid amplification tests (NAATs) and additional screening of extra-genital sites in GBMSM. Any decrease in genital wart diagnoses may be due to a moderately protective effect of HPV-16/18 vaccination. Any increase in genital herpes diagnoses may be due to the use of more sensitive NAATs. Increases or decreases may also reflect changes in testing practices.
Figure 2 shows trend lines for the number of diagnoses of the 5 main STIs among North East residents from 2017 to 2021. The number of diagnoses of chlamydia, genital warts, gonorrhoea and genital herpes were lower in 2021 compared to 2017. Chlamydia is the most frequently diagnosed STI from 2017 (9,828) to 2021 (6,994). Syphilis is the least frequent but is the only STI showing an increase in the number of diagnoses from 2017 (202) to 2021 (253).
Figure 3. Diagnosis rates of the 5 main STIs, North East residents, 2017 to 2021
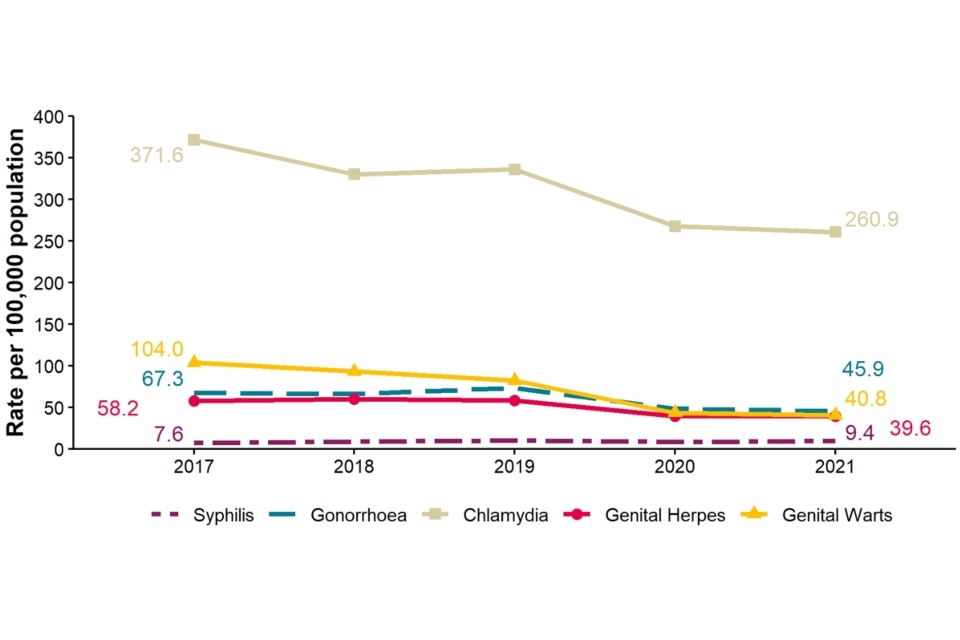
Data sources: GUMCAD, CTAD
See [note 1] above.
Figure 3 shows trend lines for diagnosis rates of the 5 main STIs among North East residents from 2017 to 2021 per 100,000 population. The diagnosis rates of chlamydia, genital warts, gonorrhoea and genital herpes have decreased in 2021 compared to 2017. The highest diagnosis rate is for chlamydia 2017 (371.6 per 100,000) to 2021 (260.9 per 100,000). The diagnosis rate for syphilis was the lowest diagnoses rate but is the only STI showing an increase from 2017 (7.6 per 100,000) to 2021 (9.4 per 100,000).
Table 1. Percentage change in new STI diagnoses, North East residents
| Diagnoses | 2021 | Percentage change from 2017 to 2021 | Percentage change from 2020 to 2021 |
|---|---|---|---|
| New STIs | 11,793 | -35% | -4% |
| Syphilis | 253 | +25% | +9% |
| Gonorrhoea | 1,231 | -31% | -6% |
| Chlamydia | 6,994 | -29% | -3% |
| Genital herpes | 1,062 | -31% | -1% |
| Genital warts | 1,094 | -60% | -7% |
Data sources: GUMCAD, CTAD
See [note 1] above.
Table 1 shows the percentage change in new STI diagnoses in North East residents. In 2021, 11,793 new STIs diagnoses were made in the North East, which is 4% lower than in 2020 and 35% lower than in 2017. Gonorrhoea, chlamydia, genital herpes and genital warts diagnoses all decreased from 2017 to 2021 and from 2020 to 2021. Genital warts had the biggest decrease from 2017 to 2021 (60% decrease) and from 2020 to 2021 (7% decrease). Syphilis was the only STI to show increases in diagnoses (25% increase from 2017 to 2021 and 9% increase from 2020 to 2021).
Figure 4. Rates of new STIs per 100,000 residents by age group (for those aged 15 to 64 years only) and gender in the North East, 2021
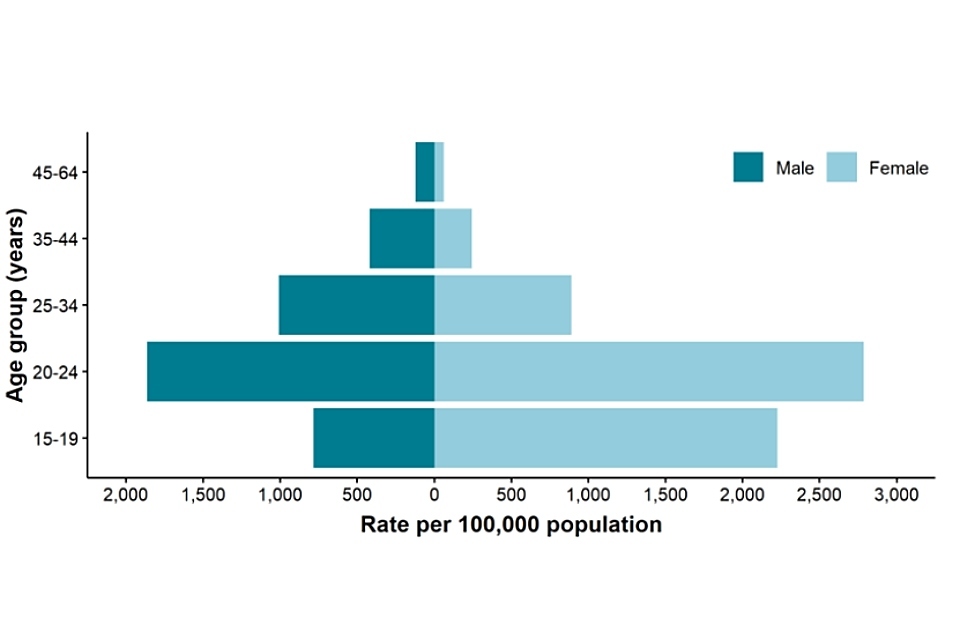
Data sources: GUMCAD, CTAD
Figure 4 is a bar chart showing that highest rates of new STIs in 2021 were in the group of those aged 20 to 24 years for both male and female, with a higher rate of diagnoses in females. The lowest rates of new STIs in 2021 were in the group of those aged 45 to 64 years for both male and female, with a higher rate of diagnoses in males.
Figure 5. Rates of gonorrhoea per 100,000 residents by age group [note 2] in the North East, 2017 to 2021
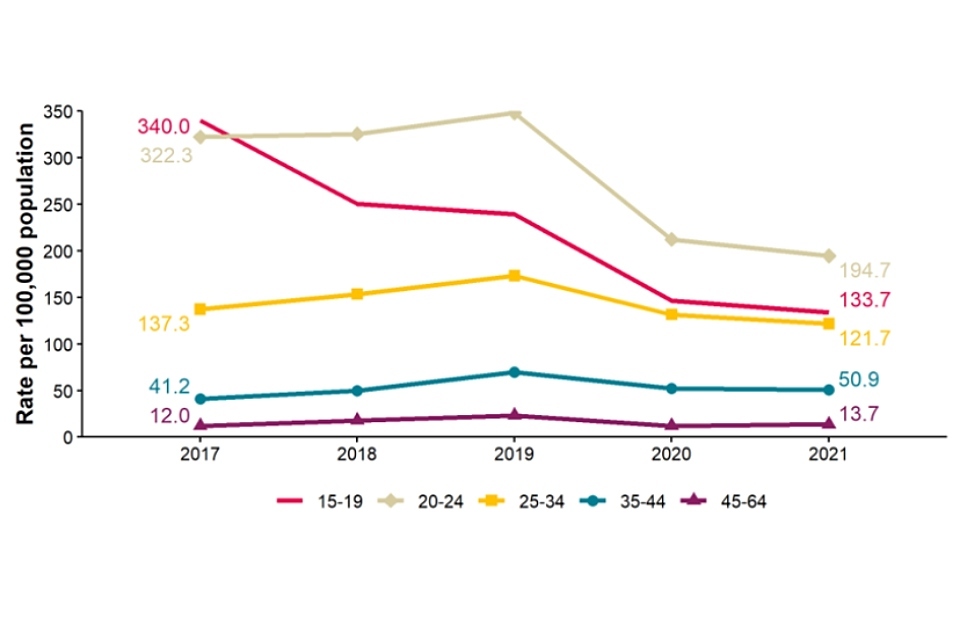
Data source: GUMCAD
[note 2] Age-specific rates are shown for those aged 15 to 64 years only.
Figure 5 shows trend lines for rates of gonorrhoea by age group in the North East from 2017 to 2021 per 100,000 residents. Rates of gonorrhoea declined in the groups of those aged 15 to 19 years, 20 to 24 years and 25 to 34 years from 2017 to 2021 but increased in older age groups. The highest rate of gonorrhoea has been in the group of those aged 20 to 24 years from 2018 to 2021. In 2017, the group of those aged 15 to 19 years had the highest rate. The group of those aged 45 to 64 years has had the lowest rates of gonorrhoea in the North East from 2017 to 2021.
Figure 6. Rates of genital warts per 100,000 residents aged 15 to 19 years by gender in the North East, 2017 to 2021
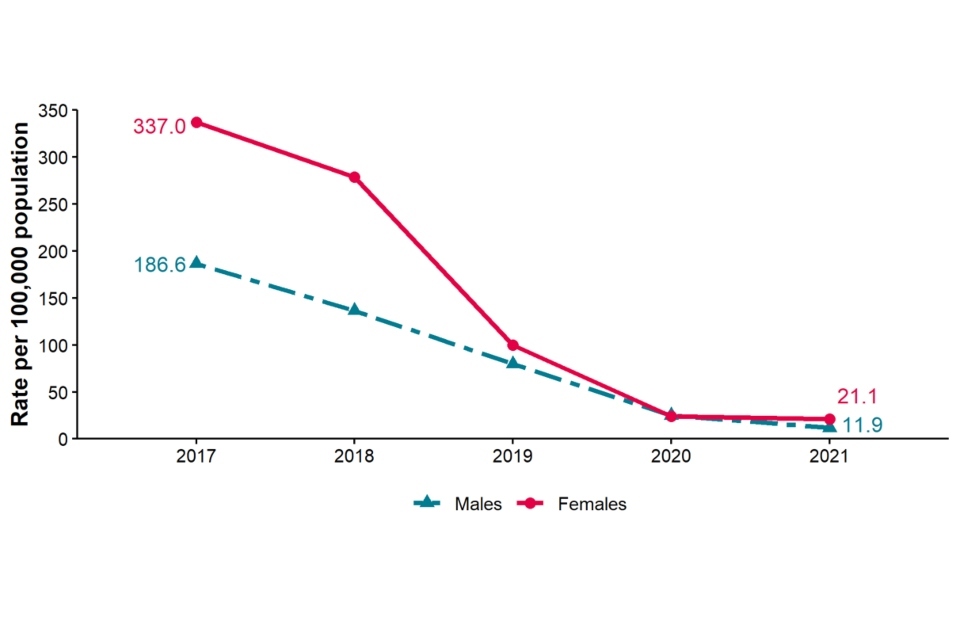
Data source: GUMCAD
Figure 6 shows trend lines for the rate of genital warts per 100,000 residents aged 15 to 19 years by gender in the North East in 2017 to 2021. The rates of genital warts decreased from 2017 to 2021 in both males (186.6 versus 11.9 per 100,000) and females (337.0 versus 21.1 per 100,000). Females show a higher rate than males, historically and currently in 2021 (21.1 versus 11.9 per 100,000 respectively), although this difference has reduced since 2019.
Figure 7. Rates of new STIs by ethnic group per 100,000 residents in the North East, 2021
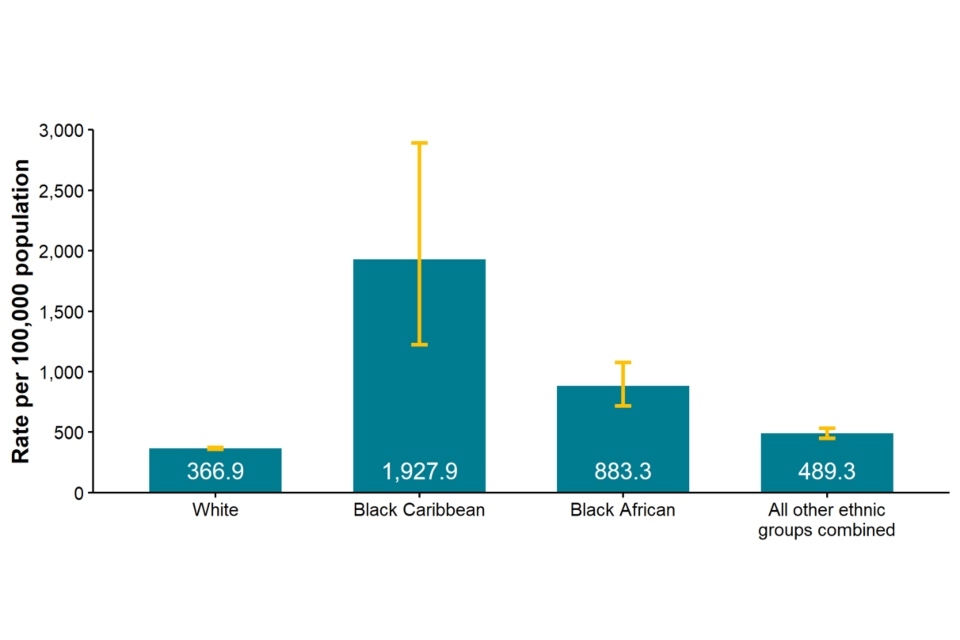
Data sources: GUMCAD, CTAD
Figure 7 is a bar chart showing the rate of new STIs by ethnic group in the North East in 2021 per 100,000 residents. The black Caribbean ethnic group shows the highest rate of new STIs (1,927.9 per 100,000), followed by black African ethnic group (883.3 per 100,000); all other ethnic groups combined (489.3 per 100,000) and white ethnic group (366.9 per 100,000). However, the number of diagnoses in black Caribbean and black African ethnic groups is very small (as seen in Table 2).
Table 2. Proportion of North East residents diagnosed with a new STI by ethnicity, 2021
| Ethnic group | Number | Percentage excluding unknown |
|---|---|---|
| White | 9,082 | 93% |
| Black Caribbean | 23 | 0% |
| Black African | 97 | 1% |
| All other ethnic groups combined | 534 | 5% |
| Unknown | 2,057 |
Data sources: GUMCAD, CTAD
Table 2 shows the proportion of North East residents diagnosed with a new STI by ethnicity in 2021. The white ethnic group made up the greatest proportion of STIs diagnosed (93%) and the black Caribbean ethnic group was the lowest proportion (less than 1%) of North East residents diagnosed with a new STI in 2021.
Figure 8. Proportion of North East residents diagnosed with a new STI by world region of birth [note 3], 2021
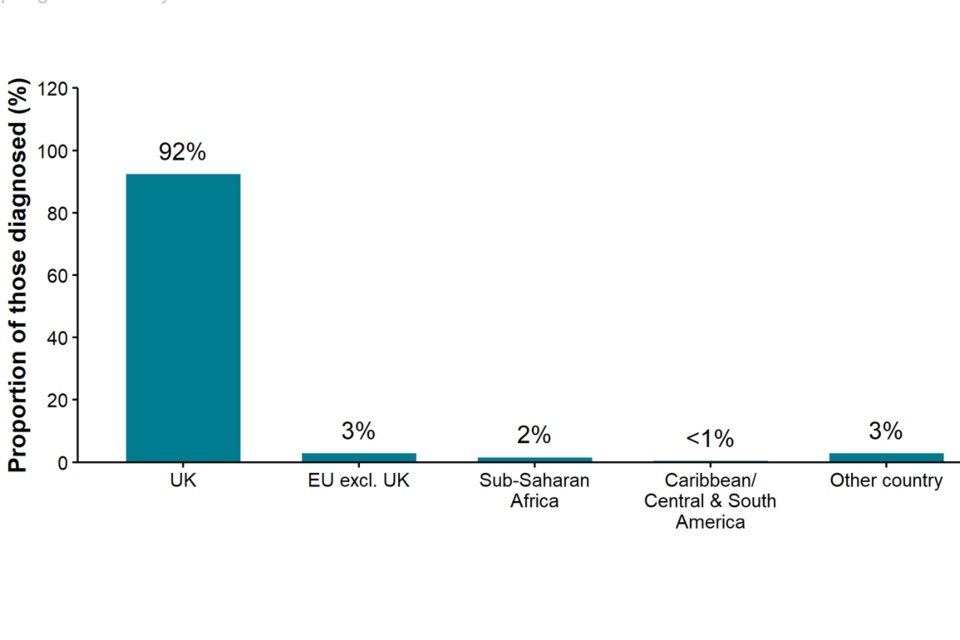
Data source: GUMCAD
[note 3] Data on country of birth is not collected by CTAD. All information about world region of birth is based on diagnoses made in specialist and non-specialist services, which report to GUMCAD.
Figure 8 is a bar chart showing the proportion of North East residents diagnosed with a new STI by world region of birth in 2021. The highest proportion of new STI diagnoses was in UK born (92%) North East residents, with all other regions at 3% or below.
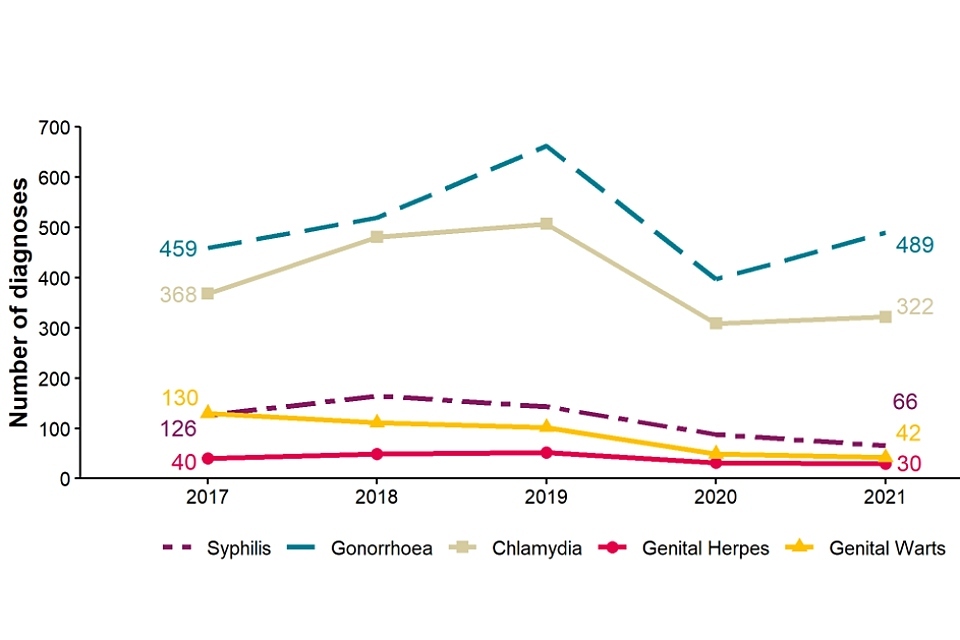
Figure 9. Diagnoses of the 5 main STIs among GBMSM [note 4], North East residents, 2017 to 2021
Data source: GUMCAD
[note 4] Data on sexual orientation is not collected by CTAD. All information about GBMSM is based on diagnoses made in specialist and non-specialist services, which report to GUMCAD.
GUMCAD started in 2009. Reporting of sexual orientation is less likely to be complete for earlier years, so rises seen may be partly artefactual.
Any increase in gonorrhoea diagnoses may be due to the increased use of highly sensitive nucleic acid amplification tests and additional screening of extra-genital sites in GBMSM. Any decrease in genital wart diagnoses may be due to a moderately protective effect of HPV-16/18 vaccination. Any increase in genital herpes diagnoses may be due to the use of more sensitive NAATs. Any increase or decrease may reflect changes in testing.
Figure 9 shows trend lines for diagnoses of the 5 main STIs among GBMSM in North East residents from 2017 to 2021. The diagnoses of gonorrhoea and chlamydia increased among GBMSM in the North East from 2017 to 2021. Gonorrhoea had the highest number of diagnoses (489), followed by chlamydia (322), in 2021. Diagnoses of syphilis, genital warts and genital herpes decreased from 2017 compared to 2021. Genital herpes had the lowest number of diagnoses (30) among GBMSM in 2021.
Table 3. Percentage change in new STI diagnoses in GBMSM residents in the North East
| Diagnoses | 2021 | Percentage change from 2017 to 2021 | Percentage change from 2020 to 2021 |
|---|---|---|---|
| New STIs | 1,051 | -22% | +6% |
| Syphilis | 66 | -48% | -25% |
| Gonorrhoea | 489 | +7% | +23% |
| Chlamydia | 444 | +21% | +12% |
| Genital herpes | 30 | -25% | -6% |
| Genital warts | 42 | -68% | -14% |
Data source: GUMCAD
See [note 4] above.
Table 3 shows the percentage change in new STI diagnoses in GBMSM residents in the North East. Some changes observed in 2020 and 2021 are attributable to the impact of the COVID-19 pandemic on services.
In 2021, fewer new STI diagnoses were made among GBMSM compared to 2017 (22% decrease) but more when compared to 2020 (6%). Syphilis, genital herpes and genital warts all showed percentage decreases when comparing 2017 to 2021 and 2020 to 2021. Genital warts showed the largest decrease between 2017 and 2021 (68% decrease) and syphilis showed the largest decrease between 2020 and 2021 (25% decrease). Gonorrhoea and chlamydia showed increases when comparing 2017 to 2021 and 2020 to 2021. The largest increase when comparing 2017 to 2021 was in chlamydia (21%) but when comparing 2020 to 2021 in gonorrhoea (23%).
Figure 10a. Rate of new STI diagnoses per 100,000 population among North East residents by upper tier local authority of residence, 2021
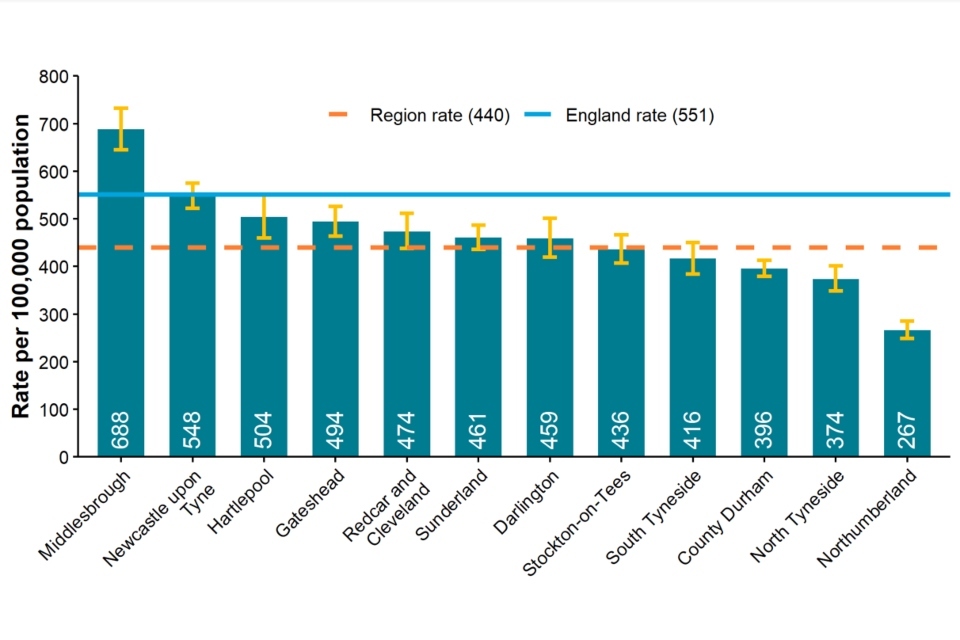
Data sources: GUMCAD, CTAD
Figure 10a is a bar chart showing the rate of new STI diagnoses per 100,000 population among North East residents by upper tier local authority of residence in 2021.
Middlesbrough had the highest rate (688 per 100,000), which was above the England rate (551 per 100,000), all other North East local authorities were below the national rate. Middlesbrough, Newcastle upon Tyne, Hartlepool, Gateshead, Redcar and Cleveland, Sunderland and Darlington had rates above the regional rate (440 per 100,000). Stockton-on-Tees, South Tyneside, County Durham, North Tyneside and Northumberland showed rates below the regional rate. Northumberland had the lowest rate (267 per 100,000) in the North East.
Figure 10b. Rate of new STI diagnoses (excluding chlamydia diagnoses in people aged 15 to 24 years) per 100,000 population aged 15 to 64 years among North East residents by upper tier local authority of residence, 2021
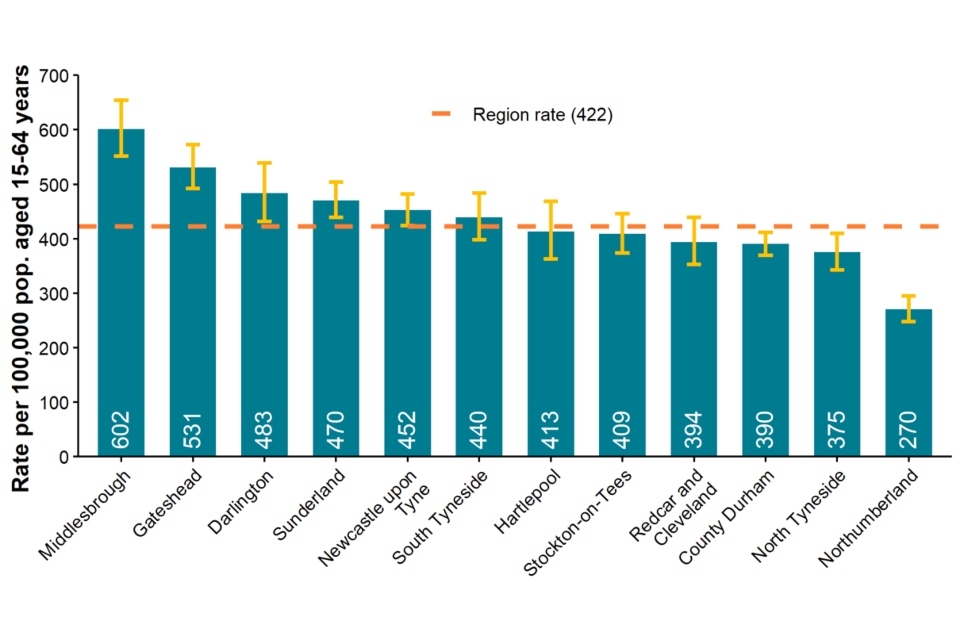
Data sources: GUMCAD, CTAD
Figure 10b is a bar chart showing the rate of new STI diagnoses (excluding chlamydia diagnoses in people aged 15 to 24 years) per 100,000 population aged 15 to 64 years among North East residents by upper tier local authority of residence in 2021. Middlesbrough remained as the highest rate (602 per 100,000) in the North East and Northumberland as the lowest (270 per 100,000). Middlesbrough, Gateshead, Darlington, Sunderland, Newcastle upon Tyne and South Tyneside had rates above the regional rate (442 per 100,000).
Figure 11. Chlamydia detection rate per 100,000 population aged 15 to 24 years in North East residents by upper tier local authority of residence, 2021
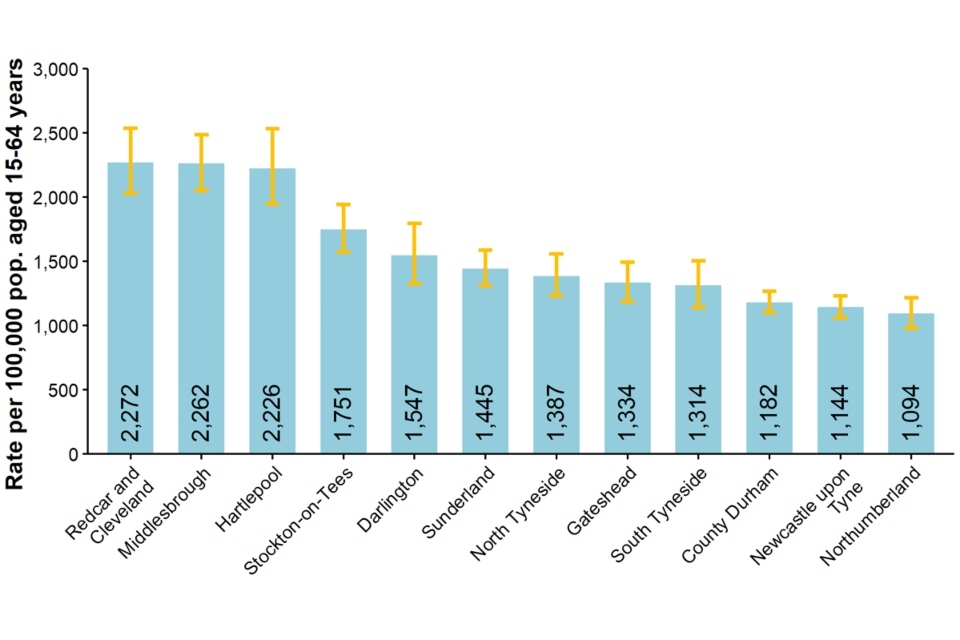
Data sources: GUMCAD, CTAD
Figure 11 is a bar chart showing the chlamydia detection rate per 100,000 population aged 15 to 24 years in the North East by upper tier local authority of residence in 2021.
The highest North East chlamydia detection rate was in Redcar and Cleveland (2,272 per 100,000) followed by Middlesbrough (2,262 per 100,000) and Hartlepool (2,226 per 100,000). Northumberland had the lowest detection rate (1,094 per 100,000), followed by Newcastle upon Tyne (1,144 per 100,000) and County Durham (1,182 per 100,000).
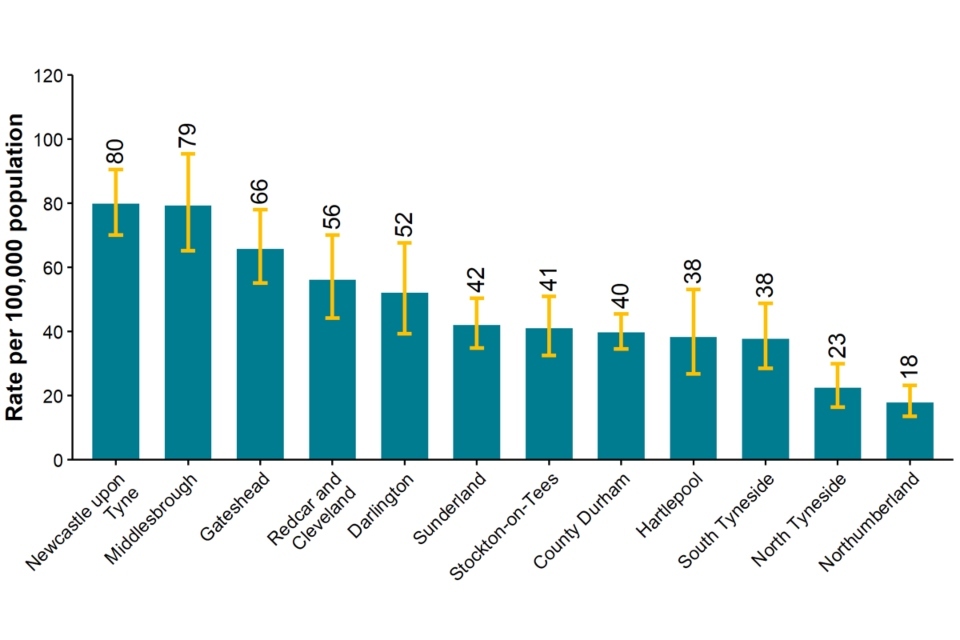
Figure 12. Rate of gonorrhoea diagnoses per 100,000 population in North East residents by upper tier local authority of residence, 2021
Data source: GUMCAD
Figure 12 is a bar chart showing the rate of gonorrhoea diagnoses per 100,000 population in North East residents by upper tier local authority of residence in 2021.
The highest rate of gonorrhoea was seen in Newcastle upon Tyne (80 per 100,000), followed closely by Middlesbrough (79 per 100,000) and Gateshead (66 per 100,000). The lowest rate was in Northumberland (18 per 100,000), followed by North Tyneside (23 per 100,000).
Figure 13. Map of new STI rates per 100,000 residents by upper tier local authority in the North East, 2021
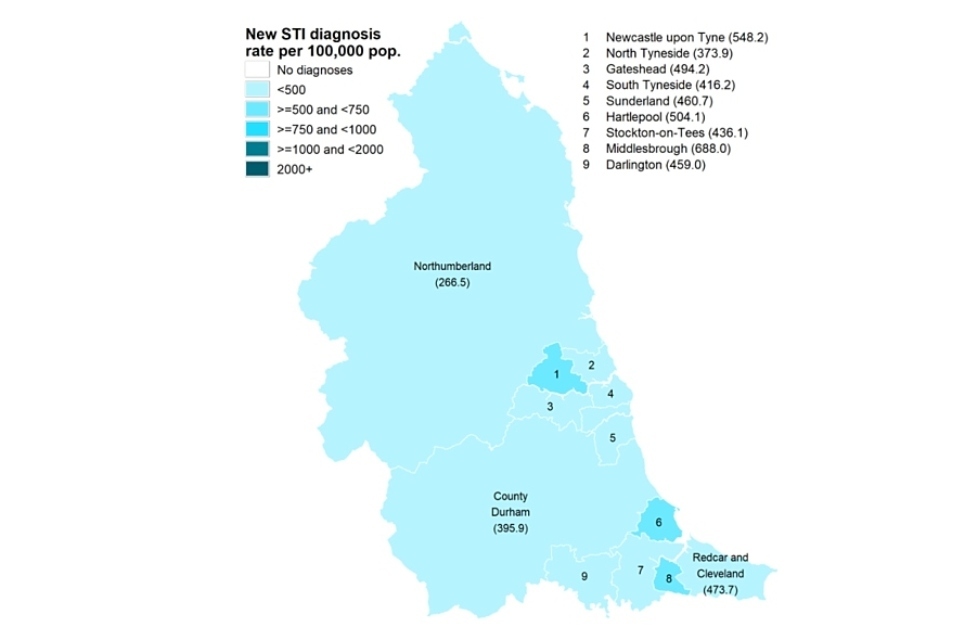
Data sources: GUMCAD, CTAD. Map contains Ordnance Survey data (© Crown copyright and database right 2021) and National Statistics data (© Crown copyright and database right 2021)
Figure 13 is a map of all North East upper tier local authorities showing new STI rates per 100,000 residents in 2021. All North East local authorities had rates below 750 per 100,000. The highest rates were in Newcastle upon Tyne (548.2 per 100,000), Hartlepool (504.1 per 100,000) and Middlesbrough (688 per 100,000). All other North East local authorities showed rates below 500 per 100,000.
Figure 14. STI testing rate (excluding chlamydia in under 25 year olds) per 100,000 population in North East residents aged 15 to 64 years, 2017 to 2021
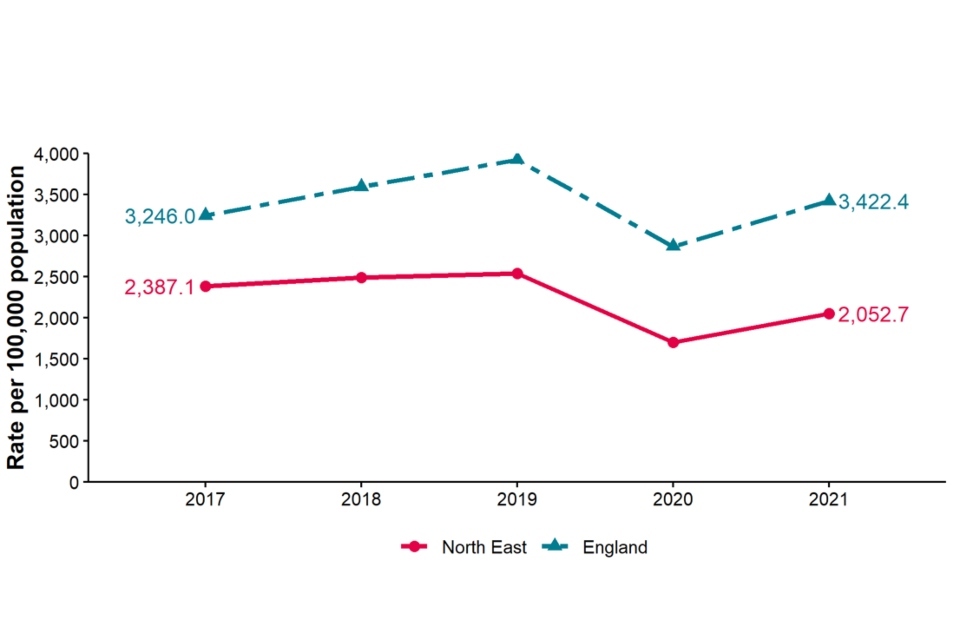
Data sources: GUMCAD, CTAD
Figure 14 shows trend lines for STI testing rates (excluding chlamydia in people aged under 25 years) per 100,000 population in North East residents aged 15 to 64 years from 2017 to 2021. The North East testing rate has been consistently below the England rate from 2017 to 2021. The testing rate in 2021 has decreased in the North East compared to 2017 (2,387 versus. 2,052 per 100,000). Nationally, the testing rate has increased from 2017 to 2021 (3,246 versus 3,422 per 100,000).
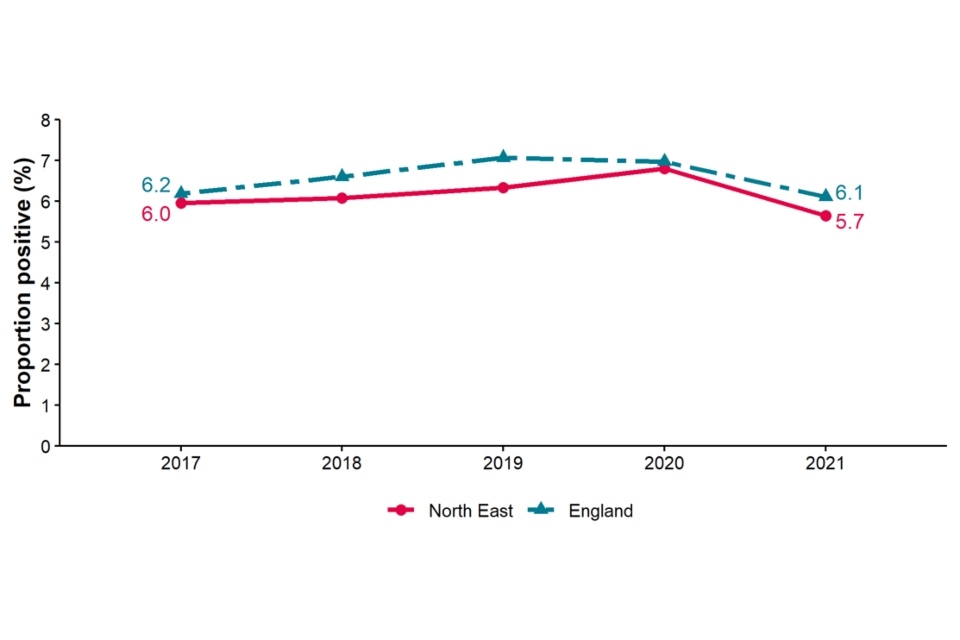
Figure 15. STI testing positivity rate [note 5] (excluding chlamydia in under 25 year olds) in North East residents, 2017 to 2021
Data sources: GUMCAD, CTAD
[note 5] The numerator for the STI testing positivity rate now only includes infections which are also included in the denominator. These are chlamydia (excluding diagnoses in those aged under 25 years), gonorrhoea, syphilis and HIV. Up to 2018 (data for 2017) it included all new STIs.
Figure 15 shows trend lines for the STI testing positivity rate (excluding chlamydia in under 25 year olds) in North East residents from 2017 to 2021. The STI testing positivity rate for the North East and England were similar in 2017 (6.0 and 6.2 per 100,000 respectively). In 2021, both rates remained similar with a small decrease (5.7 and 6.1 per 100,000 respectively).
Table 4. Number of diagnoses of new STIs by UKHSA region of residence, data source and data subset 2021
| UKHSA region of residence | GUMCAD specialist SHSs | GUMCAD non-specialist SHSs [note 6] | CTAD [note 7] | Total |
|---|---|---|---|---|
| East Midlands | 10,622 | 6,275 | 3,974 | 20,871 |
| East of England | 15,809 | 4,238 | 5,608 | 25,655 |
| London | 69,545 | 8,162 | 23,792 | 101,499 |
| North East | 7,495 | 1,580 | 2,718 | 11,793 |
| North West | 23,693 | 3,789 | 7,954 | 35,436 |
| South East | 26,578 | 1,960 | 8,287 | 36,825 |
| South West | 13,797 | 2,444 | 4,782 | 21,023 |
| West Midlands | 16,890 | 3,867 | 4,804 | 25,561 |
| Yorkshire and Humber | 16,031 | 2,050 | 7,724 | 25,805 |
Data sources: GUMCAD, CTAD
[note 6] Diagnoses from enhanced GPs reporting to GUMCAD are included in the ‘Non-specialist SHSs’ total.
[note 7] Including site type 12 chlamydia from GUMCAD.
Table 4 shows the number of diagnoses of new STIs by UKHSA region of residence in 2021. The highest total number of diagnoses was in London (101,499) and the lowest in the North East (11,793). The North East showed 7,495 diagnoses from GUMCAD specialist SHSs, 1,580 from non-specialist SHSs and 2,718 from CTAD which were all the lowest number out of all UKHSA regions. However, as shown in Figure 1, the North East (439.9 per 100,000) had the fourth highest diagnosis rate of new STIs out of all 9 UKHSA regions.
Table 5. Number of diagnoses of the 5 main STIs in the North East by STI, data source and data subset 2021
| 5 main STIs | GUMCAD specialist SHSs | GUMCAD non-specialist SHSs [note 8] | CTAD [note 9] | Total |
|---|---|---|---|---|
| Syphilis | 253 | 253 | ||
| Gonorrhoea | 1,024 | 207 | 1,231 | |
| Chlamydia | 2,904 | 1,372 | 2,718 | 6,994 |
| Genital herpes | 1,062 | 1,062 | ||
| Genital warts | 1,093 | 1 | 1,094 |
Data sources: GUMCAD, CTAD
[note 8] Diagnoses from enhanced GPs reporting to GUMCAD are included in the ‘Non-specialist SHSs’ total.
[note 9] Including site type 12 chlamydia from GUMCAD.
Table 5 shows the number of diagnoses of the 5 main STIs in the North East by source of diagnosis in 2021. Overall, all the 5 main STIs were diagnosed at GUMCAD specialist SHSs. CTAD is a surveillance system for chlamydia only, which is therefore the only STI diagnosed. Most chlamydia diagnoses came through specialist SHSs (2,904), followed by CTAD (2,718) and non-specialist SHSs (1,372). Syphilis and genital herpes were diagnosed exclusively through specialist SHSs.
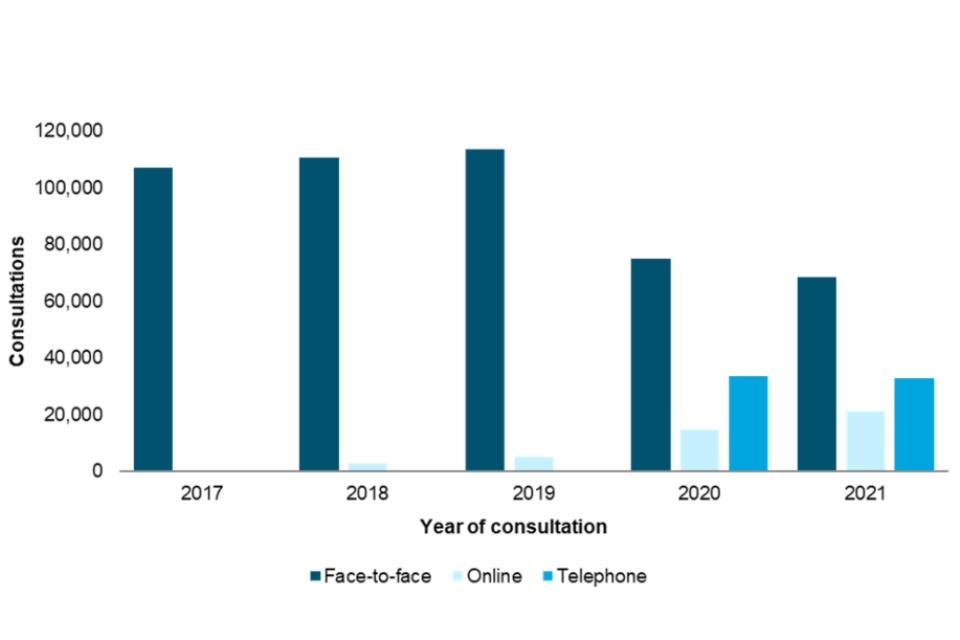
Figure 16. Consultations by consultation medium: North East residents, 2017 to 2021
Data sources: GUMCAD, CTAD
Figure 16 is a bar graph showing the number of consultations in North East residents attending SHSs (levels 2 or 3) over the 5-year period (2017 to 2021) by consultation type. In 2017 to 2019, most consultations were performed face to face, with a small number of online consultations in 2018 and 2019. During the first year of the COVID-19 pandemic, 2020, face-to-face consultations decreased, while telephone and online consultations increased, compared to 2019. Over half of consultations continued to be face to face; however, in 2020 and 2021 just below a third were telephone consultations.
Information on data sources
Find more information on local sexual health data sources on GOV.UK.
These figures are based on data from the GUMCAD and CTAD surveillance systems published on 4 October 2022 (data to the end of calendar year 2021).
GUMCAD surveillance system
This disaggregate reporting system collects information about attendances and diagnoses at specialist (level 3) and non-specialist (level 2) SHSs. Information about the patient’s area of residence is collected along with demographic data and other variables. GUMCAD superseded the earlier KC60 system and can provide data from 2009 onwards. GUMCAD is the main source of data for this report.
Due to limits on how much personally identifiable information sexual health clinics are able to share, it is not possible to deduplicate between different clinics. There is a possibility that some patients may be counted more than once if they are diagnosed with the same infection (for infection specific analyses) or a new STI of any type (for new STI analyses) at different clinics during the same calendar year.
CTAD surveillance system
CTAD collects data on all NHS and local authority or NHS-commissioned chlamydia testing carried out in England. CTAD is comprised of all chlamydia (NAATs) tests for all ages (with the exception of conjunctival samples), from all venues and for all reasons. CTAD enables unified, comprehensive reporting of all chlamydia data, to effectively monitor the impact of the NCSP through estimation of the coverage of population screening, proportion of all tests that are positive and detection rates.
For services that report to GUMCAD, and for which CTAD does not receive data on the patient’s area of residence (for example, SHSs), information about chlamydia diagnoses is sourced from GUMCAD data.
New STIs
New STI diagnoses comprise diagnoses of the following:
- chancroid
- Lymphogranuloma venereum (LGV)
- donovanosis
- chlamydia
- gonorrhoea
- genital herpes (first episode)
- HIV (acute and AIDS defining)
- Molluscum contagiosum
- non-specific genital infection (NSGI)
- non-specific pelvic inflammatory disease (PID) and epididymitis
- chlamydial PID and epididymitis (presented in chlamydia total)
- gonococcal PID and epididymitis (presented in gonorrhoea total)
- scabies
- pediculosis pubis
- syphilis (primary, secondary and early latent)
- trichomoniasis and genital warts (first episode)
- Mycoplasma genitalium
- shigella
Calculations
Confidence Intervals were calculated using Byar’s method.
Office for National Statistic (ONS) mid-year population estimates for 2020 were used as a denominator for rates for 2021. ONS estimates for 2011 were used as a denominator for rates for 2021 as these reports were produced before the estimates for 2021 (the first produced since 2011) were published.
Further information
As of 2020, all analyses for this report include data from non-specialist (level 2) SHSs and enhanced GP services as well as specialist (level 3) SHSs.
For further information, access the Sexual and Reproductive Health Profiles.
Find more information on local sexual health data sources on GOV.UK.
Local authorities have access to the Summary Profile of Local Authority Sexual Health (SPLASH) Reports (accessible from the Sexual and Reproductive Health Profiles) and the SPLASH supplement reports via the HIV and STI Data exchange.
For an Annual Epidemiological Spotlight on HIV in the North East, contact fes.northeast@ukhsa.gov.uk
About the Field Service
The Field Service was established in 2018 as a national service comprising geographically dispersed multi-disciplinary teams integrating expertise in Field Epidemiology, Real-time Syndromic Surveillance, Public Health Microbiology and Food, Water and Environmental Microbiology to strengthen the surveillance, intelligence and response functions of UKHSA.
You can contact your local Field Service team at fes.northeast@ukhsa.gov.uk
If you have any comments or feedback regarding this report or the Field Service, contact josh.forde@ukhsa.gov.uk
Acknowledgements
We would like to thank:
- local SHSs for supplying the SHS data
- local laboratories for supplying the CTAD data
- the UKHSA Blood Safety, Hepatitis, STI and HIV Division for collection, analysis and distribution of data
References
1. Mitchell KR, Shimonovich M, Bosó Pérez R, Dema E, Clifton S, Riddell J and others. ‘Initial Impacts of COVID-19 on sex life and relationship quality in steady relationships in Britain: Findings from a large, quasi-representative Survey (Natsal-COVID)’ The Journal of Sex Research March 2022: pages 1 to 12 (accessed 11 August 2022)
2. Howarth A, Saunders J, Reid D, Kelly I, Wayal S, Weatherburn P, Hughes G, and Mercer C. ‘Stay at home … Exploring the impact of the COVID-19 public health response on sexual behaviour and health service use among men who have sex with men: findings from a large online survey in the United Kingdom’ Sexually Transmitted Infections July 2022: pages 346 to 352 (accessed 11 August 2022)
3. Dema E, Gibbs J, Clifton S and others. ‘Initial impacts of COVID-19 on sexual and reproductive health service use and unmet need in Britain: findings from a large, quasirepresentative survey (Natsal-COVID)’ The Lancet Public Health January 2022: volume 7, pages e36 to 47
4. Sonnenberg P, Menezes D, Freeman L and others. ‘Intimate physical contact between people from different households during the COVID-19 pandemic: a mixed-methods study from a large, quasi-representative survey (Natsal-Covid)’. British Medical Journal Open February 2022: volume 12, issue 2 (accessed 11 August 2022)
5. Ratna N, Dema E, Conolly A and others. ‘O16 Ethnic variations in sexual risk behaviour, sexual health service use and unmet need during the first year of the COVID-19 pandemic: an analysis of population-based survey and surveillance data’. Sexually Transmitted Infections. 2022, volume 98: pages A8 to A9 (accessed 11 August 2022)
6. Sumray K, Lloyd KC, Estcourt CS, Burns F and Gibbs J. ‘Access to, usage and clinical outcomes of, online postal sexually transmitted infection services: a scoping review’ Sexually Transmitted Infections June 2022: pages 1 to 8 (accessed 11 August 2022)