Spotlight on sexually transmitted infections in London: 2025 data
Updated 8 October 2026
Applies to England

© Crown copyright 2026
This publication is licensed under the terms of the Open Government Licence v3.0 except where otherwise stated. To view this licence, visit nationalarchives.gov.uk/doc/open-government-licence/version/3 or write to the Information Policy Team, The National Archives, Kew, London TW9 4DU, or email: psi@nationalarchives.gov.uk.
Where we have identified any third party copyright information you will need to obtain permission from the copyright holders concerned.
This publication is available at https://www.gov.uk/government/publications/sexually-transmitted-infections-london-data/spotlight-on-sexually-transmitted-infections-in-london-2025-data
Summary
Trends in STI diagnoses
This report presents data on STI diagnoses among London residents. It includes new data from 2025, with historical trends going back to 2016. Any data from 2020 and 2021 should be interpreted with caution, because the COVID-19 pandemic affected both sexual behaviour and STI testing rates.
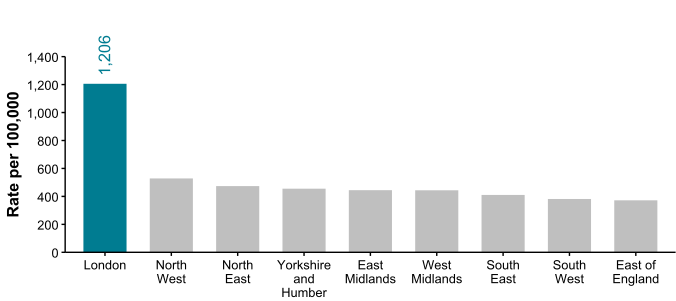
STIs represent an important public health issue in London. London has the highest rate of new STI diagnoses of all the UK Health Security Agency (UKHSA)’s regions in England.
In 2025, 109,596 STIs were diagnosed in London, a rate of 1,206 diagnoses per 100,000. Rates across London boroughs ranged from 450 per 100,000 in Havering to 2,709 per 100,000 in Lambeth.
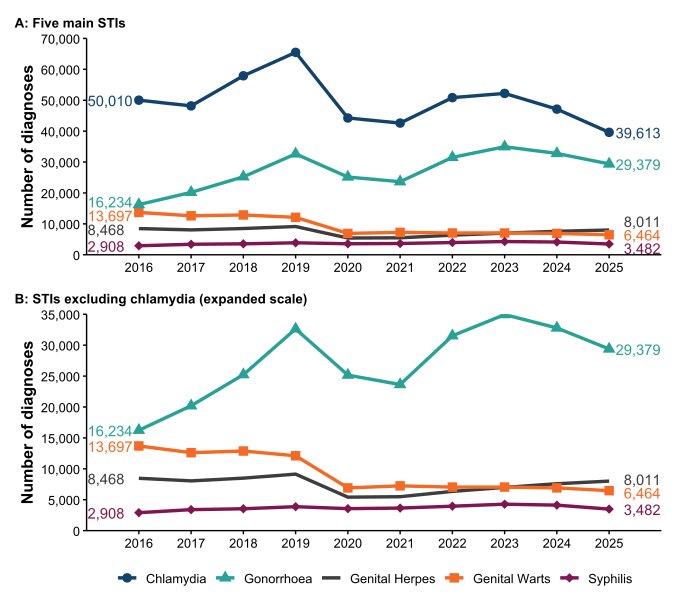
The number of STI diagnoses in London decreased (-11%) between 2024 and 2025. Decreases were seen in 4 of the 5 main STIs: syphilis (-6%), gonorrhoea (-10%), chlamydia (-16%), and genital warts (-7%). Genital herpes diagnoses increased by +6%.
UKHSA recommends that local areas should be working towards a chlamydia detection rate of at least 3,250 per 100,000 women aged 15 to 24 years, as a measure of screening effectiveness. This detection rate is an indicator in the Public Health Outcomes Framework. London did not achieve this target in 2025, with 1,374 detections per 100,000 (down from 1,656 per 100,000 in 2024).
Health inequalities
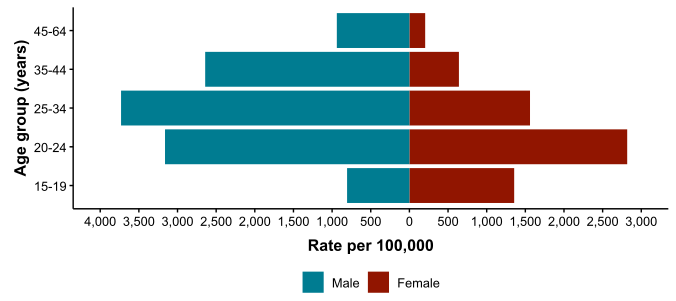
Rates of STI diagnoses differ between men and women (1,601 and 711 per 100,000, respectively). Gay and bisexual men are one of the groups disproportionately impacted by STIs. Where gender and sexual orientation were known, 38% of the 2025 London STI diagnoses were among gay and bisexual men. These proportions were higher for syphilis (77%) and gonorrhoea (74%).
STIs also disproportionately affect young people. People aged between 15 and 24 years accounted for 24% of London STI diagnoses in 2025. A steep decline has been seen in genital warts diagnoses in young people aged 15 to 19 following the 2008 introduction of HPV (human papillomavirus) vaccination for girls and the 2019 extension to boys. Between 2016 and 2025, there was a 94% decrease in diagnoses in females in this age group and an 85% decrease in males.
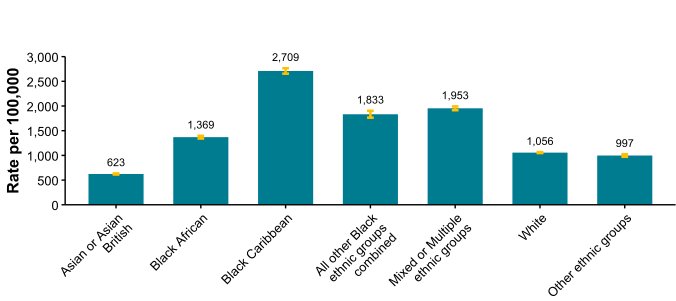
The White ethnic group had the highest number of STI diagnoses in 2025: 49,962 (51% of all diagnoses). Although only 10% of diagnoses were among the Black Caribbean ethnic group, this group had the highest rate: 2,709 per 100,000 (2.6 times the rate seen in the White ethnic group). Where country of birth was known, 52% of the London population diagnosed with an STI in 2025 were UK-born. The rate of STI diagnoses among people who live in the most deprived areas of London (1,381 per 100,000) was over 3 times as high as in the least deprived areas (427 per 100,000), although these areas tend to have higher proportions of young people, who also have higher STI rates.
Prevention messages
Prevention messages include:
Sexual health clinics are free, confidential and available to everyone. They provide testing, post-exposure prophylaxis and treatment for STIs and HIV, as well as vaccination and contraception.
Using condoms consistently and correctly with new or casual partners protects against HIV and other STIs.
Testing is recommended if you have had sex without a condom with a new or casual partner in the last 3 months, or if a partner has tested positive for an STI. In addition:
- women and other people with a womb aged under 25 who are sexually active should have a chlamydia test after sex with a new partner or annually
- gay and bisexual men with new or casual partners should test for HIV and STIs annually or every 3 months if having sex without condoms with new or casual partners
Prevention medications (known as pre and post-exposure prophylaxis) can prevent HIV and some STIs:
- doxycycline post-exposure prophylaxis (doxyPEP) is recommended to people at risk of syphilis to reduce their chance of infection. DoxyPEP is available at specialist sexual health clinics
- HIV pre-exposure prophylaxis (PrEP) reduces an individual’s risk of getting HIV. PrEP is available from specialist sexual health clinics
- HIV post-exposure prophylaxis (PEP) can be taken after sex to reduce the risk of getting HIV. PEP is available for free from most sexual health clinics and most emergency departments
Vaccination can prevent some STIs and blood-borne viruses:
- gay and bisexual men can get the hepatitis A and hepatitis B vaccines from specialist sexual health clinics. These vaccines are also available for other people with a higher risk of exposure to these viruses
- gay and bisexual men aged 45 years and younger can get the human papillomavirus (HPV) vaccine from specialist sexual health clinics. This protects against genital warts and some forms of cancer
- gay and bisexual men who have a recently had multiple sexual partners or an STI and other people at higher risk are eligible for a meningococcal B disease vaccine (4CMenB) which can protect against gonorrhoea
- mpox vaccination is available for people at increased risk, including gay and bisexual men who have recently had multiple sexual partners
- hepatitis B and HPV vaccines are also part of the routine childhood vaccination program. Catch-up vaccines are available for people who missed them at school
STIs in London
Overview
Figure 1. New STI diagnosis rates by UKHSA region of residence, England, 2025
Data sources: GUMCAD, CTAD, ONS Census 2021 mid-year estimates.
Figure 1 is a column chart which shows the rate of new diagnoses of STIs by region for 2025. This rate is per 100,000 and is not adjusted.
This chart shows that the new STI diagnosis rate is highest in London (1,206 per 100,000) in comparison to other regions in England. This rate is more than twice that of the region with the next highest rate, the North West.
Figure 2. Number of diagnoses of the 5 main STIs (London, 2016 to 2025): A) all 5 STIs, B) excluding chlamydia (expanded scale) [note 1]
Data sources: GUMCAD, CTAD.
Note 1: it is important to consider whether there have been any changes to testing practices when interpreting increases or decreases in chlamydia.
Figure 2A is a line chart which shows the trend in the number of new diagnoses of the 5 main STIs (chlamydia, gonorrhoea, genital warts, genital herpes and syphilis) in London residents between 2016 and 2025. Figure 2B similar but excludes chlamydia so that the trends for the 4 other STIs can be seen more clearly.
Figure 2A shows that in 2025, chlamydia was the most commonly diagnosed STI (39,613) in London residents, followed by gonorrhoea (29,379) and genital herpes (8,011). The number of new diagnoses of genital herpes in London overtook the number of new diagnoses of genital warts as the third most commonly diagnosed STI in London in 2025.
Between 2024 and 2025, the number of new diagnoses of chlamydia, gonorrhoea, genital warts and syphilis declined in London residents. The exception to this trend was genital herpes, as the number of new diagnoses increased between 2024 and 2025.
Table 1. Percentage change in new STI diagnoses, London [note 2]
| Diagnosis | 2019 | 2024 | 2025 | Percentage change 2019 to 2025 | Percentage change 2024 to 2025 |
|---|---|---|---|---|---|
| Chlamydia | 65,478 | 47,114 | 39,613 | -40% | -16% |
| Genital herpes | 9,142 | 7,589 | 8,011 | -12% | +6% |
| Genital warts | 12,107 | 6,914 | 6,464 | -47% | -7% |
| Gonorrhoea | 32,631 | 32,782 | 29,379 | -10% | -10% |
| Syphilis | 3,875 | 4,125 | 3,482 | -10% | -16% |
| Other | 27,499 | 23,977 | 22,647 | -18% | -6% |
| All new STIs | 150,732 | 122,501 | 109,596 | -27% | -11% |
Data sources: GUMCAD, CTAD.
Note 2: it is important to consider whether there have been any changes to testing practices when interpreting increases or decreases in chlamydia.
See the New STIs section for a list of diagnoses that are included in the other STIs.
Table 1 shows the percentage change in the number of new diagnoses of STIs between 2019 and 2025, and between 2024 and 2025 in London residents. This table is particularly useful for the STIs with fewer diagnoses, such as syphilis, where changes can be difficult to see on Figure 2.
In 2025, chlamydia was the most commonly diagnosed STI in London residents (39,613), followed by gonorrhoea (29,379) and ‘other STIs’ (22,647). There was a decline of 27% in the number of new diagnoses of all new STIs between 2019 and 2025. This decline continued between 2024 and 2025 with a 11% decline. Chlamydia had the greatest percentage reduction between 2019 and 2025, with the number of new diagnoses declining 40% in London residents during this period. Genital herpes was the only STI that increased (6%) between 2024 and 2025.
Figure 3. Rates of new STIs per 100,000 by age group (for those aged 15 to 64 years only) and gender, London, 2025
Data sources: GUMCAD, CTAD, ONS Census 2021 mid-year estimates.
Figure 3 is a pyramid chart which shows the rate of diagnosis of new STIs by age group and gender in 2025. Rates are per 100,000 population in each age group for each gender and for Londoners aged 15 to 64. Gender was reported for 95% of London residents diagnosed with a new STI in 2025 and age at diagnosis was reported for almost 100%.
In 2025, males aged between 25 and 34 had the highest rate of diagnosis of new STIs amongst Londoners. In females, the highest rates of new STIs were in 20 to 24 year olds in 2025. Amongst almost all age groups, the graph is skewed towards the left side. This indicates that there is a higher rate of new diagnoses of STIs in males in these age groups. The exception is in the population aged 15 to 19, where there is a higher rate in females. This is likely due to higher rates of chlamydia diagnoses. The National Chlamydia Screening Programme specifically targets this group of the population (1), which explains the higher rates of new STI diagnoses in the population.
In both males and females, this chart demonstrates that the incidence of STIs is highest in the younger population in London. The shape demonstrated by the chart is largely driven by the rate of new diagnoses of chlamydia, as this remains the most commonly diagnosed STI.
Figure 4. Rates of new STIs per 100,000 by ethnic group, London, 2025
Data sources: GUMCAD, CTAD, ONS Census 2021.
Figure 4 is a column chart which shows the rate of new STIs amongst Londoners by ethnic group in 2025. The number of new STI diagnoses are shown as a rate per 100,000 in each different ethnic group. This takes into account the underlying size of the population. Ethnic group was reported for 90% of London residents diagnosed with a new STI in 2025.
Ethnic group is not a proxy for country or world region of birth, it is a complex concept and is self-identified and reported within the limitations of the available options provided. It may incorporate cultural, religious and linguistic differences as well as differences in physical attributes and world region of origin. People may identify their ethnic group differently in different contexts or over time.
Rates are for all ages and age distributions will differ by ethnic group. The White ethnic group has the oldest age distribution, which will depress its rate as numbers of STI diagnoses in the oldest age groups are lower. Other important determinants, such as deprivation and issues of stigma, also vary by ethnic group. Charts and tables by ethnic group should always be interpreted in the wider context of determinants and never in isolation.
The highest rate of new STIs was in people who reported their ethnicity as Black Caribbean (2,709 per 100,000), followed by people who reported their ethnicity as Mixed or Multiple ethnic groups (1,953 per 100,000). The lowest rate of new STIs in 2025 was in people who reported their ethnicity as Asian or Asian British (623 per 100,000).
Table 2. Percentage of new STI diagnoses by ethnic group, London, 2025
| Ethnic group | Number | Percentage (excluding unknown) |
|---|---|---|
| Asian or Asian British | 11,331 | 12% |
| Black African | 9,545 | 10% |
| Black Caribbean | 9,358 | 10% |
| All other Black ethnic groups combined | 2,674 | 3% |
| Mixed or Multiple ethnic groups | 9,880 | 10% |
| White | 49,962 | 51% |
| Other ethnic groups | 5,552 | 6% |
| Unknown | 11,294 |
Data sources: GUMCAD, CTAD and ONS Census 2021.
Table 2 provides a breakdown of the percentage of new STIs by ethnic group for 2025. This table displays crude numbers as opposed to rates, which are seen in Figure 4, as well as a separate column which provides the percentage of new STI diagnoses (excluding unknown) by ethnic group.
Over half of new STI diagnoses were made in people who reported their ethnic group as White (51%). Figure 4 showed that the highest rate of new STIs was in people who reported their ethnic background as Black Caribbean (2,709 per 100,000). The number of new diagnoses of STIs in people who reported their ethnicity as Black Caribbean however only makes up 10% of the total number of new STI diagnosis in London in 2025.
A significant proportion of the number of new diagnoses of STIs made in London in 2025 were in people whose ethnic group is unknown. This represents a significant gap in the data and may mask need in certain groups.
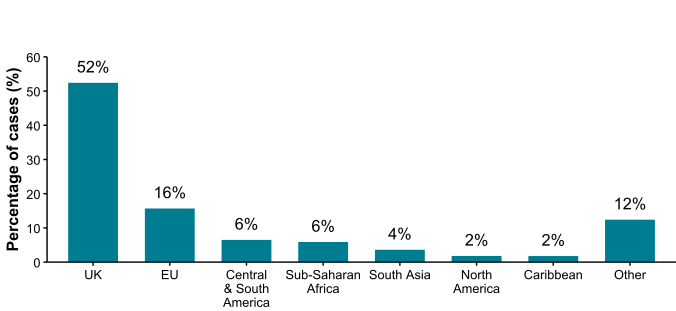
Figure 5. Percentage of new STI diagnoses by world region of birth [note 3], London, 2025
Data sources: GUMCAD data only.
Note 3: data on country of birth is not collected by CTAD. All information about world region of birth is based on diagnoses made in specialist and non-specialist services which report to GUMCAD.
Figure 5 is a column chart which shows the proportion of new STIs diagnosed in London residents by world region of birth in 2025. This chart is based on diagnoses that are reported through GUMCAD (excludes STIs reported through CTAD). World region of birth refers to the region in which a person was born and differs from ethnic group. The categories that are used to present this data have changed since 2024 which makes direct comparisons between 2024 and 2025 figures difficult. World region of birth was reported for 70% of London residents diagnosed with a new STI in 2025.
The majority of new STIs in London in 2025 (52%) were in people who were born in the UK. 16% of new STI diagnoses were in people who were born in the EU. It should be noted when interpreting this data that migrants are more likely to be of working age, and so more likely to be diagnosed with an STI than older adults.
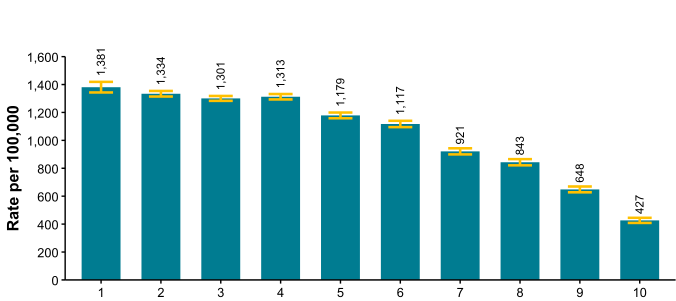
Figure 6. Rates of new STIs per 100,000 by decile of deprivation [note 4], London, 2025
Data sources: GUMCAD, CTAD, ONS Index of Multiple Deprivation and Census 2021 mid-year estimates.
Note 4: deciles run from 1 to 10 in order of decreasing deprivation, with 1 being the decile for the most deprived area. Deprivation is based on 2021 LSOAs, which is available for 96% of GUMCAD data reported in 2025.
Figure 6 is a column chart which shows the diagnosis rate by 100,000 population for each deprivation decile in 2025. These deciles run from 1 to 10 in descending levels of deprivation, with 1 being the people living in the 10% most deprived areas of London. The Index of Multiple Deprivation (IMD) includes several metrics to provide an overall ranking of deprivation and is not adjusted for differences in the demographics of the underlying population, such as age (2). IMD includes 7 domains: education, employment, housing, health, crime, income and living environment
The first bar on the bar chart refers to the population living in the 10% most deprived LSOAs in London, whilst the tenth refers to the population living in the least deprived 10% of LSOAs. This bar chart shows that as deprivation increases, the rate of diagnosis of new STIs increases. The highest rate of diagnosis of new STIs are found in people living in the most deprived areas. It should be noted that the confidence intervals between deciles 1 and 4 overlap, demonstrating no significant difference in the rate of new diagnoses between decile 1 and 4. Nevertheless, the rate of decile 1 (1,381 per 100,000) is significantly higher than the rate of decile 10 (427 per 100,000).
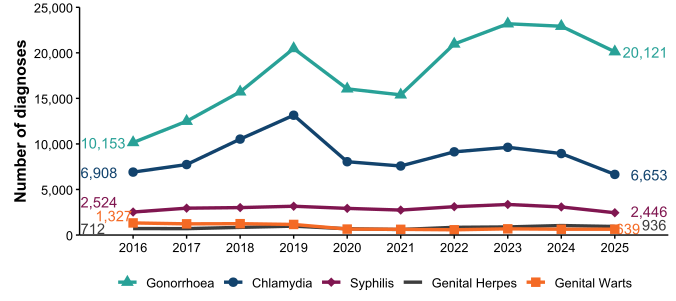
Figure 7. Diagnoses of the 5 main STIs among gay and bisexual men [note 5], London, 2016 to 2025
Data source: GUMCAD data only.
Note 5: data on sexual orientation is not collected by CTAD. All information about gay and bisexual men is based on diagnoses made in specialist and non-specialist services which report to GUMCAD and exclude chlamydia diagnoses via online services.
Figure 7 is a line chart which shows the trend in the number of new diagnoses of the main STIs in London among gay and bisexual men from 2016 to 2025. Sexual orientation was reported for 82% of male London residents diagnosed with a new STI in 2025 and 82% of male London residents diagnosed over the 10-year period.
In 2025, gonorrhoea was the most commonly diagnosed STI in gay and bisexual men in London (20,121 per 100,000), followed by chlamydia (6,653 per 100,000), syphilis (2,446 per 100,000), genital herpes (936 per 100,000) and genital warts (639 per 100,000). This differs from the most commonly diagnosed STI in the total population for 2025 which was chlamydia.
Table 3. Percentage change in new STI diagnoses among gay and bisexual men [note 6], London
| Diagnosis | 2019 | 2024 | 2025 | Percentage change 2019 to 2025 | Percentage change 2024 to 2025 |
|---|---|---|---|---|---|
| Chlamydia | 13,150 | 8,942 | 6,653 | -49% | -26% |
| Genital herpes | 975 | 1,040 | 936 | -4% | -10% |
| Genital warts | 1,160 | 636 | 639 | -45% | <0.5% change |
| Gonorrhoea | 20,478 | 22,921 | 20,121 | -2% | -12% |
| Syphilis | 3,159 | 3,081 | 2,446 | -23% | -21% |
| Other | 4,844 | 5,120 | 4,428 | -9% | -14% |
| All new STIs | 43,766 | 41,740 | 35,223 | -20% | -16% |
Data source: GUMCAD data only.
Note 6: data on sexual orientation is not collected by CTAD. All information about gay and bisexual men is based on diagnoses made in specialist and non-specialist services which report to GUMCAD and exclude chlamydia diagnoses via online services.
See the New STIs section for a list of diagnoses that are included in the other STIs.
Table 3 shows the percentage change in the number of new diagnoses of each of the 5 main STIs among gay and bisexual men between 2019 and 2025, and between 2024 and 2025.
Between 2019 and 2025, the number of new diagnoses of all STIs declined in gay and bisexual men by 20%. A high proportion of this decline has occurred in the last year, with the number of new diagnoses of STIs declining by 16% between 2024 and 2025. The decline in the number of new STIs between 2019 and 2025 has largely been driven by a decline in the number of chlamydia diagnoses reported, with a decline of 49% between 2019 and 2025. Following increased numbers of new diagnoses in 2023 and 2024, diagnoses of gonorrhoea in gay and bisexual men declined between 2024 and 2025 by 12%. Diagnoses of syphilis also saw a significant drop in the number of new diagnoses between 2024 and 2025, with a reduction of 21%.
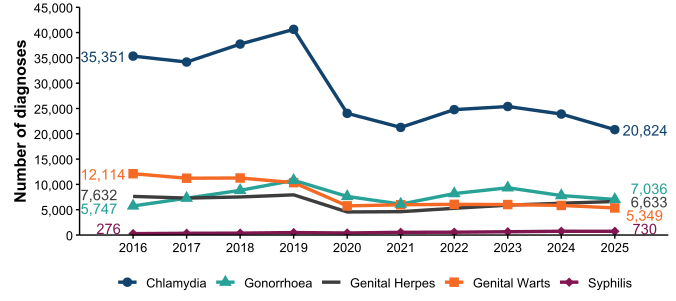
Figure 8. Diagnoses of the 5 main STIs among heterosexual men and all women [note 7], London, 2016 to 2025
Data source: GUMCAD data only.
Note 7: data on sexual orientation is not collected by CTAD. All information here is based on diagnoses made in specialist and non-specialist services which report to GUMCAD and exclude chlamydia diagnoses via online services. Diagnoses are defined here as GUMCAD records where gender is specified as male and sexual orientation is specified as heterosexual, or gender was specified as female, or gender was not specified but orientation was specified as heterosexual. GUMCAD records where sexual orientation was not specified for males or unknown gender individuals are excluded.
Figure 8 is a line chart which shows the number of new diagnoses of each STI among women and heterosexual men in London between 2016 and 2025.
The chart shows that for 2025, chlamydia is the most commonly diagnosed STI in women and heterosexual men (20,824 diagnoses) followed by gonorrhoea (7,036 diagnoses) genital herpes (6,633 diagnoses), genital warts (5,349 diagnoses) and syphilis (730 diagnoses).
Table 4. Percentage change in new STI diagnoses among heterosexual men and all women [note 8], London
| Diagnosis | 2019 | 2024 | 2025 | Percentage change 2019 to 2025 | Percentage change 2024 to 2025 |
|---|---|---|---|---|---|
| Chlamydia | 40,640 | 23,905 | 20,824 | -49% | -13% |
| Genital herpes | 7,938 | 6,278 | 6,633 | -16% | 6% |
| Genital warts | 10,353 | 5,847 | 5,349 | -48% | -9% |
| Gonorrhoea | 10,808 | 7,797 | 7,036 | -35% | -10% |
| Syphilis | 484 | 744 | 730 | 51% | -2% |
| Other | 21,572 | 17,816 | 16,986 | -21% | -5% |
| All new STIs | 91,795 | 62,387 | 57,558 | -37% | -8% |
Data source: GUMCAD data only.
Note 8: data on sexual orientation is not collected by CTAD. All information here is based on diagnoses made in specialist and non-specialist services which report to GUMCAD and exclude chlamydia diagnoses via online services. Diagnoses are defined here as GUMCAD records where gender is specified as male and sexual orientation is specified as heterosexual, or gender was specified as female, or gender was not specified but orientation was specified as heterosexual. GUMCAD records where sexual orientation was not specified for males or unknown gender individuals are excluded.
See the New STIs section for a list of diagnoses that are included in the other STIs.
Table 4 summarises what is shown in Figure 8 and demonstrates the percentage change in the number of new STIs diagnosed in women and heterosexual men between 2019 and 2025, and separately between 2024 and 2025.
From 2019 to 2025, the number of all new STIs diagnosed in women and heterosexual men in London declined by 37%. The decline in the number of all new STIs diagnosed in Londoners has continued between 2024 and 2025, with an 8% decline during this period. Among women and heterosexual men, syphilis is the only STI to have seen an increase between 2019 and 2025 (51% increase). The overall crude number of new diagnoses of syphilis is small, meaning that the percentage change is sensitive to any small change in the numbers.
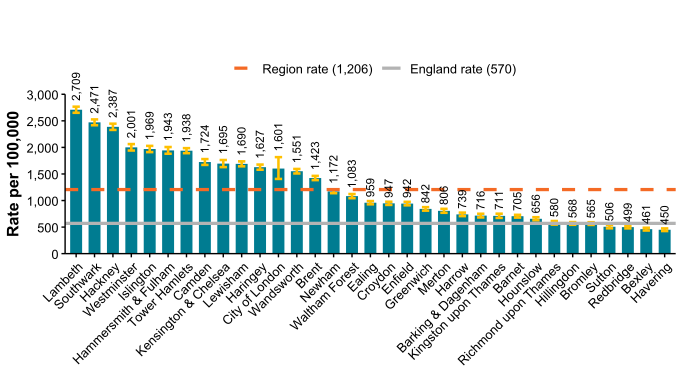
Figure 9. Rate of new STI diagnoses per 100,000 by local authority, London, 2025
Data sources: GUMCAD, CTAD, ONS Census 2021 mid-year estimates.
Figure 9 is a column chart which shows the breakdown of new diagnoses of STIs by local authority (of residence) in London for 2025. Local authorities are shown in descending order, with the local authority with the highest rate of new STIs on the left of the chart. Confidence intervals are shown by the yellow brackets on each bar. The rate for the whole of London (1,206 per 100,000) is shown by the dashed orange line, and the England rate is shown by a solid grey line (570 per 100,000).
Similarly to 2024, the local authority with the highest rate of new STI diagnoses in 2025 was Lambeth (2,709 per 100,000). This has declined from the rate of 3,257 per 100,000 in 2024. As in 2024, the local authority with the lowest rate of STIs was Havering (450 per 100,000). This chart highlights a pattern of higher rates in local authorities located in inner London in comparison to the those in outer London. This is partly due to differences in the demographics between inner and outer London populations. The vast majority (27 of 33) of the local authorities in London have a higher rate of new diagnoses of STIs per 100,000 than the England rate.
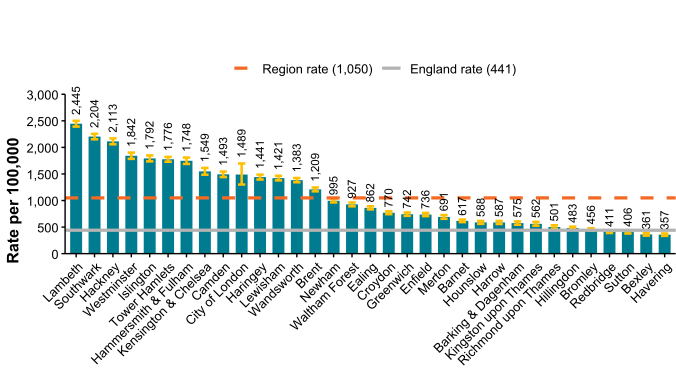
Figure 10. Rate of new STI diagnoses (excluding chlamydia diagnoses among people aged under 25 years) [note 9] per 100,000 by local authority, London, 2025
Data sources: GUMCAD, CTAD, ONS Census 2021 mid-year estimates.
Note 9: chlamydia diagnoses in the target group for the National Chlamydia Screening Programme (those aged 15 to 24 years) are excluded as these diagnoses may reflect local implementation of screening.
Figure 10 is a column chart which shows the new STI diagnosis rate by local authority for 2025, excluding new diagnoses of chlamydia in the under 25 population. The dashed orange line shows the rate for London (1,050 per 100,000) and the solid grey line is the national rate (441 per 100,000).
This chart excludes diagnoses of chlamydia in people aged under 25. People aged between 15 and 24 are specifically targeted by the National Chlamydia Screening Programme (1), which aims to promote chlamydia screening in this population to prevent asymptomatic infection and transmission.
Similarly to Figure 9, the local authorities with the highest new STI diagnosis rates, excluding diagnoses of chlamydia in under 25s, for 2025, were Lambeth (2,445 per 100,000), Southwark (2,204 per 100,000) and Hackney (2,113 per 100,000). The majority of local authorities in London have a higher new STI diagnosis rate (excluding chlamydia in under 25s) than the national rate in England.
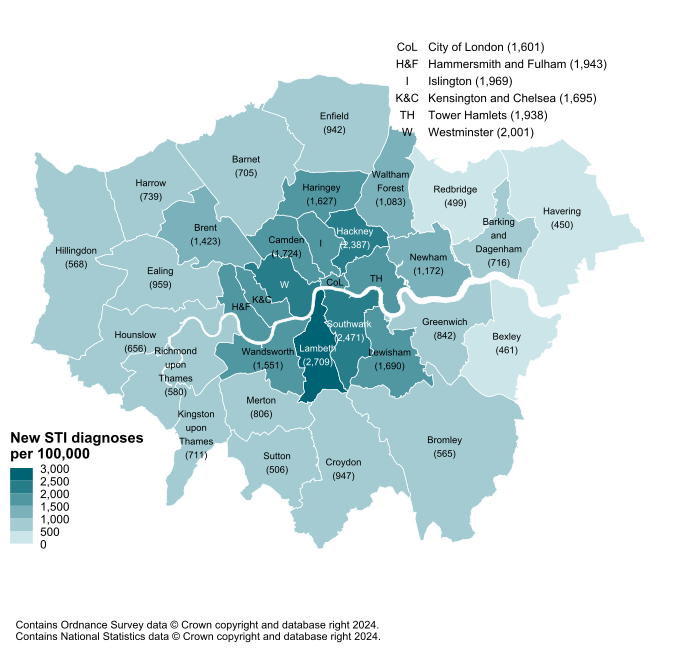
Figure 11. Map of new STI rates per 100,000 by local authority, London, 2025
Data sources: GUMCAD, CTAD, ONS Census 2021 mid-year estimates.
Figure 11 is a map which shows the new STI diagnosis rate for each local authority. Local authorities with higher new STI diagnosis rates are shaded in a darker colour on the map.
This figure shows that new STI diagnosis rates are higher in local authorities in inner London. This likely is contributed to by the underlying demographics of these areas, as they are areas with a younger, more diverse population.
New STI diagnosis rates are lower in local authorities in outer London. The lowest new STI diagnosis rates for 2025 were in Havering (450 per 100,000), Bexley (461 per 100,000) and Redbridge (499 per 100,000), which are all local authorities located in outer London.
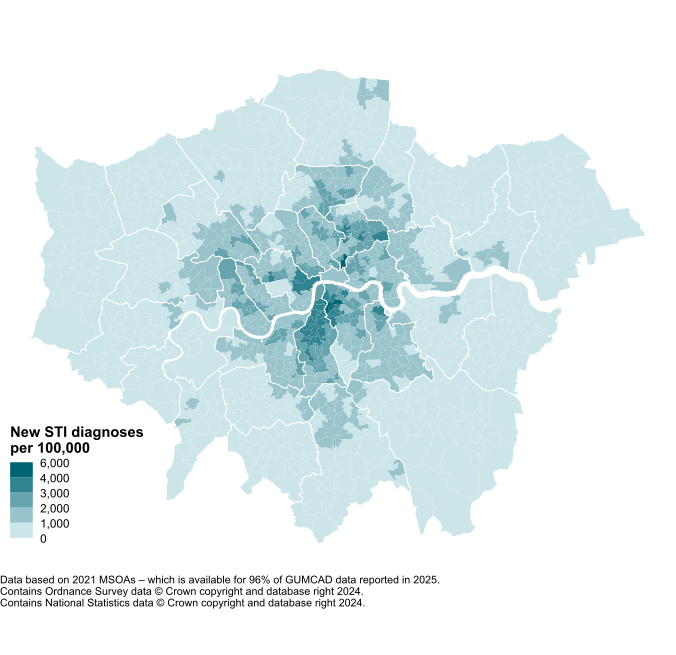
Figure 12. Map of new STI rates per 100,000 by middle super output area (MSOA21), London, 2025
Data sources: GUMCAD, CTAD, ONS Census 2021 mid-year estimates.
Figure 12 is a map of new STIs per 100,000 by middle super output area for 2025. This map shows higher rates of new STIs in areas in inner London, with lower rates of STIs in outer London. This likely reflects the differences in demographics between populations resident in the different areas of London, with younger more diverse populations typically seen in inner London in comparison to outer London.
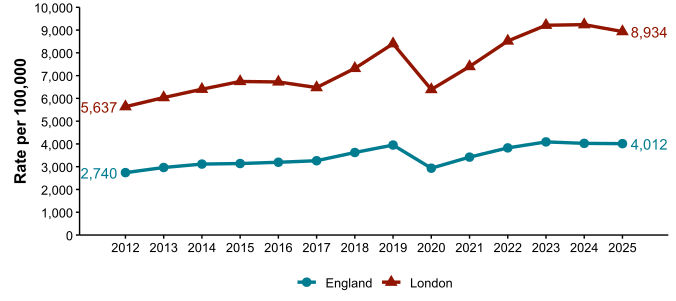
Figure 13. STI testing rate (excluding chlamydia in under-25 year olds) [note 10] per 100,000, London, 2012 to 2025
Data sources: GUMCAD, CTAD, ONS Census 2021 mid-year estimates.
Note 10: chlamydia diagnoses in the target group for the National Chlamydia Screening Programme (those aged 15 to 24 years) are excluded as these diagnoses may reflect local implementation of screening.
Figure 13 is a line chart which shows the STI testing rate per 100,000, excluding tests conducted for chlamydia in people aged under 25, from 2012 to 2025. The red line shows the testing rate in London, and the blue line shows the testing rate in England.
This figure shows that the STI testing rate in London (excluding tests for chlamydia conducted in under 25s) has in all recent years been consistently higher than the STI testing rate nationally. The STI testing rate for London in 2025 was 8,934 per 100,000. This is more than double the STI testing rate for England for 2025 (4,012 per 100,000). The STI testing rate for London (and England) has declined slightly year on year since 2023.
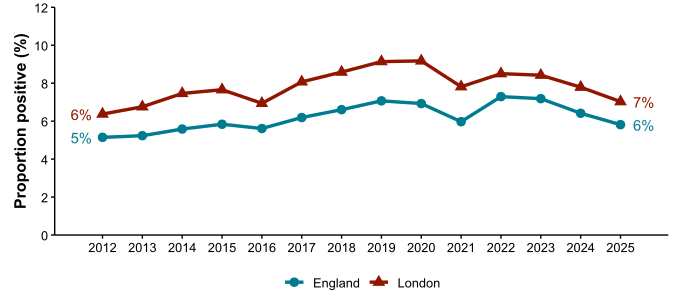
Figure 14. STI testing positivity rate (excluding chlamydia in under-25 year olds) [note 11], London, 2012 to 2025
Data sources: GUMCAD, CTAD.
Note 11: chlamydia diagnoses in the target group for the National Chlamydia Screening Programme (those aged 15 to 24 years) are excluded as these diagnoses may reflect local implementation of screening.
Figure 14 is a line chart which shows the proportion of STI test results which are positive, for both England and London, from 2012 to 2025. The red line shows positivity for London and the blue line England.
The figure shows that the proportion of STI test results that return as positive is higher in London (7%) than in England (6%). This has been the case every year since 2012. The proportion of tests that are positive has declined year on year in London since 2022 after rising from 2012 to 2020.
Table 5. Number of diagnoses of new STIs by UKHSA region of residence, data source and Sexual Health Service Type, 2025
| UKHSA region of residence | GUMCAD: specialist SHSs |
GUMCAD: non-specialist SHSs [note 12] |
CTAD | Total |
|---|---|---|---|---|
| East Midlands | 13,724 (61%) |
4,076 (18%) |
4,711 (21%) |
22,511 |
| East of England | 17,420 (68%) |
2,042 (8%) |
6,139 (24%) |
25,601 |
| London | 79,241 (72%) |
10,529 (10%) |
19,826 (18%) |
109,596 |
| North East | 9,111 (70%) |
1,703 (13%) |
2,264 (17%) |
13,078 |
| North West | 31,340 (77%) |
4,738 (12%) |
4,816 (12%) |
40,894 |
| South East | 28,757 (75%) |
1,649 (4%) |
7,914 (21%) |
38,320 |
| South West | 14,333 (64%) |
3,777 (17%) |
4,360 (19%) |
22,470 |
| West Midlands | 20,450 (74%) |
4,133 (15%) |
2,877 (10%) |
27,460 |
| Yorkshire and Humber | 18,720 (72%) |
1,636 (6%) |
5,467 (21%) |
25,823 |
Data sources: GUMCAD, CTAD.
Note 12: diagnoses from enhanced GPs reporting to GUMCAD are included in the ‘Non-specialist sexual health services (SHSs)’ total.
Table 5 is a summary of the number of new STI diagnoses for each UKHSA region of residence in 2025 and is broken down by the reporting surveillance system. In addition, GUMCAD data is broken down by the location in which the test was performed ie, whether this was a specialist or a non-specialist sexual health service. These figures are crude numbers and are not adjusted for any differences in the underlying demographics of the population.
The number of new STIs diagnosed in London residents is double that of the second next highest region, the North West. The majority (72%) of the new diagnoses of STIs were diagnosed in specialised sexual health services. 18% of the new diagnoses of STIs were reported through the CTAD system. The CTAD system reports diagnoses of chlamydia which are identified from services such as chlamydia tests available to order online and general practice.
Table 6. Number of diagnoses of the 5 main STIs by data source and Sexual Health Service type, London, 2025
| STI | GUMCAD: specialist SHSs | GUMCAD: non-specialist SHSs [note 13] | CTAD | Total |
|---|---|---|---|---|
| Chlamydia | 19,441 (49%) |
346 (1%) |
19,826 (50%) |
39,613 |
| Genital herpes | 7,684 (96%) |
327 (4%) |
8,011 | |
| Genital warts | 6,176 (96%) |
288 (4%) |
6,464 | |
| Gonorrhoea | 20,364 (69%) |
9,015 (31%) |
29,379 | |
| Syphilis | 3,449 (99%) |
33 (1%) |
3,482 |
Data sources: GUMCAD, CTAD.
Note 13: diagnoses from enhanced GPs reporting to GUMCAD are included in the ‘Non-specialist sexual health services (SHSs)’ total.
Table 6 provides a summary of the number of diagnoses of the main STIs in London for 2025 and this is broken down by surveillance system.
Gonorrhoea is the most commonly detected STI in specialist sexual health services, with 20,364 cases diagnosed in specialist sexual health services in 2025. The majority of cases of chlamydia are diagnosed through the CTAD system. CTAD is a surveillance system which reports chlamydia only. More than half of the positive chlamydia tests that were received were reported through CTAD.
The vast majority of diagnoses of genital herpes (96%), genital warts (96%) and syphilis (99%) were diagnosed through specialist sexual health services in 2025.
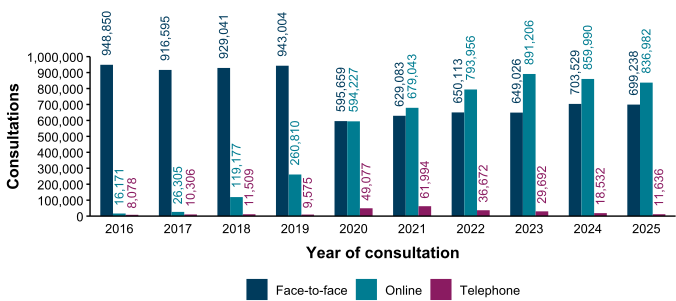
Figure 15. Consultations by service medium, London, 2016 to 2025
Data sources: GUMCAD, NHS Fingertips.
Figure 15 is a column chart which shows the number of consultations each year in London from 2016 to 2025, broken down by the medium of consultation.
Between 2016 and 2025, there has been considerable change in the medium of consultation in London. In 2016, face-to-face consultations were the predominant medium with over 900,000 consultations. Face-to-face consultations have declined between 2016 and 2025, from approximately 940,000 to approximately 700,000, which is likely due to the rise in access through digital services. In 2025 the most common medium of consultation was online consultation (840,000), representing a shift towards increasing digital access to sexual health services in London. These trends suggest that digital services may have widened access to sexual health services in London as the combined number is significantly higher than pre-2020.
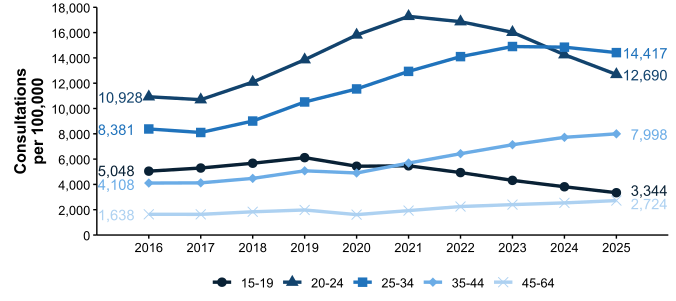
Figure 16. All consultations by age group, London, 2016 to 2025
Data sources: GUMCAD, NHS Fingertips.
Figure 16 is a line chart which shows the rate of consultations per 100,000 in each year since 2016, with each line showing a different age group.
In 2025, the highest rate of consultations was in people aged 25 to 34 (14,417 per 100,000). This was followed by people aged 20 to 24 (12,690 per 100,000), 35 to 44 (7,998 per 100,000) and 15 to 19 (3,344 per 100,000). People aged 45 to 64 had the lowest rate of consultation (2,724 per 100,000).
In 2025, the rate of consultations in people aged 25 to 34 (14,417 per 100,000) was greater than the rate of consultations in people aged 20 to 24 (12,690 per 100,000). This is a change in pattern that has emerged since 2024. This represents a shifting pattern, with people aged 25 to 34 now more likely to access sexual health services than younger populations. Rates of consultations amongst both people aged 20 to 24 and 15 to 19 in London has declined in recent years, signifying a declining rate in accessing sexual health services amongst these populations. Rates of consultations have increased in older populations aged 35 to 44 and 45 to 64 over recent years.
Chlamydia
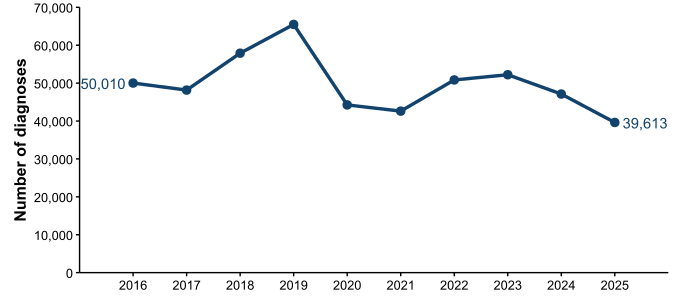
Figure 17. Number of chlamydia diagnoses, London, 2016 to 2025
Data sources: GUMCAD, CTAD.
It is important to consider whether there have been any changes to testing practices when interpreting increases or decreases in chlamydia.
Figure 17 is a line chart which shows the number of new chlamydia diagnoses in London residents between 2016 and 2025.
Chlamydia, caused by the bacteria Chlamydia trachomatis, is the most commonly diagnosed STI in England (1). Chlamydia can often present without symptoms, increasing the likelihood of transmission. Long-term complications of untreated chlamydia can include chronic pelvic inflammatory disease in females and issues with fertility. The National Chlamydia Screening Programme promotes screening for chlamydia to ensure that it is detected and treated. The focus of this screening programme is females aged under 25. This is because this group of the population are most at risk of long-term complications of untreated chlamydia.
The number of new chlamydia diagnoses in London was 39,613 for 2025. Since 2023, the number of new diagnoses of chlamydia has declined each year.
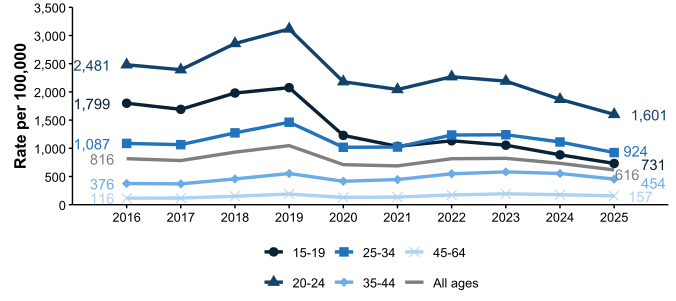
Figure 18. Rates of chlamydia per 100,000 by age group (for those aged 15 to 64 years only), London, 2016 to 2025
Data sources: GUMCAD, CTAD, ONS Census 2021 mid-year estimates.
Figure 18 is a line chart which shows the differences in the rate of new chlamydia diagnoses in Londoners between 2016 and 2025, with each line representing a different age group. Age at diagnosis was reported for 99% of Londoners diagnosed over the 10-year period.
For 2025, the highest rate of new diagnoses of chlamydia was in people aged 20 to 24 (1,601 per 100,000). The second highest rate was in people aged 25 to 34 (924 per 100,000) followed by those aged 15 to 19 (731 per 100,000) and aged 35 to 44 (454 per 100,000). The lowest rate of new chlamydia diagnoses was in 45 to 64 year olds (157 per 100,000)
Across all age groups, there was a decrease in the rate of new chlamydia diagnoses between 2024 and 2025 and in the youngest age groups since 2022, however this is in the face of reducing consultations in these age groups.
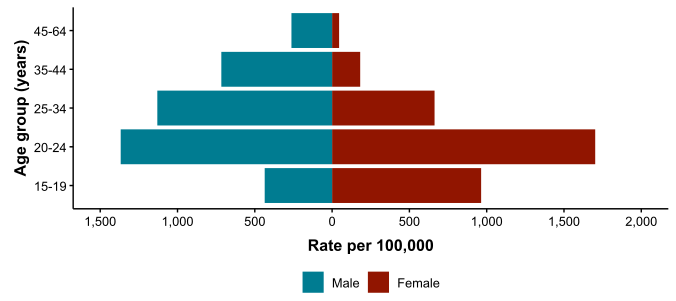
Figure 19. Rates of chlamydia per 100,000 by age group (for those aged 15 to 64 years only) and gender, London, 2025
Data sources: GUMCAD, CTAD, ONS Census 2021 mid-year estimates.
Figure 19 is a pyramid chart which shows the rate of new chlamydia diagnoses by age group and gender. This graph does not include people aged 65 and over or younger than 15 due to sensitivities around the data. Gender was reported for 96% of Londoners diagnosed with chlamydia in 2025.
In the younger population aged between 15 and 19 and between 20 and 24, the graph is skewed to the right, showing a higher rate of new diagnoses in females. This is a result of the National Chlamydia Screening Programme (1), which targets chlamydia screening for females aged under 25 to ensure rapid treatment can be given and minimise the possibility of asymptomatic chlamydia infection causing long-term implications.
Among the older populations aged 25 to 64, the chart is skewed towards males. This indicates a higher rate of diagnosis of chlamydia in the older male populations in comparison to females.
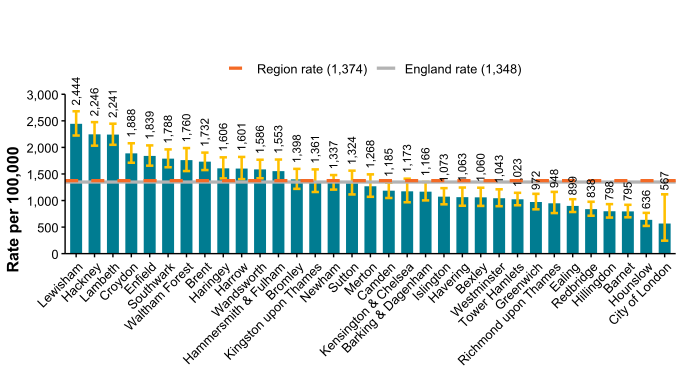
Figure 20. Chlamydia detection rate per 100,000, females aged 15 to 24 years by local authority of residence, London, 2025
Data sources: GUMCAD, CTAD, ONS Census 2021 mid-year estimates.
Figure 20 is a column chart which shows the rate of new chlamydia diagnoses in females aged between 15 and 24, broken down by local authority for 2025. The dashed orange line is the rate for London, and the solid grey line is the rate for England.
UKHSA recommends that local areas should be working towards achieving a chlamydia detection rate no lower than 3,250 per 100,000 female population aged 15 to 24 years. The detection rate is a measure of chlamydia control activity, aimed at reducing the incidence of reproductive sequelae of chlamydia infection and interrupting transmission. An increased detection rate is indicative of increased control activity, it is not a measure of morbidity. The chlamydia detection rate is an indicator in the Public Health Outcomes Framework.
Females aged 15 to 24 are presented in this figure as this is the population that are targeted under the National Chlamydia Screening Programme (1). The detection rate in all areas was significantly lower than the target. The highest rate of chlamydia detection amongst this population for 2025 was in Lewisham (2,444 per 100,000), followed by Hackney (2,246 per 100,000) and Lambeth (2,241 per 100,000). The lowest rates were in City of London (567 per 100,000) and Hounslow (636 per 100,000).
Gonorrhoea
Figure 21. Number of gonorrhoea diagnoses, London, 2016 to 2025
Data source: GUMCAD.
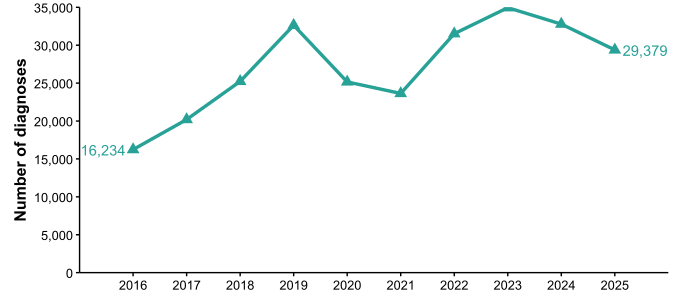
Figure 21 is a line chart which shows the number of new gonorrhoea diagnoses in London between 2016 and 2025.
Gonorrhoea is a sexually transmitted infection caused by the bacterium Neisseria gonorrhoea (3). It is often transmitted through unprotected sex and is not always associated with symptoms but may lead to issues with fertility, and in females, chronic pelvic inflammatory disease (3, 4).
In 2025, the number of new gonorrhoea diagnoses in Londoners was 29,379. The number of diagnoses declined between 2019 and 2021, which is likely because of the COVID-19 pandemic, before increasing to a peak in 2023. Since 2023, the number of new gonorrhoea diagnoses has declined each year.
Figure 22. Rates of gonorrhoea per 100,000 by age group (for those aged 15 to 64 years only), London, 2016 to 2025
Data sources: GUMCAD, ONS Census 2021 mid-year estimates.
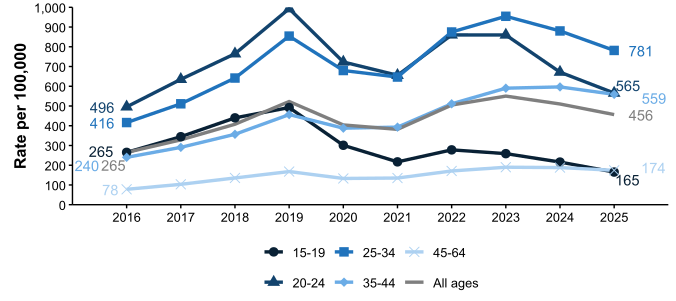
Figure 22 is a line chart which shows the rate of new gonorrhoea diagnoses in each year between 2016 and 2025, broken down by age group. Age at diagnosis was reported for almost all Londoners diagnosed with gonorrhoea over the 10-year period.
In 2025, the highest rate of new gonorrhoea diagnoses in Londoners was in 25 to 34 year olds (781 per 100,000) This reflects similar patterns across all STIs in London, with the highest rate of new STIs in 25 to 34 year olds. The second highest rate of diagnoses was in 20 to 24 year olds (565 per 100,000), followed by 35 to 44 year olds (559 per 100,000). The lowest rates of diagnoses were in 45 to 64 year olds (174 per 100,000) and 15 to 19 year olds (165 per 100,000).
Across younger people aged between 15 and 34, rates of new gonorrhoea diagnoses declined between 2023 and 2025. This differs to the older population, as rates of new diagnoses in people aged 35 to 44, and 45 to 64 stayed relatively static during this period.
Figure 23. Rates of gonorrhoea per 100,000 by age group (for those aged 15 to 64 years only) and gender, London, 2025
Data sources: GUMCAD, ONS Census 2021 mid-year estimates.
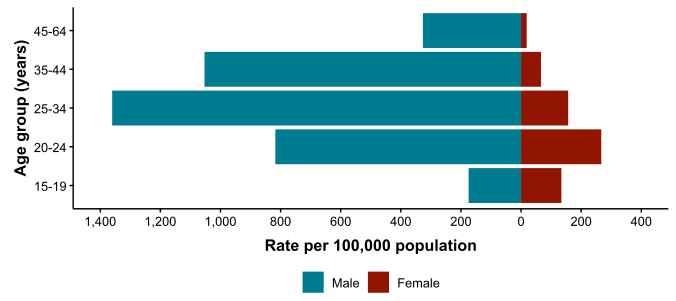
Figure 23 is a pyramid chart which shows the rate of new gonorrhoea diagnoses per 100,000, broken down by age group and gender. Gender was reported for 95% of Londoners diagnosed with gonorrhoea in 2025.
The chart shows that across all age groups, the graph is skewed towards males. The highest rate of new gonorrhoea diagnoses was in males aged 25 to 34.
Figure 24. Rate of gonorrhoea diagnoses per 100,000 by local authority, London, 2025
Data sources: GUMCAD, ONS Census 2021 mid-year estimates.
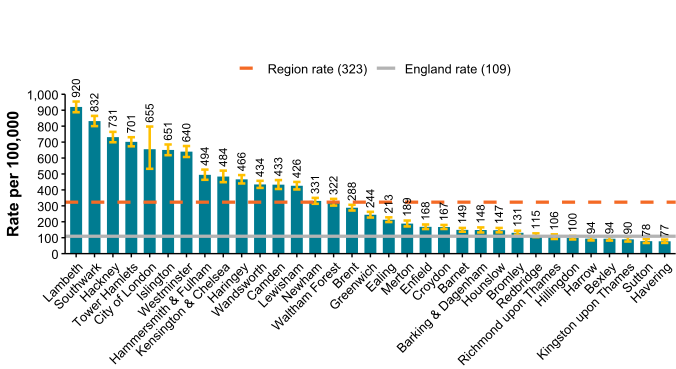
Figure 24 is a column chart which shows the rate of new gonorrhoea diagnoses per 100,000 in each local authority in London for 2025. The dashed orange line shows the rate across London, whilst the solid grey line represents the rate across England.
This figure shows that there is significant variation in the rate of new gonorrhoea diagnoses in different local authorities across London. The highest rates were in Lambeth (920 per 100,000), Southwark (832 per 100,000) and Hackney (731 per 100,000). This is similar to patterns of rates of new diagnoses that are seen across all STIs, reflecting the underlying population demographics in these local authorities. The lowest rates of new gonorrhoea diagnoses for 2025 were in Kingston upon Thames (90 per 100,000), Sutton (78 per 100,000) and Havering (77 per 100,000).
Genital warts
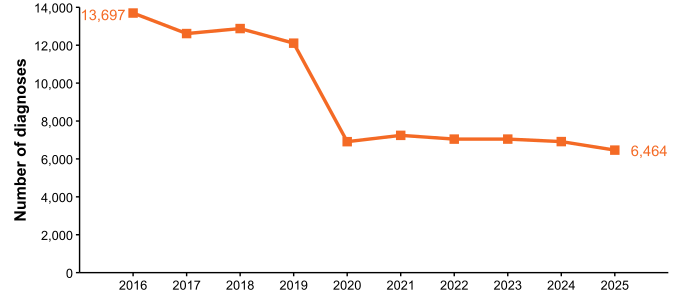
Figure 25. Number of genital warts diagnoses, London, 2016 to 2025
Data source: GUMCAD.
Figure 25 is a line chart which shows the number of genital warts diagnoses in London between 2016 and 2025. Genital warts are an STI and typically present as small painless lumps, often around the anus, penis or vagina (5). They are caused by a virus, the Human Papillomavirus (HPV). Some specific HPV serotypes are also responsible for causing cervical cancer (5, 6).
In 2025 6,464 new diagnoses of genital warts were made in Londoners. This has remained relatively constant over recent years, but is approximately half the level seen before the COVID-19 pandemic.
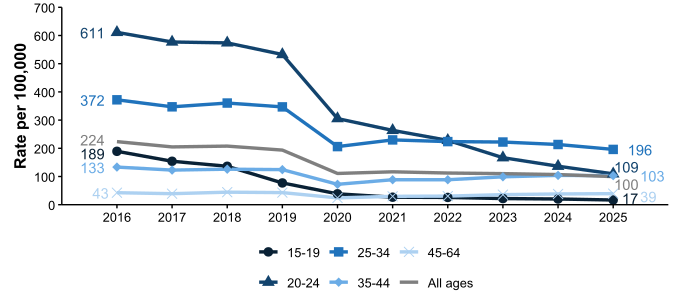
Figure 26. Rates of genital warts per 100,000 by age group (for those aged 15 to 64 years only), London, 2016 to 2025
Data sources: GUMCAD, ONS Census 2021 mid-year estimates.
Figure 26 is a line chart which shows the differences in the rate of diagnoses of genital warts by age group in Londoners. Age at diagnosis was reported for almost 100% of Londoners diagnosed over the 10-year period.
The highest rate of new diagnoses of genital warts for 2025 was in 25 to 34 year olds (196 per 100,000). This is similar to patterns seen across all STIs, as rates of new diagnoses across all STIs in London are highest amongst people aged 25 to 34. The second highest rate of new diagnoses of genital warts for 2025 was for 20 to 24 year olds (109 per 100,000), followed by 35 to 44 year olds (103 per 100,000). The lowest rates of new diagnoses for 2025 were in 45 to 64 year olds (39 per 100,000) and 15 to 19 year olds (17 per 100,000).
The HPV vaccination programme which commenced in 2008 was expanded in 2019 to also include boys (6). The decline in the rate of new diagnoses in people aged 20 to 24 is likely due to the impact of the HPV vaccination programme (7, 8).
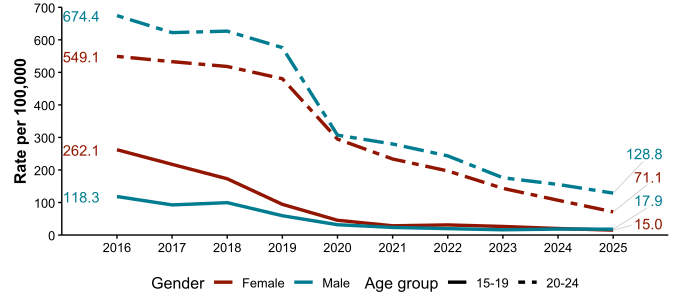
Figure 27. Rates of genital warts per 100,000 aged 15 to 19 and 20 to 24 years by gender, London, 2016 to 2025
Data sources: GUMCAD, ONS Census 2021 mid-year estimates.
Figure 27 is a line chart which shows the changes in the rates of diagnoses of genital warts per 100,000. Trends are broken down by gender and age.
Rates of new genital warts diagnoses have declined over a prolonged period in both males and females aged 20 to 24 and 15 to 19.
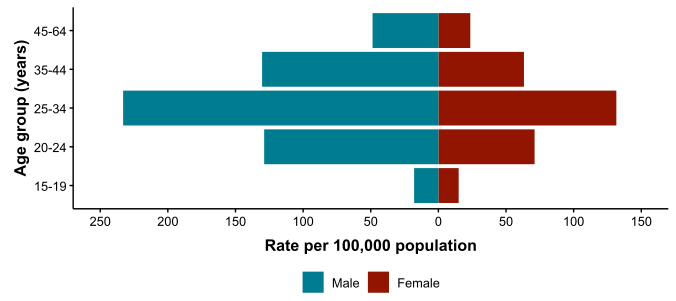
Figure 28. Rates of genital warts per 100,000 by age group (for those aged 15 to 64 years only) and gender, London, 2025
Data sources: GUMCAD, ONS Census 2021 mid-year estimates.
Figure 28 is a pyramid chart which shows the rates of genital warts per 100,000 by age group, for those aged between 15 and 64. Gender was reported for 92% of Londoners diagnosed with genital warts in 2025.
This figure shows that rate of new genital warts per 100,000 is skewed towards the males across all age groups. The highest rate of new diagnoses of genital warts was in males aged between 25 and 34. In females, the highest rate of new diagnoses of genital warts was for those aged 25 to 34.
Syphilis
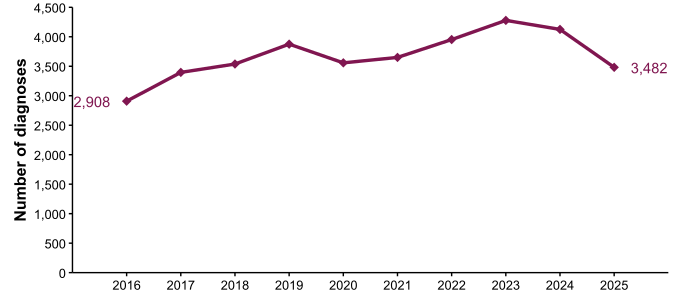
Figure 29. Number of syphilis diagnoses, London, 2016 to 2025
Data source: GUMCAD.
Figure 29 is a line chart which shows the number of new diagnoses of syphilis in Londoners between 2016 and 2025.
Syphilis is an STI which is caused by the bacterium Treponema pallidum and is treatable with antibiotics (9). An individual can often be infected with syphilis without displaying any symptoms. The presentation of syphilis often follows a standard pattern, with distinct stages known as primary, secondary and tertiary syphilis. Primary syphilis is typically characterised by a small ulcer or sore, which typically does not cause any pain. Secondary syphilis is a more advanced stage and corresponds with the sore disappearing, followed by symptoms such as tiredness, swollen glands and a rash appearing, often on the palms of the hands, which is not itchy. Following this, symptoms can resolve for some time. Some people who are infected with syphilis will later go on to develop serious symptoms, which may affect different organs in the body, and this is known as tertiary syphilis.
In 2025 3,482 diagnoses of syphilis were reported in Londoners. This is a decline from 2023, when diagnoses were at their highest after increases since 2016.
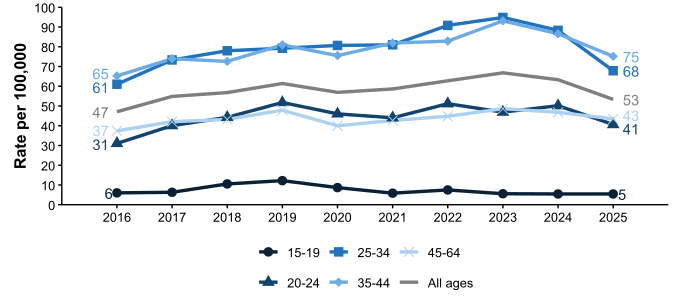
Figure 30. Rates of syphilis per 100,000 by age group (for those aged 15 to 64 years only), London, 2016 to 2025
Data sources: GUMCAD, ONS Census 2021 mid-year estimates.
Figure 30 is a line chart which shows the rate of new syphilis diagnoses per 100,000 each year between 2016 and 2025 broken down by age group. Age at diagnosis was reported for almost all Londoners diagnosed with syphilis over the 10-year period.
In 2025, the highest rate of new syphilis diagnosis in Londoners was in 35 to 44 year olds (75 per 100,000). This differs from the typical trend that is seen across all STIs, as highest rates are typically seen in 25 to 34 year olds. Rates are lowest amongst people aged 15 to 19 (5 per 100,000), followed by 20 to 24 year olds (41 per 100,000).
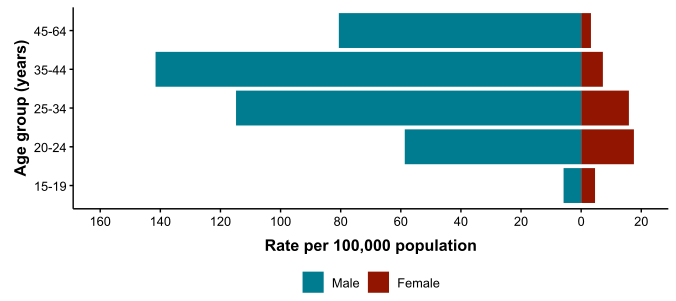
Figure 31. Rates of syphilis per 100,000 by age group (for those aged 15 to 64 years only) and gender, London, 2025
Data sources: GUMCAD, ONS Census 2021 mid-year estimates.
Figure 31 is a pyramid chart which shows the rate of new syphilis diagnoses for 2025 broken down by age group and by gender. Gender was reported for 94% of Londoners diagnosed with syphilis in 2025.
The skew to the left across all age groups demonstrates that across all age groups, there was a higher rate of new syphilis diagnoses amongst males in comparison to females. The highest rate of new syphilis diagnoses for 2025 was in males aged 35 to 44, followed by males aged between 25 and 34. Generally, rates of syphilis are higher in gay and bisexual men (10).
Genital herpes
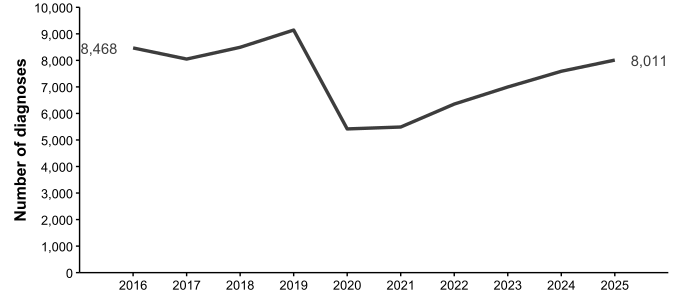
Figure 32. Number of genital herpes diagnoses, London, 2016 to 2025
Data source: GUMCAD.
Figure 32 is a line chart which shows the number of new diagnoses of genital herpes made in London residents between 2016 and 2025.
Genital herpes is a sexually transmitted infection which presents as genital sores. It is caused by the herpes simplex virus, namely HSV-1 and HSV-2 (11, 12). HSV-1 primarily causes cold sores but can also cause genital infections, usually caught via oral sex. HSV-2 is almost exclusively associated with genital infection.
The number of new diagnoses of genital herpes in Londoners in 2025 was 8,011. This is an increase from 2024. Whilst the number of new diagnoses has not yet increased to the numbers seen prior to the COVID-19 pandemic diagnoses have been increasing since 2021.
Figure 33. Rates of genital herpes per 100,000 by age group (for those aged 15 to 64 years only), London, 2016 to 2025
Data sources: GUMCAD, ONS Census 2021 mid-year estimates.
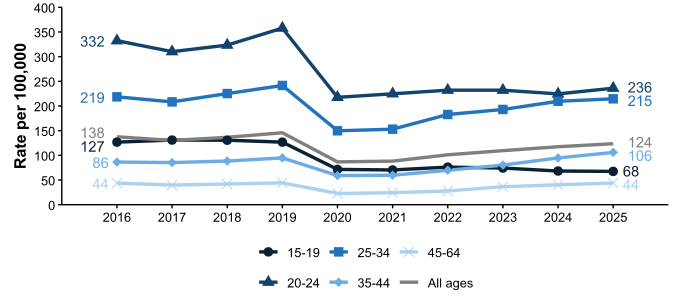
Figure 33 is a line chart which shows the trend in the rate of new genital herpes diagnosed between 2016 and 2025. This is broken down to show the trends by age group. Age at diagnosis was reported for almost 100% of Londoners diagnosed over the 10 year period.
In 2025, the highest rate of new diagnoses of genital herpes was in people aged between 20 and 24 (236 per 100,000), followed by those aged between 25 and 34 years old (215 per 100,000). Rates of new diagnosis of genital herpes were lowest in people aged between 35 and 44 (106 per 100,000), people aged between 15 and 19 (68 per 100,000) and people aged between 45 and 64 (44 per 100,000). In recent years, diagnosis rates in the youngest age groups (15 to 19 and 20 to 24) have remained stable, while slowly increasing in older age groups.
Figure 34. Rates of genital herpes per 100,000 by age group (for those aged 15 to 64 years only) and gender, London, 2025
Data sources: GUMCAD, ONS Census 2021 mid-year estimates.
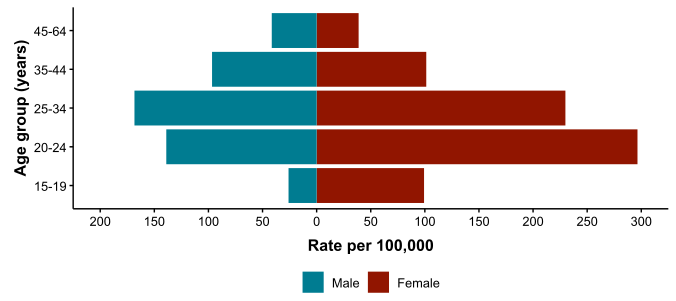
Figure 34 is a pyramid chart which shows the rate of new diagnoses of genital herpes for 2025 by age group and gender. Gender was reported for 93% of Londoners diagnosed with genital herpes in 2025.
The distribution of genital herpes is different to that seen in other STIs in London. This chart shows a skew towards the right side amongst the younger populations, indicating that rates of new diagnoses of genital herpes were higher in females rather than males. In 2025, the highest rate of new diagnoses of genital herpes was in females aged between 20 and 24. In males, rates were highest amongst those aged between 25 and 34.
Information on data sources
Find more information on local sexual health data sources in the UKHSA guide.
The gender and age group chart is restricted to those aged 15 to 64 years as information about STIs in those aged under 15 years is considered highly sensitive. Analyses specific to this group are not provided in routine outputs. Rates for those aged 65 or older are withheld to ensure that no deductive disclosure is possible for the under 15 years age group. The proportion of STIs in those aged under 15 years or older than 64 years is very low.
GUMCAD surveillance system
This disaggregate reporting system collects information about attendances and diagnoses at specialist (Level 3) and non-specialist (Level 2) sexual health services. Information about the patient’s area of residence is collected along with demographic data and other variables. GUMCAD superseded the earlier KC60 system and can provide data from 2009 onwards. GUMCAD is the main source of data for this report.
Due to limits on how much personally identifiable information sexual health clinics are able to share, it is not possible to deduplicate between different clinics. There is a possibility that some patients may be counted more than once if they are diagnosed with the same infection (for infection specific analyses) or a new STI of any type (for new STI analyses) at different clinics during the same calendar year.
CTAD surveillance system
CTAD collects data on all local authority and NHS or NHS-commissioned chlamydia testing carried out in England. CTAD is comprised of all chlamydia (NAATs) tests for all ages (with the exception of conjunctival samples), from all venues and for all reasons. CTAD enables unified, comprehensive reporting of all chlamydia data, to effectively monitor the impact of the NCSP through estimation of the coverage of population screening, proportion of all tests that are positive and detection rates.
For services which report to GUMCAD and for which CTAD does not receive data on the patient’s area of residence (for example, SHSs), information about chlamydia diagnoses is sourced from GUMCAD data.
CTAD does not collect information about sexual orientation or country of birth. Reports from CTAD are excluded from figures in this report which relate to analyses by sexual orientation or world region of birth.
New STIs
New STI diagnoses comprise diagnoses of the following:
- chancroid
- Lymphogranuloma venereum (LGV)
- donovanosis
- chlamydia
- gonorrhoea
- genital herpes (first episode)
- HIV (acute and AIDS defining)
- Molluscum contagiosum
- non-specific genital infection (NSGI)
- non-specific pelvic inflammatory disease (PID) and epididymitis
- chlamydial PID and epididymitis (presented in chlamydia total)
- gonococcal PID and epididymitis (presented in gonorrhoea total)
- scabies
- pediculosis pubis
- syphilis (primary, secondary and early latent)
- trichomoniasis and genital warts (first episode)
- Mycoplasma genitalium
- shigella
Calculations
Confidence Intervals were calculated using Byar’s method for numerators >= 10. For small numerators Byar’s method is less accurate and so an exact method based on the Poisson distribution is used.
ONS mid-year population estimates for 2024 were used as a denominator for rates (other than by ethnic group) for 2025. ONS estimates of population by ethnic group for the year 2021 were used as a denominator for rates by ethnic group for 2025. This is the first time that new estimates of population by ethnic group have been available since 2011. This must be considered if comparing rates for 2025 in this report with rates by 2024 in last year’s report, as the rates in the last report used the 2011 estimates.
Interpreting trends
When interpreting trends in the number of STI diagnoses it is important to consider the potential impact of changes to testing, vaccination programmes and the availability of interventions (such as prophylaxis). Specifically, diagnostic testing for gonorrhoea and genital herpes now includes in some areas highly sensitive testing using nucleic acid amplification tests. Additionally, there is some screening of gay and bisexual men at extra-genital sites. Where in place, both will have led to increased case ascertainment of gonorrhoea and genital herpes. Local testing practices for all STIs may vary.
More information
As of 2020, all analyses for this report include data from non-specialist (Level 2) SHSs and enhanced GP services as well as specialist (Level 3) SHSs.
For more information, see the online Sexual and Reproductive Health Profiles.
For more information about HIV data, see the separate HIV Spotlight report.
For more information about local sexual health data sources, see the UKHSA guide.
Local authorities have access to the Summary Profile of Local Authority Sexual Health (SPLASH) Reports (accessible from the Sexual and Reproductive Health Profiles) and the SPLASH supplement reports via the HIV and STI Data exchange.
About the Field Services
The UKHSA Field Services were established in 2018 as a national service comprising geographically dispersed multi-disciplinary teams integrating expertise in Field Epidemiology, Real-time Syndromic Surveillance and Public Health Microbiology to strengthen the surveillance, intelligence and response functions of UKHSA.
You can contact your local Field Services team at FES.SEaL@ukhsa.gov.uk
Acknowledgements
We would like to thank the following:
- local SHSs for supplying the SHS data
- local laboratories for supplying the CTAD data
- UKHSA Blood Safety, Hepatitis, Sexually Transmitted Infections (STI) and HIV Division for collection, analysis and distribution of data
References
1. UKHSA. NCSP: programme overview (accessed 18 August 2026)
2. Ministry of Housing, Communities & Local Government. English indices of deprivation 2025: statistical release (accessed 18 August 2026)
3. UKHSA. Gonorrhoea: guidance, data and analysis (accessed 18 August 2026)
4. NHS. Health conditions A to Z. Gonorrhoea (accessed 18 August 2026)
5. NHS. Health conditions A to Z. Genital warts (accessed 18 August 2026)
6. UKHSA. HPV vaccination programme (accessed 18 August 2026)
7. UKHSA. Ten years on since the start of the HPV vaccine programme – what impact is it having? (accessed 18 August 2026)
8.UKHSA. What is HPV and how effective is the vaccine that protects against it? (accessed 18 August 2026)
9. World Health Organization (WHO). Syphilis (accessed 18 August 2026)
10. UKHSA. What is syphilis? A quick guide to its symptoms and treatment (accessed 18 August 2026)
11. UKHSA. How do you catch genital herpes and is there a cure? (accessed 18 August 2026)
12. WHO. Herpes simplex virus (accessed 18 August 2026)