Salmonella by age: data 2000 to 2010
Published 19 December 2010

© Crown copyright 2010
This publication is licensed under the terms of the Open Government Licence v3.0 except where otherwise stated. To view this licence, visit nationalarchives.gov.uk/doc/open-government-licence/version/3 or write to the Information Policy Team, The National Archives, Kew, London TW9 4DU, or email: psi@nationalarchives.gov.uk.
Where we have identified any third party copyright information you will need to obtain permission from the copyright holders concerned.
This publication is available at https://www.gov.uk/government/publications/salmonella-rates-by-age/salmonella-by-age-data-2000-to-2010
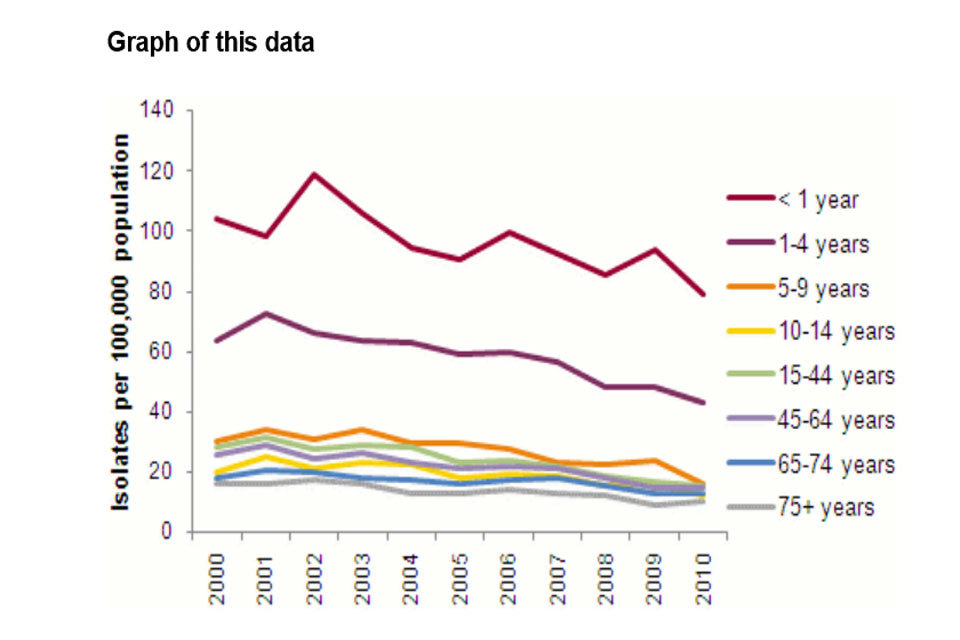
Salmonella rates by age. All human isolates reported to the Health Protection Agency (now PHE) per 100,000 population; England and Wales, 2000 to 2010.
| Years | under 1 | 1 to 4 years | 5 to 9 years | 10 to 14 years | 15 to 44 years | 45 to 64 years | 65 to 74 years | 75 + years |
|---|---|---|---|---|---|---|---|---|
| 2000 | 104.3 | 63.8 | 30.2 | 20 | 28.5 | 25.5 | 18 | 16 |
| 2001 | 98.5 | 72.4 | 34.4 | 25.1 | 31.3 | 28.7 | 20.3 | 16 |
| 2002 | 118.8 | 66.1 | 30.6 | 21.3 | 27.8 | 24.2 | 20.1 | 15.6 |
| 2003 | 106.1 | 63.8 | 34.2 | 22.9 | 29 | 26.3 | 18.3 | 15 |
| 2004 | 94.4 | 62.8 | 23.9 | 22.3 | 28.1 | 23.5 | 17.3 | 11.3 |
| 2005 | 90.5 | 59.4 | 29.6 | 17.9 | 22.9 | 21.1 | 16.4 | 11.2 |
| 2006 | 99.8 | 59.6 | 27.9 | 19.5 | 23.9 | 22 | 17.4 | 12.5 |
| 2007 | 92.7 | 56.5 | 23.3 | 18.5 | 22.1 | 21.3 | 18.1 | 11.6 |
| 2008 | 85.6 | 48.5 | 22.5 | 15.4 | 18.5 | 17.8 | 15.3 | 10.7 |
| 2009 | 93.9 | 48 | 23.8 | 16.3 | 16.6 | 14.5 | 12.7 | 8.2 |
| 2010* | 79.0 | 42.9 | 15.9 | 12.2 | 15.2 | 14.9 | 13.1 | 8.2 |
2010 dates are provisional.
Source: HPA Salmonella Dataset (Labbase2). Numbers may be higher than previously reported due to the inclusion of all isolates of Salmonella rather than only faecal and lower gastrointestinal tract isolates.
Salmonella by age