Non-typhoidal Salmonella data 2016 to 2025
Updated 28 May 2026
Applies to England

© Crown copyright 2026
This publication is licensed under the terms of the Open Government Licence v3.0 except where otherwise stated. To view this licence, visit nationalarchives.gov.uk/doc/open-government-licence/version/3 or write to the Information Policy Team, The National Archives, Kew, London TW9 4DU, or email: psi@nationalarchives.gov.uk.
Where we have identified any third party copyright information you will need to obtain permission from the copyright holders concerned.
This publication is available at https://www.gov.uk/government/publications/salmonella-national-laboratory-and-outbreak-data/non-typhoidal-salmonella-data-2016-to-2025
Main points for 2025
The main points of the 2025 report are:
- the number of non-typhoidal Salmonella cases in England increased marginally from 10,389 cases in 2024 to 10,406 cases in 2025, an increase of 0.17%
- in 2025, Salmonella Enteritidis was the most frequently reported serovar; however laboratory reports decreased from 3,166 in 2024 to 3,104 in 2025 (2.0% decrease); reports of Salmonella Typhimurium - the second most commonly reported serovar - decreased from 1,698 in 2024 to 1,616 in 2025 (4.8% decrease)
- the region that reported the highest number of non-typhoidal Salmonella cases was London with 2,329 reports with the highest reporting rate of 25.6 reports per 100,000 population
- the age group with the highest number of cases was children below the age of 10 (2,094 non-typhoidal Salmonella cases)
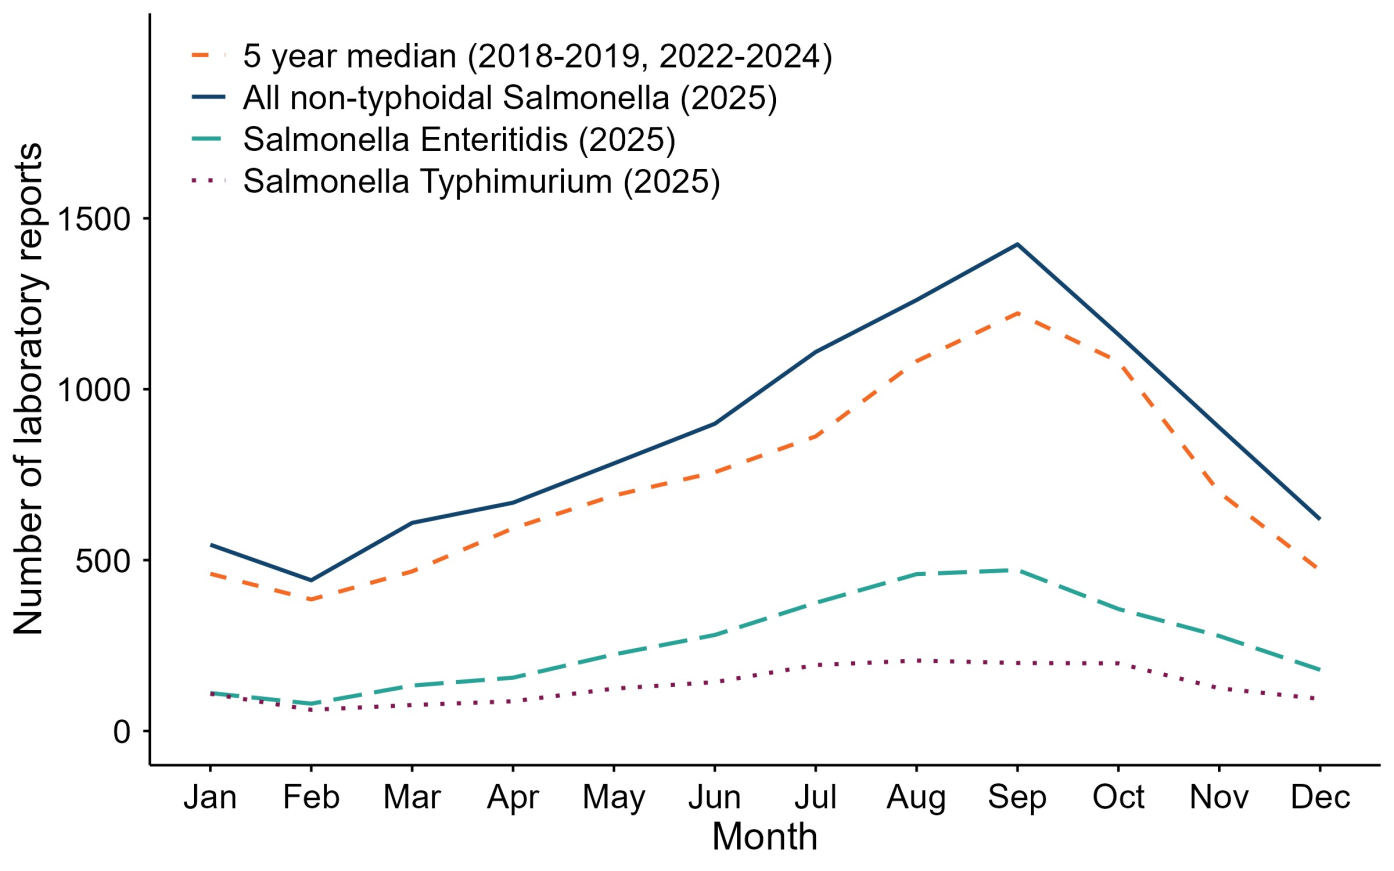
- September was the peak month for non-typhoidal Salmonella reporting in 2025, with 1,424 cases reported
Background
Salmonella are bacteria that cause a food poisoning illness called salmonellosis. The most common symptoms of salmonellosis include:
- diarrhoea (3 or more loose stools per day) sometimes containing blood or mucus
- stomach cramps
- fever
- nausea
- vomiting
- headache
- loss of appetite
Most people recover within 1 week (1), however some people including young children less than 5 years of age, adults aged 65 years and older, or those with weakened immune systems are at higher risk of developing more severe illness or longer-term complications (2, 3). Information about treating food poisoning caused by Salmonella infection is available on the NHS website.
Salmonella is found in the gut of many animals such as poultry, cattle, pigs and reptiles. The most common route of acquiring human infection is by the consumption of contaminated food such as poultry meat, eggs, raw fruits and vegetables, and unpasteurised milk (4, 5, 6, 7).
However, Salmonella has also been found in a wide range of foods such as confectionery, nuts, seeds, formula milk and ready to eat foods (8, 9, 10, 11, 12). Infection may also occur by close contact with an infected person or animal and through environmental exposure (13). International travel has also been documented as a risk factor for salmonellosis (14).
Over 8,000 laboratory confirmed infections of Salmonella serovars are reported nationally per year. In humans, the majority of Salmonella infections are caused by 2 serovars, S. Enteritidis and S. Typhimurium, with a higher number of infections reported in summer (May to October) than in winter months (15).
This report summarises the trends in reporting of Salmonella cases in England in 2025 with a comparison to reporting in previous years.
COVID-19 pandemic
During 2020 and 2021 it is likely that the emergence of the novel severe acute respiratory syndrome coronavirus 2 (SARS-CoV-2), the causative agent of coronavirus disease (COVID-19), with subsequent non-pharmaceutical interventions (NPIs) implemented to control COVID-19 transmission affected notifications of Salmonella infections to national surveillance in several ways. These include, but are not limited to, changes which may have impacted ascertainment (for example, changes in healthcare seeking behaviour, access to health care, availability or capacity of testing) as well as changes which likely impacted incidence (for example, limited foreign travel, closure of hospitality venues and attractions or behavioural changes around food consumption) which will have also varied over time. Therefore, trends presented in this report should be interpreted with caution, and 2020 and 2021 data, the years a notable impact on Salmonella reporting to national surveillance was observed (16), are excluded when 5-year medians are calculated.
The magnitude and duration of the impacts on reporting differed by gastrointestinal pathogen due to differences in severity, transmission routes and risk factors (17, 18). Therefore, the number of years impacted and consequentially excluded from the calculation of 5-year medians also differs by pathogen, for example 2020 and 2021 for Salmonella but only 2020 for Campylobacter.
Methods
All data presented in this report is correct as of 16 February 2026. This report covers all non-typhoidal Salmonella serovars in England. Data on typhoidal Salmonellae (S. Typhi and S. Paratyphi subtypes A/B/C causing enteric fever) are available in the Enteric fever annual reports. The S. Typhimurium reported numbers include S. Typhimurium and its variant monophasic Typhimurium 1,4,[5],12:i:-. The S. Enteritidis reported numbers include S. Enteritidis only. The classification into typhoidal and non-typhoidal Salmonella serovars is consistent with established conventions in this area of research (19).
As data was extracted from the Second Generation Surveillance System (SGSS), a live laboratory reporting system, the data are subject to change and historical totals may differ slightly. The laboratory report date was used for all data analyses in this report. Data presented in this report may differ to previously published reports due to differences in extraction dates from SGSS.
Population data were sourced from the Office for National Statistics (ONS) for England. The latest mid-year population estimates were used to provide denominators for the calculation of rates in 2025 (at the time of production, the latest mid-year population estimates available were mid-2024). All rates are calculated as per 100,000 population.
Regional classification was based on ONS regional boundaries using patient residence postcode where available. Where patient residence or GP postcodes were not available or invalid, the referring laboratory postcode was used as a proxy. Previous reports used Nomenclature of Territorial Units for regional boundaries, level (NUTS1) codes, therefore historical regional totals in previous publications may differ slightly. Updated regional totals were calculated for 2024 for accurate comparison with 2025 data. This change was made to ensure the same regional assignment methodology is used across all Salmonella surveillance outputs.
The deprivation level of an area (Index of Multiple Deprivation decile) was mapped to each case using patient home postcode and 2025 IMD version.
When calculating the median of the previous 5 years, 2020 and 2021 were excluded due to the impacts of the COVID-19 pandemic, therefore the 5-year median was calculated from the same period in 2018 to 2019 and 2022 to 2024.
Salmonella laboratory data 2016 to 2025
1. Annual data 2016 to 2025
a. All non-typhoidal Salmonella
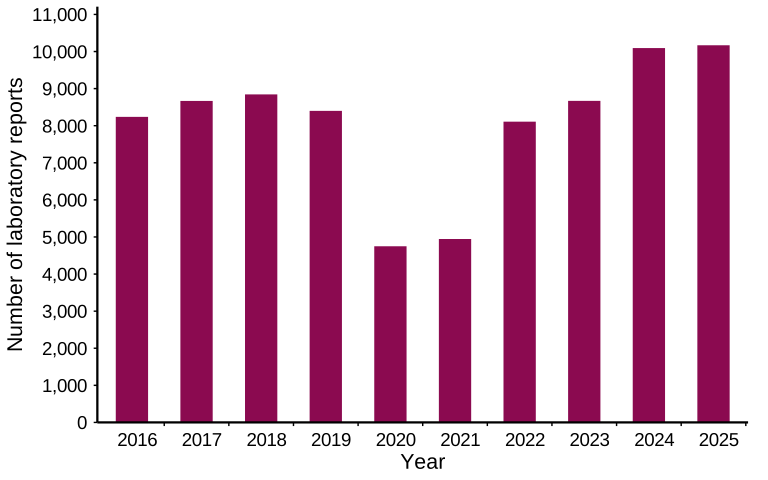
Table 1 and Figure 1 show the trend of non-typhoidal Salmonella laboratory reports in England from 2016 to 2025. The number of non-typhoidal Salmonella laboratory reports were comparable in 2024 and 2025 (up from 10,389 to 10,406) and the rate of non-typhoidal Salmonella laboratory reporting was also comparable, from 17.7 laboratory reports per 100,000 population in 2024 to 17.8 in 2025.
Table 1. Annual laboratory reports of non-typhoidal Salmonella in England from 2016 to 2025
| Year | Number of laboratory reports | Laboratory reports per 100,000 population |
|---|---|---|
| 2016 | 8,242 | 14.9 |
| 2017 | 8,672 | 15.6 |
| 2018 | 8,845 | 15.8 |
| 2019 | 8,403 | 14.9 |
| 2020 | 4,770 | 8.5 |
| 2021 | 5,000 | 8.8 |
| 2022 | 8,284 | 14.5 |
| 2023 | 8,872 | 15.3 |
| 2024 | 10,389 | 17.7 |
| 2025 | 10,406 | 17.8 |
Figure 1. Annual laboratory reports of non-typhoidal Salmonella in England from 2016 to 2025
b. Salmonella Enteritidis
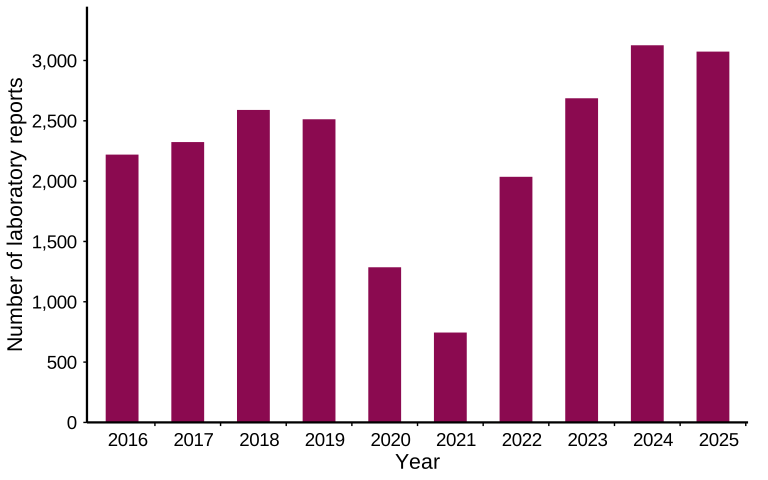
Table 2 and Figure 2 show the trend of Salmonella Enteritidis (S. Enteritidis) laboratory reports in England from 2016 to 2025. The number of S. Enteritidis laboratory reports decreased by 2.0% between 2024 and 2025 (from 3,166 to 3,104). The rates of S. Enteritidis laboratory reports per 100,000 population were comparable in 2024 and 2025, 5.4 and 5.3 laboratory reports per 100,000 population respectively.
Table 2. Annual laboratory reports of S. Enteritidis in England from 2016 to 2025
| Year | Number of laboratory reports | Laboratory reports per 100,000 population |
|---|---|---|
| 2016 | 2,221 | 4.0 |
| 2017 | 2,325 | 4.2 |
| 2018 | 2,590 | 4.6 |
| 2019 | 2,514 | 4.5 |
| 2020 | 1,291 | 2.3 |
| 2021 | 747 | 1.3 |
| 2022 | 2,069 | 3.6 |
| 2023 | 2,711 | 4.7 |
| 2024 | 3,166 | 5.4 |
| 2025 | 3,104 | 5.3 |
Figure 2. Annual laboratory reports of S. Enteritidis in England from 2016 to 2025
c. Salmonella Typhimurium
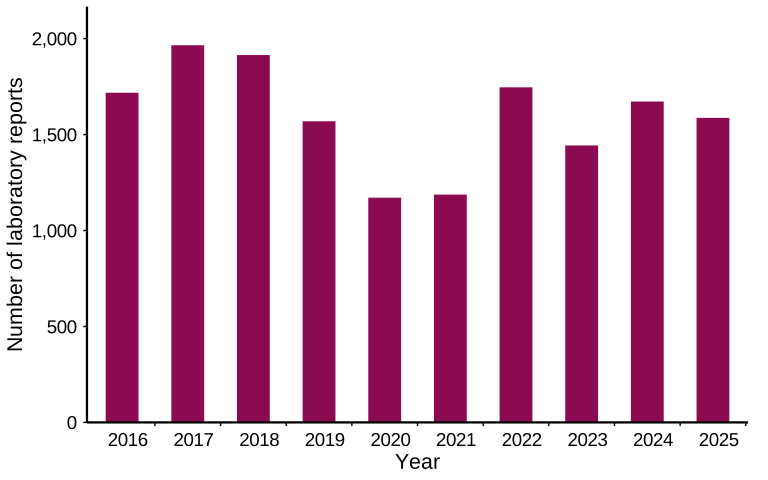
Table 3 and Figure 3 show the trend of Salmonella Typhimurium (S. Typhimurium) laboratory reports in England from 2016 to 2025. The data includes Typhimurium and monophasic Typhimurium 1,4,[5],12:i:- serotypes. The number of S. Typhimurium laboratory reports decreased by 4.8% between 2024 and 2025 (from 1,698 to 1,616). The rate of S. Typhimurium laboratory reports per 100,000 population decreased by 3.4% between 2024 and 2025 (from 2.9 per 100,000 population to 2.8 per 100,000 population).
Table 3. Annual laboratory reports of S. Typhimurium in England from 2016 to 2025
| Year | Number of laboratory reports | Laboratory reports per 100,000 population |
|---|---|---|
| 2016 | 1,718 | 3.1 |
| 2017 | 1,965 | 3.5 |
| 2018 | 1,914 | 3.4 |
| 2019 | 1,569 | 2.8 |
| 2020 | 1,173 | 2.1 |
| 2021 | 1,201 | 2.1 |
| 2022 | 1,772 | 3.1 |
| 2023 | 1,473 | 2.5 |
| 2024 | 1,698 | 2.9 |
| 2025 | 1,616 | 2.8 |
Figure 3. Annual laboratory reports of S. Typhimurium in England 2016 to 2025
2. Regional data
Table 4 displays the number of non-typhoidal Salmonella laboratory reports per region in 2025 as well as the rate per 100,000 population.
Compared to 2024, the rate of non-typhoidal Salmonella laboratory reports per 100,000 population increased during 2025 in 5 regions: East Midlands, East of England, London, North West and the South East. The rate per 100,00 population decreased in 4 regions: North East, South West, West Midlands and Yorkshire and the Humber. In 2025, London had the highest rate of laboratory reports at 25.6 per 100,000 population and the lowest rate was in the West Midlands, with 14.9 laboratory reports per 100,000 population. The biggest increases compared to 2024 were in London (7.1% increase) and the North West (7.1% increase), which rose from 24.2 to 25.6 per 100,000 population and 15.7 to 16.5 per 100,000 population, respectively. The biggest rate reduction compared to 2024 was in the South West (11.1% decrease), which decreased from 17.3 to 15.2 laboratory reports per 100,000 population.
Table 4. Regional distribution of laboratory reports of non-typhoidal Salmonella in England 2025
| Region | Laboratory reports | Laboratory reports per 100,000 population | Percentage change in rates compared to 2024 |
|---|---|---|---|
| London | 2,329 | 25.6 | 7.1% increase |
| South East | 1,685 | 17.5 | 3.6% increase |
| East of England | 1,133 | 17.2 | 2.4% increase |
| North East | 471 | 17.1 | 6.0% decrease |
| North West | 1,273 | 16.5 | 7.1% increase |
| Yorkshire and the Humber | 902 | 15.9 | 9.7% decrease |
| East Midlands | 796 | 15.7 | 5.4 % increase |
| South West | 896 | 15.2 | 11.1% decrease |
| West Midlands | 921 | 14.9 | 9.7% decrease |
3. Top 10 Salmonella serovars in 2025
Table 5 displays the number of laboratory reports for the top 10 most commonly reported Salmonella serovars in 2025. In 2025, the top 2 reported Salmonella serovars were S. Enteritidis and S. Typhimurium (including monophasic Typhimurium 1,4,[5],12:i:-), which is consistent with the findings from 2024. For S. Enteritidis, there was a 2.0% decrease in laboratory reports between 2024 and 2025 (from 3,166 to 3,104) and for S. Typhimurium (including monophasic Typhimurium 1,4,[5],12:i:-) there was a 4.8% decrease (from 1,698 to 1,616). Compared to 2024, S. Newport reports also decreased by 14.5% from 317 to 271 in 2025.
Table 5. List of top 10 non-typhoidal Salmonella serovars reported in England 2025
| Serovar | Laboratory reports |
|---|---|
| Enteritidis | 3,104 |
| Typhimurium (including monophasic Typhimurium 1,4,[5],12:i:-) | 1,616 |
| Newport | 271 |
| Saintpaul | 223 |
| Infantis | 212 |
| Java | 191 |
| Chester | 182 |
| Agona | 133 |
| Kentucky | 128 |
| Bareilly | 126 |
4. Age and sex distribution in 2025
a. All non-typhoidal Salmonella
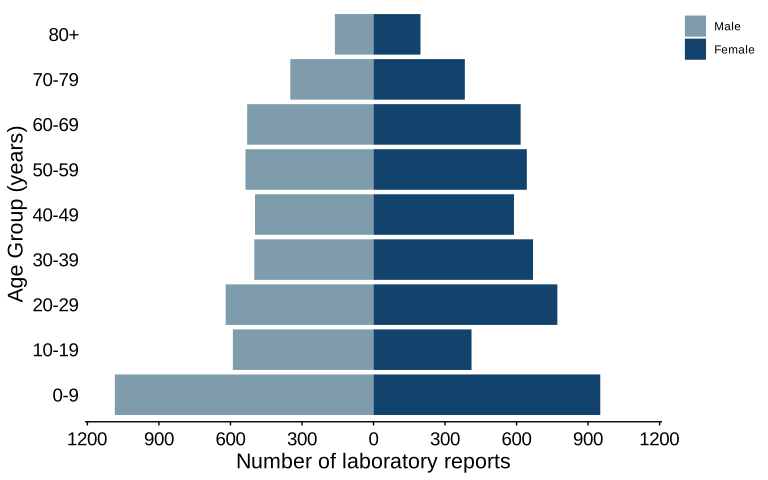
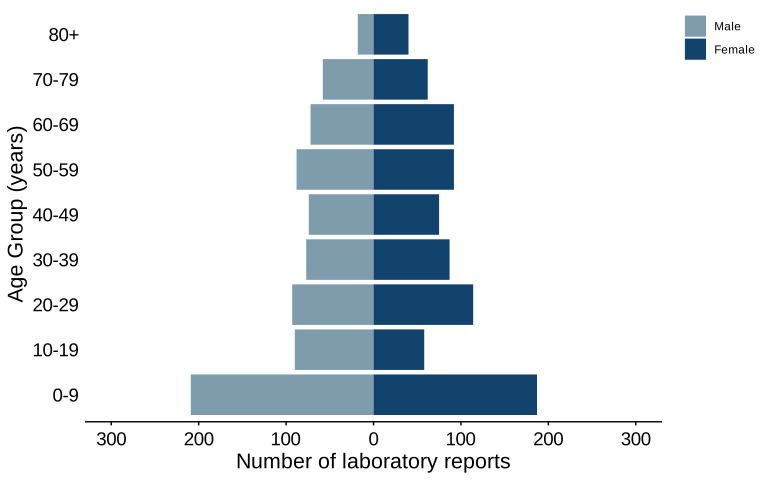
Figure 4 shows the age and sex distribution of non-typhoidal Salmonella laboratory reports in England during 2025; 67 laboratory reports were excluded where case age or sex was unknown. Overall, 51.6% of reported cases with information available were female and the most affected age group was the 0 to 9 age category, accounting for 20.3% of total laboratory reports.
Figure 4. Age and sex distribution of laboratory reports of non-typhoidal Salmonella in England in 2025 (n=10,339)
b. Salmonella Enteritidis
Figure 5 shows the age and sex distribution of S. Enteritidis laboratory reports in England during 2025; 1 laboratory report was excluded where case age or sex was unknown.
Overall, 50.8% of reported cases were female and the most affected age group was the 0 to 9 age category, accounting for 20.1% of total laboratory reports.
Figure 5. Age and sex distribution of laboratory reports of S. Enteritidis in England in 2025 (n=3,103)

c. Salmonella Typhimurium
Figure 6 shows the age and sex distribution of S. Typhimurium laboratory reports in England during 2025; 1 laboratory report was excluded due to unknown age or sex. Overall, 50.8% of reported cases were female and the most affected age group was the 0 to 9 age category, accounting for 25.1% of total laboratory reports.
Figure 6. Age and sex distribution of laboratory reports of S. Typhimurium in England in 2025 (n=1,615)
5. Index of Multiple Deprivation (IMD) in 2025
Table 6 shows the number of non-typhoidal Salmonella cases by Index of Multiple Deprivation (IMD) decile. Cases were mapped to IMD decile by home residency postcode. A total of 190 cases were excluded where IMD decile could not be mapped. The median IMD decile of non-typhoidal Salmonella cases was 5 (inter quartile range: 3 to 8).
Table 6. Number of non-typhoidal Salmonella cases per Index of Multiple Deprivation (IMD) decile in England 2025 (n=10,216)
| Index of Multiple Deprivation (IMD) deciles | Total number of cases (%) |
|---|---|
| 1 (Most deprived) | 1,007 (9.9) |
| 2 | 1,060 (10.4) |
| 3 | 1,064 (10.4) |
| 4 | 1,061 (10.4) |
| 5 | 1,091 (10.7) |
| 6 | 967 (9.5) |
| 7 | 995 (9.7) |
| 8 | 1,008 (9.9) |
| 9 | 1,010 (9.9) |
| 10 (Least deprived) | 953 (9.3) |
| Total | 10,216 |
6. Seasonal variation in 2025
Figure 7 shows the seasonal trend of laboratory reporting for all non-typhoidal Salmonella, S. Enteritidis and S. Typhimurium in England during 2025 by month. In 2025, the number of laboratory reports per month of all non-typhoidal Salmonella broadly followed the same trend as the median of the previous 5 years, 2018 to 2019 and 2022 to 2024 (excluding 2020 and 2021), peak reporting occurred in September, though the number of laboratory reports was lower than the number observed in September 2024.
Figure 7. Seasonality of laboratory reports of all non-typhoidal Salmonella, S. Enteritidis and S. Typhimurium in England in 2025
Foodborne outbreak data in 2025
Table 7. Foodborne outbreaks of non-typhoidal Salmonella reported in England in 2025 [note 1]
| Agent | Total affected | Laboratory confirmed | Hospitalised [note 2] | Deaths [note 2] | Setting | Food description | Strength of evidence [note 3] |
|---|---|---|---|---|---|---|---|
| S. Enteritidis | 122 | 122 | 12 | 0 | National | Imported eggs | Strong |
| S. Typhimurium | 31 | 31 | 7 | 0 | National | Not identified | Not applicable |
| S. Enteritidis | 25 | 25 | 0 | 0 | Small Retailer | Shelled eggs and imported poultry | Weak |
| S. Saintpaul | 23 | 23 | 2 | 0 | National | Watermelon | Strong |
| S. Typhimurium | 18 | 16 | 3 | 0 | Restaurant | Dairy ice cream | Weak |
| S. Typhimurium | 17 | 17 | 5 | 0 | National | Not identified | Not applicable |
| S. Newport | 9 | 4 | 0 | 0 | Takeaway restaurant | Raw onions | Weak |
| S. Enteritidis | 6 | 6 | 0 | 0 | Restaurant | Not identified | Not applicable |
| S. Montevideo | 5 | 5 | 1 | 0 | Nursery | Not identified | Not applicable |
| S. species | 5 | 3 | 1 | 0 | Prison | Not identified | Not applicable |
| S. Typhimurium | 4 | 2 | 0 | 0 | Restaurant | Poultry | Weak |
| S. Coeln | 2 | 2 | 0 | 0 | Restaurant | Poultry | Weak |
| S. Kentucky | 2 | 2 | 2 | 0 | Hospital | Not identified | Not applicable |
Use the scroll bar to view all data.
Note 1: number of cases affected and number laboratory confirmed is for cases resident in England. Where the outbreak spanned more than one year, only the number of cases reported in 2025 is included in the table.
Note 2: clinical outcome is not known for all cases and the data reported represents cases who have hospitalisations or deaths reported to national surveillance.
Note 3: the strength and nature of evidence linking the consumption of a particular food to outbreak cases is consistent with internationally recognised definitions of the categories and strength of evidence (20).
Conclusions
In 2025, the number of non-typhoidal Salmonella laboratory reports was the highest reported in the past decade and comparable to the number reported in 2024. The number of S. Enteritidis and S. Typhimurium reports has decreased since 2024, with increases in the number of reports in other serovars, namely Saintpaul, Infantis, Java, Chester and Bareilly. Similarly to 2024, the highest number of laboratory confirmed cases per 100,000 population of non-typhoidal Salmonella in 2025 was in London, however there was also a notable increase in the North West and the East Midlands. In 2025, September was the peak month for reported cases of non-typhoidal Salmonella, consistent with the 5-year median from 2018 to 2019 and 2022 to 2024 (excluding 2020 and 2021). Representation of male to female cases was approximately 50% (where case gender was known), with 0 to 9 years being the most affected age group. S. Enteritidis was the most reported serovar, consistent with previous years.
Thirteen outbreaks of Salmonella were reported to national surveillance in 2025, comprising 269 cases of which 258 cases were laboratory confirmed. These outbreaks were associated with the consumption of multiple different food vehicles including: shelled eggs, dairy, poultry and raw onions.
Data sources
Laboratory-reported diagnoses of Salmonella are derived from the UK Health Security Agency (UKHSA) (formerly Public Health England (PHE)), Second Generation Surveillance System (SGSS). This is a live laboratory reporting system therefore numbers are subject to change.
Outbreaks of salmonellosis are reported to the Gastrointestinal Infections, Food Safety and One Health (GIFSOH) division’s Electronic Foodborne and non-foodborne Outbreak Surveillance System (eFOSS) and the UKHSA Case and Incident Management System (CIMS), which are also live surveillance systems and therefore numbers are subject to change.
The population data used for England and Wales was sourced from the Office for National Statistics mid-year 2024 estimates.
Data caveats
This report was produced using laboratory data for England only, therefore the number of Salmonella laboratory reports published in previous reports which include data from other UK countries may differ to those included in this report. As data was extracted from SGSS, a live laboratory reporting system, the data is subject to change and historical totals may differ slightly.
Acknowledgements
We are grateful to:
- the NHS and private sector diagnostic laboratories, microbiologists and local authorities, health protection and environmental health specialists who have contributed data and reports to national surveillance systems
- the epidemiologists and information officers who have worked on the national surveillance of intestinal infectious diseases
- colleagues in the Gastrointestinal Bacterial Reference Unit (GBRU) for providing the Reference Laboratory Services and laboratory surveillance functions and expertise
- UKHSA (formerly PHE) Information Management Department for maintenance and quality assurance of UKHSA national surveillance databases used for Gastrointestinal Infections (GI) pathogen surveillance at the national level
- UKHSA (formerly PHE) Local Public Health Laboratories and Food Water and Environmental Microbiology Services for providing a surveillance function for GI pathogens and testing of food and environmental samples routinely and during outbreak investigations
- all colleagues who have investigated and reported outbreaks to the eFOSS surveillance database
Prepared by: Gastrointestinal Infections, Food Safety and One Health Division, UKHSA.
For queries relating to this document, please contact EEDD@ukhsa.gov.uk
References
1. Katiyo S, Muller-Pebody B, Minaji M, Powell D, Johnson AP, De Pinna E, Day M, Harris R, Godbole G. ‘Epidemiology and Outcomes of Nontyphoidal Salmonella Bacteremias from England, 2004 to 2015’ Journal of Clinical Microbiology 2019: volume 57, issue 1, pages e01189 to e01118
2. Keithlin J, Sargeant JM, Thomas MK, Fazil A. ‘Systematic review and meta-analysis of the proportion of non-typhoidal Salmonella cases that develop chronic sequelae’ Epidemiology and Infection 2015: volume 143, issue 7, pages 1,333 to 1,351
3. Jiang B, Xu H, Zhou Z. ‘Septic arthritis with osteomyelitis due to Salmonella enterica serotype Dublin: A case series’ Frontiers in Surgery 2023: volume 9, 1069141
4. Hugas M, Beloeil P. ‘Controlling Salmonella along the food chain in the European Union - progress over the last ten years’ Eurosurveillance 2014: volume 19, issue 19, 20804
5. Heaton JC, Jones K. ‘Microbial contamination of fruit and vegetables and the behaviour of enteropathogens in the phyllosphere: a review’ Journal of Applied Microbiology 2008: voume 104, issue 3, pages 613 to 626
6. de Klerk JN, Robinson PA. ‘Drivers and hazards of consumption of unpasteurised bovine milk and milk products in high-income countries’ Peer Journal 2022: volume 16, issue 10, article e13426
7. Ehuwa O, Jaiswal AK, Jaiswal S. ‘Salmonella, Food Safety and Food Handling Practices’ Foods 2021: volume 10, issue 5, page 907
8. Larkin L, Pardos de la Gandara M, Hoban A, Pulford C, Jourdan-Da Silva N, de Valk H, Browning L, Falkenhorst G, Simon S, Lachmann R, Dryselius R, Karamehmedovic N, Börjesson S, van Cauteren D, Laisnez V, Mattheus W, Pijnacker R, van den Beld M, Mossong J, Ragimbeau C, Vergison A, Thorstensen Brandal L, Lange H, Garvey P, Nielsen CS, Herrera León S, Varela C, Chattaway M, Weill FX, Brown D, McKeown P. ‘Investigation of an international outbreak of multidrug-resistant monophasic Salmonella Typhimurium associated with chocolate products, EU/EEA and United Kingdom, February to April 2022’ Eurosurveillance 2022: volume 15, 2200314
9. European Centre for Disease Prevention and Control, European Food Safety Authority. ‘Multi-country outbreak of Salmonella Typhimurium and S. Anatum infections linked to Brazil nuts – 21 October 2020’ EFSA Supporting Publications 2020: volume 17, issue 10
10. European Centre for Disease Prevention and Control, European Food Safety Authority. ‘Prolonged cross-border multi-serovar Salmonella outbreak linked to consumption of sprouted seeds’ EFSA Supporting Publications 2025: volume 22, issue 3
11. Jourdan-da Silva N, Fabre L, Robinson E, Fournet N, Nisavanh A, Bruyand M, Mailles A, Serre E, Ravel M, Guibert V, Issenhuth-Jeanjean S, Renaudat C, Tourdjman M, Septfons A, de Valk H, Le Hello S. ‘Ongoing nationwide outbreak of Salmonella Agona associated with internationally distributed infant milk products, France, December 2017’ Eurosurveillance 2018: volume 23, issue 2, 17-00852
12. Castrica M, Andoni E, Intraina I, Curone G, Copelotti E, Massacci F.R, Terio V, Colombo S, Balzaretti C.M. ‘Prevalence of Listeria monocytogenes and Salmonella spp. in Different Ready to Eat Foods from large Retailers and Canteens over a 2-Year Period in Northern Italy’ International Journal of Environmental Research and Public Health 2021: volume 18, issue 20
13. Silva C, Calva E, Maloy S. ‘One Health and Food-Borne Disease: Salmonella Transmission between Humans, Animals, and Plants’ Microbiology Spectrum 2014: volume 2, issue 1
14. Love NK, Jenkins C, McCarthy N, Baker KS, Manley P and Wilson D. ‘International travel as a risk factor for gastrointestinal infections in residents of North East England’ Epidemiology and Infection 2024: volume 152, article e97
15. Kovats RS, Edwards SJ, Hajat S, Armstrong BG, Ebi KL, Menne B. ‘The effect of temperature on food poisoning: a time-series analysis of salmonellosis in ten European countries’ Epidemiology & Infection 2004: volume 132, issue 3, 443 to 453
16. Ondrikova N, Clough HE, Douglas A, Iturriza-Gomara M, Larkin L, Vivancos R, Harris JP, Cunliffe NA. ‘Differential impact of the COVID-19 pandemic on laboratory reporting of norovirus and Campylobacter in England: A modelling approach’ PLoS One 2021: volume 16, issue 8, article e0256638
17. Love NK, Douglas A, Gharbia S, Hughes H, Morbey R, Oliver I, Smith GE, Elliot AJ. ‘Understanding the impact of the COVID-19 pandemic response on GI infection surveillance trends in England, January 2020-April 2022’ Epidemiology & Infection 2023: volume 151, article e147
18. Love NK, Elliot AJ, Chalmers RM, Douglas A, Gharbia S, McCormick J, Hughes H, Morbey R, Oliver I, Vivancos R, Smith G. ‘Impact of the COVID-19 pandemic on gastrointestinal infection trends in England, February-July 2020’ British Medical Journal Open 2022: volume 12, issue 3, article e050469
19. Gal-Mor O, Boyle EC, Grassl GA. ‘Same species, different diseases: how and why typhoidal and non-typhoidal Salmonella enterica serovars differ’ Frontiers in Microbiology 2014: volume 5, page 391
20. EFSA (European Food Safety Authority), Amore G, Beloeil P- A, Boelaert F, Garcia Fierro R, Rizzi V and Stoicescu A-V. ‘Guidance for reporting 2024 data on zoonoses, foodborne outbreaks and antimicrobial resistance’ EFSA Supporting Publications 2025: volume 22, issue 1