Salmonella by age group and year
Published 6 December 2012

© Crown copyright 2012
This publication is licensed under the terms of the Open Government Licence v3.0 except where otherwise stated. To view this licence, visit nationalarchives.gov.uk/doc/open-government-licence/version/3 or write to the Information Policy Team, The National Archives, Kew, London TW9 4DU, or email: psi@nationalarchives.gov.uk.
Where we have identified any third party copyright information you will need to obtain permission from the copyright holders concerned.
This publication is available at https://www.gov.uk/government/publications/salmonella-by-age-group-and-year/salmonella-by-age-group-and-year
Salmonella by age group and year.
| Years | under 1 | 1 to 4 years | 5 to 9 years | 10 to 14 years | 15 to 44 years | 45 to 64 years | 65 to 74 years | 75 + years |
|---|---|---|---|---|---|---|---|---|
| 2000 | 633 | 1622 | 1017 | 678 | 6160 | 3139 | 788 | 628 |
| 2001 | 580 | 1811 | 1135 | 861 | 6809 | 3574 | 888 | 633 |
| 2002 | 699 | 1617 | 1000 | 737 | 6078 | 3039 | 885 | 699 |
| 2003 | 643 | 1533 | 1106 | 789 | 6353 | 3343 | 810 | 656 |
| 2004 | 594 | 1500 | 937 | 762 | 6190 | 3017 | 768 | 522 |
| 2005 | 578 | 1433 | 934 | 606 | 5090 | 2746 | 730 | 525 |
| 2006 | 652 | 1468 | 864 | 648 | 5345 | 2913 | 774 | 581 |
| 2007 | 625 | 1428 | 708 | 606 | 4965 | 2860 | 809 | 540 |
| 2008 | 602 | 1258 | 679 | 500 | 4144 | 2423 | 695 | 528 |
| 2009 | 656 | 1280 | 721 | 520 | 3707 | 2008 | 592 | 396 |
| 2010 | 552 | 1144 | 482 | 390 | 3394 | 2063 | 612 | 434 |
| 2011 | 644 | 1159 | 501 | 377 | 3417 | 1920 | 638 | 443 |
| 2012 | 590 | 1025 | 464 | 330 | 2935 | 1973 | 664 | 434 |
Source: HPA Salmonella Dataset (Labbase2). Numbers may be higher than previously reported due to the inclusion of all isolates of Salmonella, rather than only faecal and lower gastrointestinal tract isolates.
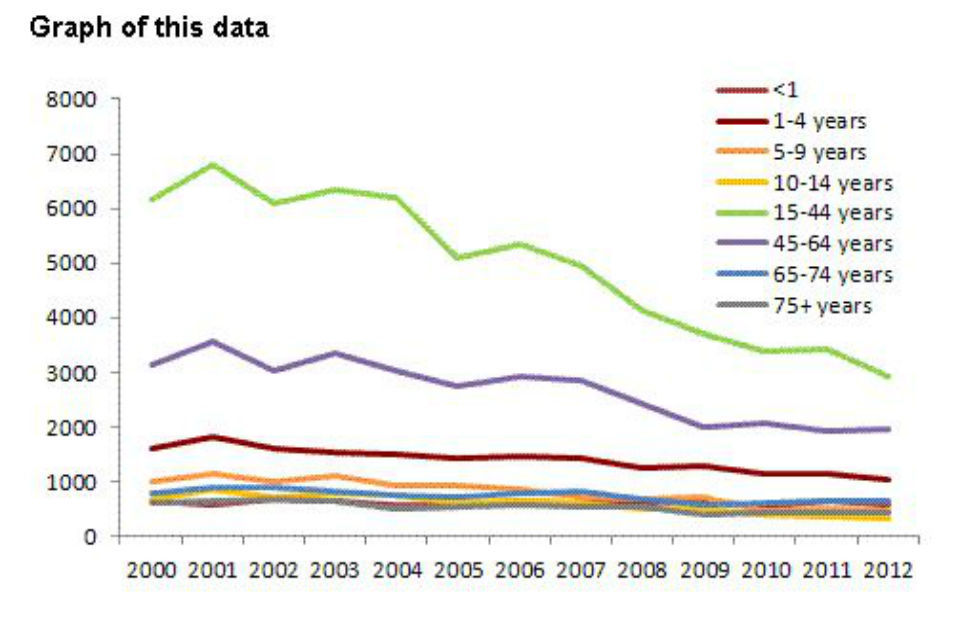
Salmonella cases recorded by age group and year.