Routes to Diagnosis: 2006 to 2017 results
Published 14 July 2020

© Crown copyright 2020
This publication is licensed under the terms of the Open Government Licence v3.0 except where otherwise stated. To view this licence, visit nationalarchives.gov.uk/doc/open-government-licence/version/3 or write to the Information Policy Team, The National Archives, Kew, London TW9 4DU, or email: psi@nationalarchives.gov.uk.
Where we have identified any third party copyright information you will need to obtain permission from the copyright holders concerned.
This publication is available at https://www.gov.uk/government/statistics/routes-to-diagnosis-2006-to-2017-results/routes-to-diagnosis-2006-to-2017-results
1. Background
Earlier diagnosis of cancers remains key in reducing the number of patients diagnosed with late stage cancers, which improves cancer survival. The NHS Long Term Plan sets out a commitment to diagnose more cancers earlier, for example through lowering the threshold for GP referral and reviewing the cancer screening programmes.
The Routes to Diagnosis project links multiple health datasets to categorise the pathways that lead to a patient’s diagnosis of cancer. The 8 routes, covering all those diagnosed with cancer between 2006 and 2017, can be used to monitor system changes in cancer pathways and give an indication of the success of efforts to improve patient outcomes.
The project has over a decade of data that has shown positive changes in how people are diagnosed, most notably a reduction in emergency presentations, which have the lowest survival estimates. There has been an increase in Two Week Wait (TWW) referrals that reflects healthcare policy.
One of the aspects highlighted by Routes to Diagnosis is the inequality in how people are diagnosed. A study by Herbert and others found that age and deprivation affect the route to diagnosis. Older people continue to make up the bulk of those diagnosed as an emergency presentation, and those who are more deprived are also more likely to be diagnosed through this route. The NHS Long Term Plan highlights the need to tackle inequality, and the data provided by Routes to Diagnosis is one of the ways to measure the success of these ventures.
2. Results
The latest results for 2017 show encouraging trends in several areas. For all malignant cancers (excluding non-melanoma skin cancer) emergency presentations continue to fall: down to 18.8% from 19.4% in 2016. This is equivalent to around 2,000 fewer people diagnosed as an emergency. Those referred with suspected cancer symptoms on a TWW pathway also continued the pattern of previous years – rising to 38.6%, up from 37.3% in 2016. Figure 1 shows the patterns for each route since 2006.

The pattern of the 8 routes are shown over time. Two week waits increase to just below 40% in 2017. Emergency presentations fall from 24% in 2006 to 19% in 2017.
Many cancer sites show similar results. Emergency presentations remain low for female breast cancer but with a slight increase that warrants continued attention. Lung cancer shows small decreases in those diagnosed through TWWs and GP referrals but emergency presentations do continue to fall. Colorectal and prostate cancers mirror the overall trend. The balance of routes for the biggest cancer sites in 2017 is shown in figure 2.
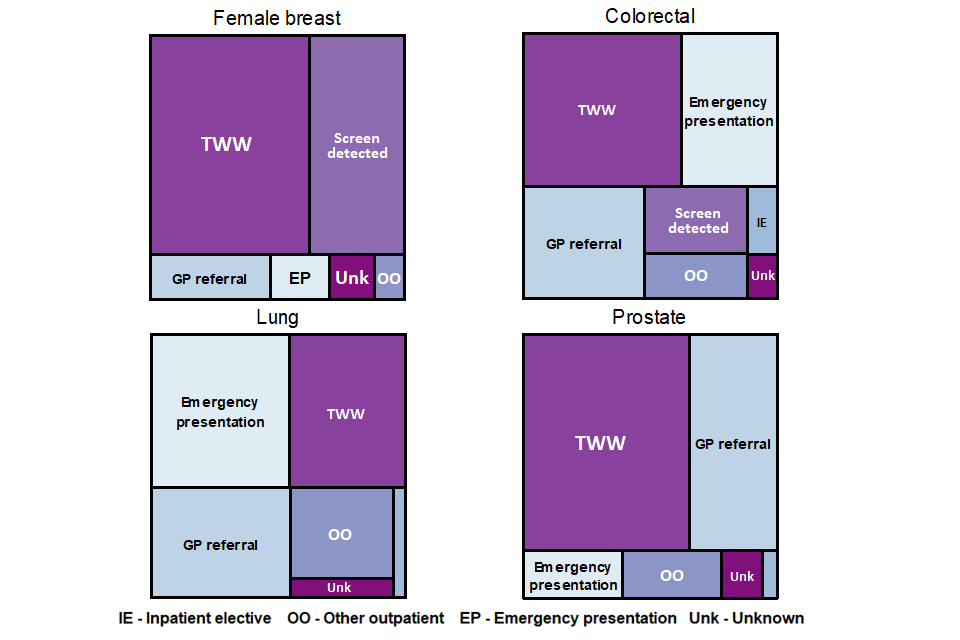
Four treemaps are shown for the route distribution in 2017 for the 4 biggest cancer sites. Two week waits represent the biggest proportion of patients diagnosed for all cancers sites, except for lung cancers.
The inequalities in previous releases persist with the 2017 data. These represent an area with some of the most potential to improve outcomes for patients and will be examined with future releases of data. Differences between cancer sites are also of interest and the groupings used for sites will be revised to better reflect current clinical guidance.
Find out more about Routes to Diagnosis and the data used in this report