R&D in the Creative Industries Survey
Published 18 September 2020

© Crown copyright 2020
This publication is licensed under the terms of the Open Government Licence v3.0 except where otherwise stated. To view this licence, visit nationalarchives.gov.uk/doc/open-government-licence/version/3 or write to the Information Policy Team, The National Archives, Kew, London TW9 4DU, or email: psi@nationalarchives.gov.uk.
Where we have identified any third party copyright information you will need to obtain permission from the copyright holders concerned.
This publication is available at https://www.gov.uk/government/publications/rd-in-the-creative-industries-survey/rd-in-the-creative-industries-survey
Research report
1. Executive summary
The UK’s creative industries contributed £111.7 billion to the UK economy in 2018 or 5.8% of total UK Gross Value Added. This report focuses on the R&D and innovation activities undertaken by creative industries in the UK and the constraints and enablers of that innovation activity. Research comprised a telephone survey of 625 respondents across nine creative industry sub-sectors and was undertaken before the COVID-19 lockdown.
1.1 Innovation activity
Half (51%) of creative industries firms had introduced new or significantly improved products or services in the last three years, over a quarter (29%) had introduced new or significantly improved products or services that were completely new to the market. Additionally, a third (31%) of firms had introduced new or improved forms of organisation, business structures or processes.
In total, three fifths (61%) of interviewed firms were classified as ‘innovative’, meaning they had introduced new or improved products, services, forms of organisation, business structures or processes in the last three years. IT, software & computer services firms were most likely to be innovative (68%), with architecture least likely (32%). Likelihood also increased with firm size, from 60% of firms with 1-9 employees, compared to 76% of firms with 10-49 employees and 83% of those with 50 or more.
In the last year, 71% of firms had used some form of intellectual property (IP) protections for their technology, designs, content, products or services, the most common being non-disclosure and confidentiality agreements (43%).
1.2 R&D activity
There are high levels of research and development (R&D) among creative industries firms. This report considers R&D in the creative industries using two existing definitions: the broad OECD Frascati definition, used in official international surveys, and the definition used by HMRC for tax credit purposes. More than half (55%) of firms had undertaken R&D using the broad Frascati definition but only 14% had done so using the definition for tax. IT, software & computer services firms were the most likely to have conducted R&D activity under either definition (71%), with museums, galleries & libraries least likely (27%).
Approaching one in 10 (8%) creative industries firms had a specific budget for R&D. Firms operating in crafts and music, performing & visual arts were most likely to have a specific R&D budget (13% and 12% respectively), followed by IT, software & computer services firms (11%).
Across all firms, the mean investment in R&D activities in the last year was £30,000. Internal R&D accounted for around 90% of total spend. IT, software & computer services firms also had the highest mean R&D spend at £52,000.
Just over one in 10 firms (13%) had funded or collaborated with a university or other external organisation on R&D activities in the last year. Design firms were least likely to have collaborated on any recent R&D activities; 4% had done so, rising to 16% of those in IT, software & computer services.
Creative industries firms had invested in a wide range of other innovation activities alongside R&D, with computer hardware or software the most common (71%), followed by licenses for technology, products or services (49%) and design (42%).
The most commonly cited benefits of R&D and innovation were with improved profitability and the quality of goods and services. Across most sectors relatively few creative industries firms identified any link between R&D and innovation and either exporting or growth in employment.
Firms that had not undertaken any R&D in the last 12 months were asked the main reason for this decision. Overall, two-fifths (38%) of this group deemed R&D to just not be relevant to their business activities, whilst around 1 in every 7 felt they did not have enough time/too busy (15%) or had no need for R&D (15%).
1.3 Constraints and enablers
The most commonly cited constraints on R&D and innovation activity were the market being dominated by established businesses, the costs of development being too high and availability of finance. These constraints were broadly similar across sectors.
Two thirds (65%) of firms stated that better access to public support schemes would have encouraged them to do more development activity and more than half (55%) would have been encouraged by improved access to network opportunities. Releasing these constraints would have helped firms conduct more development activity (54%), conduct it in a shorter timeframe (50%) or do better quality development activity (41%).
1.4 Funding and support
Access to increased public support was identified by firms as one of the key enablers for scaling, accelerating and improving the quality of innovation across the creative industries. Awareness of the R&D tax credit schemes among firms in creative industries is relatively high although take up – at less than 10% of firms – is limited in all sectors except IT, software & computer services. In IT, software & computer services both awareness (at 80% of firms) and use of the tax credit schemes (17%) were markedly higher than in any other sector. A small minority (3%) of firms had used other government or public sector funding initiatives for R&D or developing new products, services or processes.
2. Introduction
2.1 Background
The UK’s creative industries contributed £111.7 billion to the UK economy in 2018 or 5.8% of total UK Gross Value Added,[footnote 1] and are an important part of the UK’s research agenda. Analysis from the Enterprise Research Centre for Nesta suggests that the creative industries are as likely as manufacturing firms to conduct in-house and external research and development (R&D) and more likely than services firms to do so.[footnote 2]
However, while the creative industries are highly innovative, they face several challenges in conducting R&D, including that:
- their outputs are primarily intangible, and in many cases unique, meaning that traditional methods of managing and funding R&D may not always work in the creative industries;
- they are characterised by an abundance of SMEs spread across sectors. As a consequence, they can lack the capacity for strategic, cross-sectoral R&D, including linkages with universities;
- even where creative businesses are highly active in R&D, such activities may not be recognised as such by those undertaking it, meaning that not all of it is measured;
- a disproportionate percentage of their workforce are freelancers who may also be involved in R&D activity; and
- R&D activity may be less specialised/more embedded across different talent within the firm making it more difficult to identify separately.
Recognising the benefits of R&D to productivity and growth, the UK currently provides support for R&D and related activities through the tax system and innovation funding. This includes through the Creative Industries Sector Deal.
The support available through the Sector Deal includes:
- Audience of the Future Programme which is investing in businesses and researchers to develop new products and services that exploit immersive technologies.
- The Creative Industries Clusters Programme comprises nine R&D partnerships (also referred to as ‘Clusters’) - led by universities and based around clusters of creative industries businesses in the four nations of the UK.
To build on their understanding of R&D activities undertaken by creative businesses in the UK, the challenges creative businesses face in carrying out R&D activities, and any barriers to accessing public support and tax incentives, the Department for Digital, Culture, Media & Sport (DCMS) commissioned this research study. This report details findings from the study, carried out by OMB Research, to provide evidence on R&D activity in the creative industries. For this project the research team at OMB Research were supported by Professors Stephen Roper and Jim Love at the Enterprise Research Centre who provided input and oversight into the design and analysis stages. The Policy and Evidence Centre (PEC), led by Nesta, also provided input into the survey design.
The research consisted of a quantitative survey of organisations working within the creative industries, defined as those operating within the following Standard Industrial Classification (SIC) codes:
Table 2.1.1: Creative industries SIC definitions
| Sector | SIC | Description |
|---|---|---|
| Advertising and marketing | 70.21 | Public relations and communication activities |
| 73.11 | Advertising agencies | |
| 73.12 | Media representation | |
| Architecture | 71.11 | Media representation |
| Crafts | 32.12 | Manufacture of jewellery and related articles |
| Design | 74.1 | Specialised design activities |
| Film, TV, video, radio and photography | 59.11 | Motion picture, video and television programme production activities |
| 59.12 | Motion picture, video and television programme post-production | |
| 59.13 | Motion picture, video and television programme distribution | |
| 59.14 | Motion picture projection activities | |
| 60.1 | Radio broadcasting | |
| 60.2 | Television programme and broadcasting activities | |
| 74.2 | Photographic activities | |
| IT, software and computer services | 58.21 | Publishing of computer games |
| 58.29 | Other software publishing | |
| 62.01 | Computer programming activities | |
| 62.02 | Computer consultancy activities | |
| Publishing | 58.11 | Book publishing |
| 58.12 | Publishing of directories and mailing lists | |
| 58.13 | Publishing of newspapers | |
| 58.14 | Publishing of journals and periodicals | |
| 58.19 | Other publishing activities | |
| 74.3 | Translation and interpretation activities | |
| Museums, galleries and libraries | 91.01 | Library and archive activities |
| 91.02 | Museum activities | |
| Music, performing and visual arts | 59.2 | Sound recording and music publishing activities |
| 85.52 | Cultural education | |
| 90.01 | Performing arts | |
| 90.02 | Support activities to performing arts | |
| 90.03 | Artistic creation | |
| 90.04 | Operation of arts facilities |
2.2 Research objectives
To build on DCMS’s understanding of R&D activities undertaken by creative businesses within the UK, the research aimed to understand the following key areas:
- The current R&D activities in the creative industries;
- The challenges and enablers creative businesses experience in performing R&D;
- The level of uptake of public R&D funding and support;
- Any barriers to access to public funding and incentives through the tax system;
- The benefits of R&D activities for creative industries businesses that undertake it.
2.3 Methodology
The survey was conducted using Computer Assisted Telephone Interviewing (CATI) as this is proven to be an effective means of reaching the appropriate personnel within a business, with a much better response rate than online interviewing. Within each organisation, interviews were conducted with a member of the senior management team or someone with responsibility for making decisions about the running of the business.
In total, 625 interviews were completed. Interviews were conducted between 13th February and 31st March 2020 and lasted an average of 18 minutes. The questionnaire was fully piloted prior to commencing main fieldwork. A copy of the questionnaire used can be found in Annex B.
The majority of the interviewing was conducted prior to the UK COVID-19 outbreak and as such, for the most part, responses will not be impacted by its effects. By way of illustration, just 18 interviews were conducted after the UK ‘lockdown’ (implemented on 20th March). However, the COVID-19 lockdown did significantly obstruct the latter stages of fieldwork meaning the target number of interviews (725) was not achieved.
2.4 Sampling approach
The population of interest for this survey was UK businesses operating across the creative industries sectors detailed in table 2.1.1. The research was designed to cover each of the nine sectors listed, and results in this report are shown by sector. Public sector organisations were excluded; the sample therefore consisted of private sector businesses, charities and not for profit organisations. The sample was sourced from Dun & Bradstreet.
We acknowledge that defining the creative industries using traditional SIC codes can mean that the sample does not fully capture the whole sector. This is because traditional SIC codes can include some firms in established creative industries SIC codes that are not genuinely engaged in creative activities and, conversely, other firms that are engaged in creative activities may not be classified as being in one of the established creative industries SIC codes.
A disproportionate stratified random sampling approach was adopted, with businesses in the target population stratified by size (number of employees) and sector. Organisations in some sectors and with larger employee numbers were intentionally over-sampled to ensure they were adequately represented and to allow more robust sub-analysis.
The final data was then weighted by business profile (size and sector) using the DCMS Sectors Economic Estimates 2017 published in January 2020 (based on ONS Annual Business Survey).
2.5 Analysis and reporting conventions
Throughout this report results have been analysed by sector and business size. To account for the disproportionate sampling approach and ensure results are representative of the overall creative industries population, all data was weighted based on business size and sector. Unweighted bases (the number of responses from which the findings are derived) are displayed on tables and charts as appropriate to give an indication of the robustness of results.
When looking at the results by sector and other key analysis variables in some instances the base sizes are fairly low and as such caution should be taken when making inferences. To aid with this aspect we have flagged all analysis where the base size is less than 30 with a ‘!’ symbol.
Where possible, only differences which are statistically significant are mentioned in the report commentary. For example, if one percentage is said to be higher than another, that means the difference between the two percentages is statistically significant. All significance testing was carried out at a 95% confidence level (p < 0.05)[footnote 3].
When interpreting the data presented in this report, please note that results may not sum to 100% due to rounding and/or respondents being able to select more than one answer to a question.
3. Innovation activity
3.1 Overview
Producing novel outputs and services is the essence of any enterprise in the creative industries. This in turn makes the meaning of ‘innovation’ a complex one in this sector. Creative industries are characterised by the intangible nature of many inputs and outputs of their activity, and for the frequently close and bespoke relationships between the creators and users of their products and services, characteristics shared with many service industries but infrequently encountered in manufacturing. This study focusses on the innovative activity of enterprises in the creative industries following internationally accepted definitions used in surveys of both manufacturing and services, an approach which may have the effect of downplaying the novelty inherent in the respondents’ outputs.
The definitions of innovation follow those of the UK Innovation Survey, which is in turn based on the definitions provided by the OECD’s Oslo Manual[footnote 4], the international reference guide for collecting and using data on innovation. A respondent is regarded as being innovative if they have introduced a new or significantly improved product during the last three years, or had introduced any new or significantly improved forms of organisation, business structures or processes over the last three years. The focus is therefore on the commercial introduction of any innovation rather than on its technological content. Questions were also asked on how novel any new product/service or process was, and the nature of intellectual property (IP) protection used, if any.
Overall, the results suggest that creative industries are generally highly innovative, but with substantial variations between the different sectors. These differences inevitably reflect the nature of business activity in each sector. IT, software & computer services report particularly high levels of innovative activity, while architecture is markedly less so. Intellectual property (IP) protection is commonplace among creative industries, carried out by over 70% of respondents. While formal IP protection mechanisms such as patents, copyrights and trademarks are used relatively infrequently, informal means of IP protection, are frequently used, again with substantial inter-sectoral variations.
3.2 Current innovation activity
Half (51%) of firms had introduced new or significantly improved products or services in the last three years, over a quarter (29%) had introduced new or significantly improved products or services that were completely new to the market. Additionally, a third (31%) of firms had introduced new or improved forms of organisation, business structures or processes.
In total, three fifths (61%) of interviewed firms were classified as ‘innovative’, meaning they had introduced any new or improved products, services, forms of organisation, business structures or processes in the last three years. Comparing these results to the UK Innovation Survey (UKIS) 2019, 38% of UK businesses were innovative, indicating creative industries firms to have considerably higher levels of innovation.
Table 3.2.1: Proportion that have introduced new or significantly improved products, services or processes in last three years
| Total | Advertising & marketing | Architecture | Crafts (!) | Design | |
|---|---|---|---|---|---|
| Base: All respondents | 625 | 86 | 93 | 19 | 96 |
| New/improved products/services | 51% | 47% | 22% | 54% | 35% |
| New to market | 29% | 22% | 9% | 33% | 12% |
| Just new to business | 21% | 25% | 12% | 21% | 21% |
| New/improved organisation/ business structures/processes | 31% | 30% | 19% | 33% | 25% |
| Net: Innovative | 61% | 56% | 32% | 59% | 46% |
Table 3.2.1 (continued)
| Film, TV, video, radio & photography | IT, software & computer services | Publishing | Museums, galleries & libraries (!) | Music, performing & visual arts | |
|---|---|---|---|---|---|
| Base: All respondents | 67 | 126 | 41 | 24 | 73 |
| New/improved products/services | 52% | 62% | 43% | 29% | 39% |
| New to market | 19% | 41% | 27% | 21% | 17% |
| Just new to business | 32% | 20% | 13% | 8% | 21% |
| New/improved organisation/ business structures/processes | 29% | 32% | 44% | 25% | 38% |
| Net: Innovative | 61% | 68% | 63% | 45 |
IT, software & computer services firms were most likely to be innovative (68%), with architecture least likely (32%). Likelihood also increased with firm size, from 60% of firms with 1-9 employees, compared to 76% of firms with 10-49 employees and 83% of those with 50 or more.
In the last year, 71% of firms had used some form of intellectual property (IP) protections for their technology, designs, content, products or services, the most common being non-disclosure and confidentiality agreements (43%).
Table 3.2.2: Proportion that have used IP protection in last year
| Total | Advertising & marketing | Architecture | Crafts (!) | Design | |
|---|---|---|---|---|---|
| Base: All respondents | 625 | 86 | 93 | 19 | 96 |
| Non-disclosure & confidentiality agreements | 43% | 52% | 27% | 10% | 29% |
| Unique experience | 33% | 39% | 29% | 38% | 26% |
| Informal means of protecting IP | 31% | 20% | 22% | 44% | 25% |
| Copyrights | 27% | 17% | 54% | 23% | 24% |
| Trademarks | 12% | 11% | 4% | 21% | 18% |
| Unregistered design rights | 10% | 8% | 18% | 21% | 15% |
| Patents | 4% | 4% | 0% | 5% | 2% |
| Registered designs | 4% | 7% | 7% | 23% | 8% |
| Net: Any IP protection | 71% | 68% | 74% | 64% | 67% |
| None of the above | 28% | 31% | 26% | 36% | 33% |
Table 3.2.2 (continued)
| Film, TV, video, radio & photography | IT, software & computer services | Publishing | Museums, galleries & libraries (!) | Music, performing & visual arts | |
|---|---|---|---|---|---|
| Base: All respondents | 67 | 126 | 41 | 24 | 73 |
| Non-disclosure & confidentiality agreements | 35% | 54% | 24% | 28% | 22% |
| Unique experience | 43% | 32% | 32% | 43% | 29% |
| Informal means of protecting IP | 35% | 36% | 25% | 33% | 19% |
| Copyrights | 39% | 24% | 41% | 18% | 22% |
| Trademarks | 9% | 13% | 7% | 19% | 8% |
| Unregistered design rights | 4% | 11% | 9% | 14% | 9% |
| Patents | 3% | 5% | 1% | 3% | 4% |
| Registered designs | 3% | 2% | 0% | 14% | 6% |
| Net: Any IP protection | 76% | 75% | 71% | 78% | 58% |
| None of the above | 24% | 25% | 29% | 22% | 42% |
There were some differences in the types of IP protections used across creative industries sectors. For instance, IT, software & computer services firm were most likely to have used non-disclosure and confidentiality agreements (54%), architecture were most likely to have used copyright (54%), and crafts were most likely to have used registered designs (23%) and unregistered design rights (21%).
4. R&D activity
4.1 Overview
There are high levels of research and development (R&D) among creative industries firms, with 55% of all creative industries firms having conducted R&D in the last year. Comparative data from the UKIS 2019 showed that just 16% of all UK businesses had invested in internal R&D.
This report considers R&D in the creative industries using two existing definitions: the broad OECD Frascati definition, used in official international surveys, and the definition used by HMRC for tax credit purposes. The broad definition describes R&D as covering research and experimental development and comprising of creative and systematic work to increase knowledge. Whilst the tax definition describes activities to advance science or technology by resolving scientific or technological uncertainties (full descriptions are detailed in section 4.2). As might be expected, while more than half (55%) of respondents indicated that they perform R&D using the broad Frascati definition, only a small minority (14%) recognised any R&D activity using the R&D definition for tax.
Overall, the results suggest that enterprises in the creative industries do perform R&D but tend to spend relatively little on the activity and tend not to have a specific R&D budget. Among the 55% of respondents who indicated that they perform R&D (using the broad Frascati definition) the median annual R&D spend was £20,000, this was highly skewed towards one sector (IT, software & computer services).
Collaboration with outside organisations on R&D is very limited, a pattern which is relatively consistent across all sectors. By contrast investment in other activities (mainly intangibles) for future innovation activity is widespread, although very variable across sectors. Investment in computer hardware or software was the most common (71%) other investment, followed by licenses for technology, products or services (49%) and design (42%).
Of those that had done no R&D in the last year (under the broad Frascati definition) more than half felt that R&D was either irrelevant to their business or they simply had no need for it: lack of funds or government support was rarely mentioned.
There is a vast body of academic evidence suggesting, in general, a positive and causal relationship between R&D expenditure (sometimes described as investment in innovation) and innovation outputs. While creative industries use a variety of (mainly intangible) inputs in creating new products and services, R&D can still represent an important innovative input. However, there is also evidence that creative businesses perceive R&D differently from those in other sectors, seeing R&D as something related more to investments in projects and content rather than directly to technologies and innovation in processes and products. “R&D has a very different meaning in the creative industries … in effect constituting a normal business model, not an exceptional (i.e. un-incentivised) activity”[footnote 5].
This means that the definition of R&D is crucial: what is typically seen elsewhere as R&D may not be regarded as such within the creative industries, with the result that it may be under-reported and potentially under-supported in policy terms[footnote 6]
4.2 4.2 Current R&D activities
In order to more accurately capture R&D activity within the creative industries, the survey incorporated two different definitions of R&D.
Firstly, a broad description of R&D based on the OECD’s Frascati Manual[footnote 7]:
Research and Development’ (R&D) covers three types of activity; basic research, applied research and experimental development. It comprises creative and systematic work undertaken in order to increase the stock of knowledge, and in order to devise new applications of available knowledge. R&D does not include routine changes to existing products, services or processes. Over the last year, did your business/organisation undertake any R&D? Please include any R&D undertaken within your business/organisation, as well as R&D conducted by others but purchased by your business/organisation
Slightly later in the survey, respondents were also asked about a more defined description of R&D, again based on the OECD’s Frascati Manual, which is the basis for the definition used for tax purposes[footnote 8]:
Over the last year, would you say your business/organisation has undertaken any activities which aim to advance science or technology by resolving scientific or technological uncertainties? An advance in science or technology means an advance in overall knowledge or capability in a field of science or technology. The purpose of this may be for example, to introduce a new product, service or process, or to significantly improve an existing product, service or process.
As detailed in Figure 4.2.1, more than half (55%) of firms had undertaken R&D using the broad Frascati definition, and only 14% had done so under the tax definition.
Figure 4.2.1: Proportion that have undertaken R&D in the last year - total

Base: All respondents (625)
Table 4.2.1: Proportion that have undertaken R&D in the last year – by sector
| Advertising & marketing | Architecture | Crafts (!) | Design | |
|---|---|---|---|---|
| Base: All respondents | 86 | 93 | 19 | 96 |
| Broad Frascati definition | 32% | 41% | 54% | 36% |
| Tax definition | 7% | 18% | 0% | 5% |
| Net: Either definition | 34% | 45% | 54% | 38% |
Table 4.2.1 (continued)
| Film, TV, video, radio & photography | IT, software & computer services | Publishing | Museums, galleries & libraries (!) | Music, performing & visual arts | |
|---|---|---|---|---|---|
| Base: All respondents | 67 | 126 | 41 | 24 | 73 |
| Broad Frascati definition | 52% | 69% | 40% | 24% | 40% |
| Tax definition | 4% | 21% | 9% | 3% | 7% |
| Net: Either definition | 54% | 71% | 42% | 27% | 40% |
IT, software & computer services firms were the most likely to have conducted R&D activity under either definition (71%), with museums, galleries & libraries least likely (27%). Although a fifth (18%) of architecture firms had conducted R&D using the tax definition, those operating in crafts and film, TV, radio & photography were more likely to have done so using the broad definition (54% and 52% respectively).
Those that had conducted R&D (under the broad Frascati definition) were asked whether this activity had been undertaken within their business (internal) or performed by others outside of their business (external). As detailed in Table 4.2.2, internal R&D was much more common than external (94% and 21% having undertaken each type respectively).
Table 4.2.2: Proportion of R&D active firms (broad Frascati definition) that had undertaken internal and external R&D
| Total | Advertising & marketing (!) | Architecture | Crafts (!) | Design | |
|---|---|---|---|---|---|
| Base: All undertaken R&D (broad) | 294 | 29 | 41 | 10 | 35 |
| Internal | 94% | 86% | 97% | 90% | 97% |
| External | 21% | 40% | 29% | 24% | 11% |
Table 4.2.2 (continued)
| Film, TV, video, radio & photo-graphy | IT, software & computer services | Publishing (!) | Museums, galleries & libraries (!) | Music, performing & visual arts | |
|---|---|---|---|---|---|
| Base: All undertaken R&D (broad) | 33 | 87 | 18 | 8 | 33 |
| Internal | 90% | 95% | 100% | 100% | 90% |
| External | 15% | 18% | 32% | 58% | 39% |
R&D active firms (under the broad Frascati definition) were also asked to estimate the proportion of their total R&D spend that came from internal and external R&D activity. At the total level, internal activity accounted for an average of 90% of these firms’ total R&D spend, with external activity accounting for 10%. There were relatively few differences by sector.
Firms were also asked whether they had a specific budget for R&D and to estimate how much they had invested in R&D activities in the last year. Approaching one in 10 (8%) creative industries firms had a specific budget for R&D. Across creative industries firms who had conducted R&D in the last year, the median investment in R&D activities in the last year was £20,000.
Table 4.2.3: Proportion with R&D budget / Financial investment in R&D in the last year
| Total | Advertising & marketing | Architecture | Crafts (!) | Design | |
|---|---|---|---|---|---|
| Base: All respondents | 625 | 86 | 93 | 19 | 96 |
| Specific budget for R&D | 8% | 3% | 2% | 13% | 3% |
| Mean R&D investment - all firms | £30,000 | £8,000 | £12,000 | £6,000 | £3,000 |
| Median R&D investment - all firms | £0 | £0 | £0 | £0 | £0 |
| Base: All undertaken R&D (Frascati) | 294 | 29 | 41 | 10 | 35 |
| Mean R&D investment - R&D active | £57,000 | £27,000 | £33,000 | £12,000 | £8,000 |
| Median R&D investment - R&D active | £20,000 | £5,000 | £6,000 | £4,000 | £5,000 |
Table 4.2.3 (continued)
| Film, TV, video, radio & photo-graphy | IT, software & computer services | Publishing | Museums, galleries & libraries (!) | Music, performing & visual arts | |
|---|---|---|---|---|---|
| Base: All respondents | 67 | 126 | 41 | 24 | 73 |
| Specific budget for R&D | 3% | 11% | 9% | 0% | 12% |
| Mean R&D investment - all firms | £16,000 | £52,000 | £13,000 | £13,000 | £6,000 |
| Median R&D investment - all firms | £0 | £9,000 | £0 | £0 | £0 |
| Base: All undertaken R&D (Frascati) | 33 | 87 | 18 | 8 | 33 |
| Mean R&D investment - R&D active | £33,000 | £78,000 | £34,000 | £54,000 | £16,000 |
| Median R&D investment - R&D active | £5,000 | £30,000 | £5,000 | £85,000 | £5,000 |
Firms operating in crafts and music, performing & visual arts were most likely to have a specific R&D budget (13% and 12% respectively), followed by IT, software & computer services firms (11%). IT, software & computer services firms also had the highest mean R&D spend, at £78,000 (among those conducting R&D).
Creative industries firms were also asked whether their R&D activity included each of the following types:
Basic research – by that I mean work, undertaken primarily to acquire new knowledge without a specific application I mind.’ Applied research – by that I mean work undertaken to acquire new knowledge with a specific application in mind.’ Experimental development – by that I mean work drawing on knowledge gained from research or practical experience, for the purpose of creating new or improved products or processes.’
As detailed in Table 4.2.4, R&D active firms had engaged in a range of activity in the last 12 months; two fifths (40%) had undertaken basic research, 80% had undertaken applied research and 69% had undertaken experimental development. On average, basic research accounted for 18% of these firms’ total R&D spend, applied research accounted for 47% and experimental development accounted for 30%.
Table 4.2.4: Types of R&D activity undertaken / Mean percentage of total R&D spend accounted for by each
| Total | Advertising & marketing (!) | Architecture | Crafts (!) | Design | ||
|---|---|---|---|---|---|---|
| Basic research | Have undertaken | 40% | 56% | 44% | 62% | 55% |
| % of total spend | 18% | 35% | 22% | 18% | 31% | |
| Applied research | Have undertaken | 80% | 73% | 85% | 90% | 66% |
| % of total spend | 47% | 45% | 56% | 46% | 31% | |
| Experimental development | Have undertaken | 69% | 53% | 56% | 90% | 60% |
| % of total spend | 30% | 20% | 19% | 15% | 17% |
Table 4.2.4 (continued)
| Film, TV, video, radio & photography | IT, software & computer services | Publishing (!) | Museums, galleries & libraries (!) | Music, performing & visual arts | ||
|---|---|---|---|---|---|---|
| Basic research | Have undertaken | 52% | 35% | 20% | 16% | 49% |
| % of total spend | 25% | 13% | 13% | 14% | 31% | |
| Applied research | Have undertaken | 60% | 87% | 67% | 74% | 64% |
| % of total spend | 35% | 52% | 53% | 31% | 27% | |
| Experimental development | Have undertaken | 58% | 75% | 55% | 74% | 66% |
| % of total spend | 33% | 33% | 28% | 33% | 29% |
Base: All undertaken R&D (broad Frascati definition) (Base, Don’t know) – Total (294, 7-9%), Advertising (29, 0%), Architecture (41, 0-3%), Crafts (10, 0%), Design (35, 3-8%), Film (33, 0-3%), IT (87, 0-1%), Publishing (18, 0-8%), Museums (8, 5%), Music (33 0%)
Just over one in 10 firms (13%) had funded or collaborated with a university or other external organisation on R&D activities in the last year.
Table 4.2.5: Proportion that had funded or collaborated with university/other external organisation on R&D activities in the last year
| Total | Advertising & marketing | Architecture | Crafts (!) | Design | |
|---|---|---|---|---|---|
| Base: All respondents | 625 | 86 | 93 | 19 | 96 |
| Have funded/collaborated | 13% | 13% | 15% | 13% | 4% |
Table 4.2.5 (continued)
| Film, TV, video, radio & photography | IT, software & computer services | Publishing | Museums, galleries & libraries (!) | Music, performing & visual arts | |
|---|---|---|---|---|---|
| Base: All respondents | 67 | 126 | 41 | 24 | 73 |
| Have funded/collaborated | 12% | 16% | 10% | 10% | 11% |
Design firms were least likely to have collaborated on any recent R&D activities; 4% had done so, rising to 16% of those in IT, software & computer services.
4.3 Investment in other innovation activities
Firms were asked whether, for the purposes of current or future new product or service development activities, they had invested in a number of activities over the last year. As detailed in Figure 4.3.1, firms had invested in a wide range of other innovation activities, with computer hardware or software the most common (71%), followed by licenses for technology, products or services (49%) and design (42%).

Figure 4.3.1: Proportion that had invested in other innovation activities - total Base: All respondents (Base) – Total (625) As detailed in Table 4.3.1, investments in other innovation activities vary considerably by sector. Investment in design was highest among the architecture sector (56%) and lowest among film, TV, video, radio & photography firms (26%).
Table 4.3.1: Proportion that had invested in other innovation activities - by sector
| Advertising & marketing | Architecture | Crafts (!) | Design | |
|---|---|---|---|---|
| Base: All respondents | 86 | 93 | 19 | 96 |
| Computer hardware or software | 69% | 74% | 33% | 68% |
| Licenses for technology or products/services | 56% | 52% | 23% | 51% |
| Any type of design | 31% | 56% | 44% | 37% |
| Changes to marketing methods or product launch advertising | 39% | 20% | 38% | 33% |
| Training related specifically to developing new products/services | 25% | 28% | 23% | 18% |
| Market research | 27% | 16% | 28% | 21% |
| Advanced machinery & equipment | 12% | 22% | 44% | 17% |
| No investment (or don’t know) | 12% | 13% | 21% | 13% |
Table 4.3.1 (continued)
| Film, TV, video, radio & photography | IT, software & computer services | Publishing | Museums, galleries & libraries (!) | Music, performing & visual arts | |
|---|---|---|---|---|---|
| Base: All respondents | 67 | 126 | 41 | 24 | 73 |
| Computer hardware or software | 66% | 79% | 60% | 43% | 46% |
| Licenses for technology or products/services | 46% | 54% | 53% | 19% | 27% |
| Any type of design | 26% | 49% | 44% | 33% | 34% |
| Changes to marketing methods or product launch advertising | 29% | 28% | 48% | 52% | 36% |
| Training related specifically to developing new products/services | 17% | 32% | 19% | 5% | 19% |
| Market research | 20% | 29% | 35% | 24% | 19% |
| Advanced machinery & equipment | 33% | 15% | 10% | 9% | 22% |
| No investment (or don’t know) | 17% | 11% | 13% | 37% | 29% |
Those who had invested in design were also asked to estimate how much they had spent on this during the last 12 months. The figures below show the mean and median based on all respondents (with those not investing in design treated as £0), as well as for just those firms who had spent on design. Among all firms that had spent on design in the last year, the median spend was £15,000.
Table 4.3.2: Estimated spend on design in the last 12 months
| Total | Advertising & marketing | Architecture | Crafts (!) | Design | |
|---|---|---|---|---|---|
| Base: All respondents | 625 | 86 | 93 | 19 (!) | 96 |
| Mean - all firms | £18,000 | £10,000 | £96,000 | £6,000 | £30,000 |
| Median - all firms | £0 | £0 | £0 | £0 | £0 |
| Base: All invested in design | 259 | 27 (!) | 54 | 8 (!) | 36 |
| Mean – invested in design | £46,000 | £36,000 | £194,000 | £17,000 | £88,000 |
| Median – invested in design | £15,000 | £5,000 | £30,000 | £5,000 | £10,000 |
Table 4.3.2 (continued)
| Film, TV, video, radio & photography | IT, software & computer services | Publishing | Museums, galleries & libraries (!) | Music, performing & visual arts | |
|---|---|---|---|---|---|
| Base: All respondents | 67 | 126 | 41 | 24 (!) | 73 |
| Mean - all firms | £6,000 | £16,000 | £5,000 | £3,000 | £3,000 |
| Median - all firms | £0 | £0 | £0 | £0 | £0 |
| Base: All invested in design | 20 | 61 | 17 | 6 | 30 |
| Mean – invested in design | £28,000 | £36,000 | £11,000 | £8,000 | £10,000 |
| Median – invested in design | £5,000 | £18,000 | £10,000 | £5,000 | £5,000 |
Although mean spend was significantly higher among architecture firms investing in design (£194,000), this was inflated by a minority of high spending firms, and the median was £30,000.
4.4 Reasons for not undertaking R&D
Those that had not undertaken any R&D in the last 12 months (under the broad Frascati definition) were asked the main reason for this decision. Open responses were recorded and coded into common themes for ease of analysis. Figure 4.4.1 below shows the top reasons stated for not undertaking R&D (only responses mentioned by 3% or more are shown). Overall, two-fifths (38%) of this group deemed R&D to just not be relevant to their business activities, whilst around 1 in every 7 felt they did not have enough time/too busy (15%) or had no need for R&D (15%).
Figure 4.4.1: Reasons for deciding not to undertake R&D in the last 12 months - total

Base: All that have not undertaken R&D (Base, Don’t know) – Total (331, 5%)
A selection of illustrative verbatim comments given are detailed below.
Figure 4.4.2: Reasons for deciding not to undertake R&D in the last 12 months - selected verbatim comments
We are driven by market forces. The demand is pushing existing supply chains and not creating new ones
(Advertising & marketing, 1-9 employees)
The market we are in has new products all the time and they are designed and built by multi-billion-dollar operations. For us to compete against their R&D budgets is not likely to be fruitful
(IT, software & computer services, 1-9 employees)
We have operated in a niche market for the last three decades. We are one of the leaders in our industry. There is always room for improvement, but we are comfortable delivering a service to clients and don’t necessarily need any change
(Film, TV, video, radio & photography, 10-49 employees)
I just do graphic design, unless I develop new software (which I just buy currently). I can’t see how R&D activities would apply to my business
(Design, 1-9 employees)
There is no requirement for it, we basically help design websites, conferences etc where the processes are fairly static, so there is no need for it
(Design, 1-9 employees)
We are a museum. The main purpose is to provide a home for our material and adding to our collection from time to time, but we don’t initiate research
(Museums, galleries & libraries, 1-9 employees)
We do not have sufficient funds to undertake R&D and there is really no need for us.
(Architecture, 1-9 employees) >As photographers, any results or products of R&D are introduced to us. As the market changes we take lead from it. The manufacturers are the drivers
(Film, TV, video, radio & photography, 1-9 employees)
Historically, any R&D we have done has been driven by clients’ requests, so we are more reactive to what our clients are asking us to do
(Design, 1-9 employees)
We are not big enough for the time investment
(Publishing, 10-49 employees)
5. Challenges and enablers
5.1 Overview
Undertaking innovation is a risky and challenging activity for any enterprise. In this section we consider a range of factors which may either be constraining or enabling firms’ innovative activity. Constraints on innovation activity may arise either from a lack of resources – skills or finance for example – or relate to firms’ access to appropriate technology or market opportunities. Potential enablers of innovation include public support such as grants or subsidies or access to technological or informational resources. Support with protecting intellectual property may also encourage innovation by increasing firms’ confidence that they will be able to maximise the benefits from innovation investments. In considering both the constraints and enablers of innovation the survey questions used were similar to those used in the UK Innovation Survey.
The main constraints on firms’ innovation activity related to the costs of innovation, the availability of finance and markets dominated by established businesses. These constraints were common across all creative industries although the proportion of firms identifying each constraint varied somewhat. Given the emphasis firms place on cost and finance constraints on innovation it is perhaps unsurprising that one of the key enablers identified was access to public support schemes. Access to a greater range of network opportunities – e.g. conferences, trade fairs – was also a commonly identified innovation enabler. Firms reported that releasing these constraints would encourage more, and faster, R&D and innovation as well as improving the quality of the innovations developed.
5.2 Factors constraining development activity
Respondents were asked to rate several factors in terms of the impact they had had on their new product, service or process development activity in the last 12 months. A scale of 1-5 was used, with 1 meaning no impact at all, and 5 meaning a significant impact. As detailed in Figure 5.2.1, the factors perceived as having the most significant impact on development activity were the market being dominated by established businesses, the costs of development being too high and availability of finance.
Figure 5.2.1: Factors constraining development activity (full distribution) - total
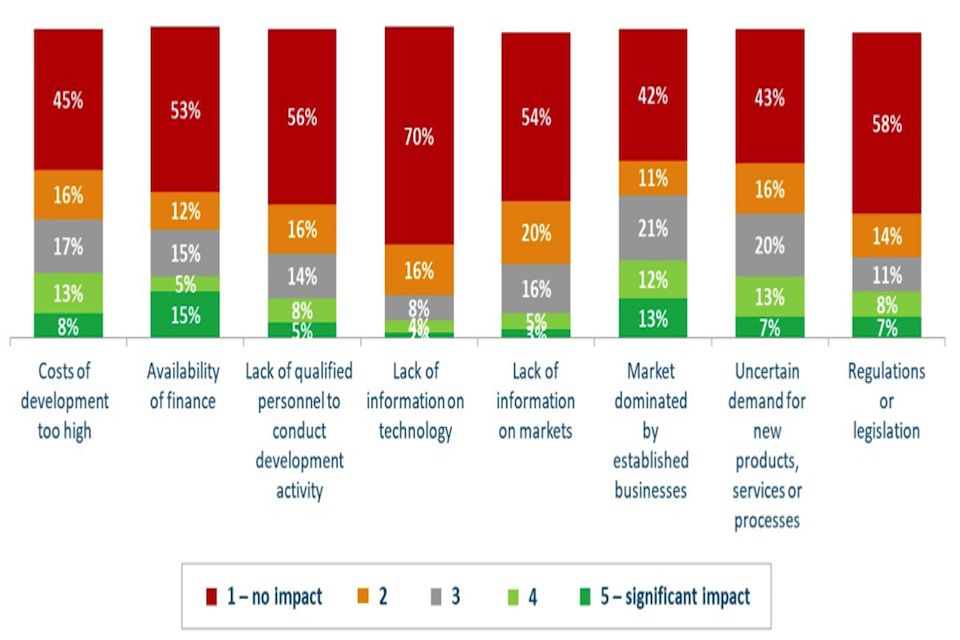
Base: All respondents (Base, Don’t know) – Total (625, 1-2%)
Table 5.2.1 details the proportion of firms scoring each factor as being impactful on their development activity within the last 12 months (4-5 out of 5). Colour coding has been applied to more clearly illustrate the distribution of results, with higher proportions shaded darker red.
Table 5.2.1: Factors constraining development activity (proportion scoring 4-5)
| % scoring 4-5 | Total | Advertising & marketing | Architecture | Crafts (!) | Design |
|---|---|---|---|---|---|
| Base: All respondents | 625 | 86 | 93 | 19 | 96 |
| Market dominated by established businesses / organisations | 25% | 31% | 24% | 21% | 22% |
| Costs of development too high | 21% | 24% | 30% | 31% | 21% |
| Availability of finance | 20% | 25% | 20% | 44% | 19% |
| Uncertain demand for new products, services or processes | 20% | 13% | 14% | 15% | 17% |
| Regulations or legislation | 15% | 11% | 26% | 10% | 10% |
| Lack of qualified personnel to conduct development activity | 13% | 17% | 8% | 18% | 10% |
| Lack of information on markets | 8% | 7% | 5% | 13% | 5% |
| Lack of information on technology | 6% | 8% | 5% | 13% | 4% |
Table 5.2.1 (continued)
| % scoring 4-5 | Film, TV, video, radio & photography | IT, software & computer services | Publishing | Museums, galleries & libraries (!) | Music, performing & visual arts |
|---|---|---|---|---|---|
| Base: All respondents | 67 | 126 | 41 | 24 | 73 |
| Market dominated by established businesses / organisations | 22% | 24% | 24% | 1% | 30% |
| Costs of development too high | 20% | 20% | 37% | 25% | 14% |
| Availability of finance | 28% | 15% | 23% | 29% | 25% |
| Uncertain demand for new products, services or processes | 15% | 22% | 24% | 4% | 23% |
| Regulations or legislation | 12% | 17% | 13% | 9% | 13% |
| Lack of qualified personnel to conduct development activity | 12% | 15% | 13% | 22% | 5% |
| Lack of information on markets | 13% | 9% | 3% | 3% | 4% |
| Lack of information on technology | 9% | 6% | 6% | 1% | 4% |
While the factors that constrained development activity varied across sectors, the top four constraints were evident in almost all.
5.3 Potential enablers
Respondents were asked whether a range of support or improvements would encourage their business/organisation to undertake (more) R&D or new product, service or process development in the future. Two thirds (65%) of firms stated that better access to public support schemes would have encouraged them to do more development activity and more than half (55%) would have been encouraged by improved access to network opportunities.
Table 5.3.1: Support/enablers to encourage R&D/innovation (proportion answering ‘yes’)
| Total | Advertising & marketing | Architecture | Crafts (!) | Design | |
|---|---|---|---|---|---|
| Base: All respondents | 625 | 86 | 93 | 19 | 96 |
| Access to public support schemes e.g. grants/subsidies | 65% | 59% | 64% | 74% | 54% |
| Access to network opportunities e.g. conferences, trade fairs | 55% | 60% | 52% | 44% | 57% |
| Support to find required skills/ expertise | 41% | 41% | 44% | 38% | 44% |
| Help with costs of IP protection | 41% | 25% | 29% | 38% | 41% |
| Advice on IP protection | 36% | 26% | 33% | 44% | 38% |
| Access to research centres, universities, higher education institutions | 36% | 38% | 43% | 18% | 32% |
| Access to consultants, commercial labs, private R&D institutes | 29% | 30% | 40% | 33% | 27% |
| Public research facilities that can be rented | 22% | 28% | 24% | 13% | 25% |
| Something else | 8% | 3% | 6% | 5% | 4% |
| None of these/Don’t know | 21% | 21% | 19% | 15% | 26% |
Table 5.3.1 (continued)
| Film, TV, video, radio & photography | IT, software & computer services | Publishing | Museums, galleries & libraries (!) | Music, performing & visual arts | |
|---|---|---|---|---|---|
| Base: All respondents | 67 | 126 | 41 | 24 | 73 |
| Access to public support schemes e.g. grants/subsidies | 66% | 69% | 72% | 38% | 60% |
| Access to network opportunities e.g. conferences, trade fairs | 58% | 57% | 60% | 14% | 42% |
| Support to find required skills/ expertise | 38% | 40% | 51% | 37% | 35% |
| Help with costs of IP protection | 43% | 49% | 28% | 28% | 27% |
| Advice on IP protection | 40% | 39% | 32% | 27% | 25% |
| Access to research centres, universities, higher education institutions | 38% | 37% | 31% | 29% | 31% |
| Access to consultants, commercial labs, private R&D institutes | 29% | 28% | 31% | 9% | 27% |
| Public research facilities that can be rented | 35% | 17% | 16% | 11% | 25% |
| Something else | 6% | 10% | 8% | 1% | 11% |
| None of these/Don’t know | 20% | 18% | 20% | 61% | 27% |
Preferred types of support varied by sector. Three fifths (61%) of museums, galleries and libraries believed that none of these options would encourage future development activity (compared to between a fifth and a quarter of those in other sectors).
Those agreeing that better access to public support schemes would encourage future development activity were asked whether they had previously experienced any barriers or issues with accessing this type of support. A quarter (26%) had experienced barriers or issues, with the most common being a lack of suitable funding and not understanding what to do or where to look (both mentioned by 7% of those asked).
5.4 Impact of constraints
In order to assess impact of barriers on development activity, firms that had experienced constraints within the last 12 months were asked how their development activity might have been different had they not experienced these. The proportions detailed below are based on all respondents, including those that had not experienced barriers. Around half of respondents believed they would have conducted more development activity (54%) or conducted it in a shorter timeframe (50%) if constraints were removed. Two fifths believed they would have conducted better quality development activity (41%).
Table 5.4.1: Impact of barriers on development activity
| Total | Advertising & marketing | Architecture | Crafts (!) | Design | |
|---|---|---|---|---|---|
| Base: All respondents | 625 | 86 | 93 | 19 | 96 |
| Conducted more development activity | 54% | 50% | 42% | 44% | 45% |
| Conducted development activity in a shorter timeframe | 50% | 40% | 33% | 44% | 33% |
| Conducted better quality development activity | 41% | 42% | 34% | 33% | 41% |
Table 5.4.1 (continued)
| Film, TV, video, radio & photography | IT, software & computer services | Publishing | Museums, galleries & libraries (!) | Music, performing & visual arts | |
|---|---|---|---|---|---|
| Base: All respondents | 67 | 126 | 41 | 24 | 73 |
| Conducted more development activity | 50% | 62% | 44% | 43% | 45% |
| Conducted development activity in a shorter timeframe | 45% | 60% | 42% | 24% | 44% |
| Conducted better quality development activity | 37% | 42% | 38% | 18% | 42% |
IT, software and computer services firms were more likely than others to believe they would have conducted more (62%) or quicker (60%) development activity had they not been constrained.
6. Benefits of R&D
6.1 Overview
Research evidence strongly links R&D and innovation to improved corporate performance over the medium term, although short-term disruption may result from the introduction of new products or services. Improvements in performance may reflect increases in profitability or product/service quality or growth in sales, employment or exports.
Questions on the benefits of R&D or innovation were only addressed to those firms which reported either activity – around two-thirds of the overall group of respondents. The strongest perceived links were with improved profitability and the quality of goods and services. Across most sectors relatively few creative industries firms identified any link between R&D and innovation and either exporting or growth in employment. This may reflect the domestic market orientation of most creative industry firms and a model of growth linked more to networking and sub-contracting rather than increasing in-house head count. Two notable exceptions to this finding were the craft and museums sector where R&D and innovation was more commonly linked to increased sales[footnote 9].
6.2 Perceived benefits of R&D
Firms classified as innovative or R&D active (under either definition) were asked to rate the impact of their development activity in the last 12 months on a range of business performance measures. A scale of 1-5 was used, with 1 meaning no impact at all, and 5 meaning a significant impact. As detailed in Figure 6.2.1, firms’ development activity was reported to have had a wide range of impacts, with improving the quality of goods/services, maintaining market share and increasing profitability the strongest rated.

Base: All that have introduced new products, services or processes or conducted R&D (broad Frascati or tax) (Base, Don’t know) – Total (443, 2-5%)
Table 6.2.1 details the proportion scoring each measure as having a significant impact within the last 12 months (4-5 out of 5). Colour coding has been applied to more clearly illustrate the distribution of results, with higher proportions shaded darker green.
Table 6.2.1: Impact of development activity on performance (proportion scoring 4-5)
| % scoring 4-5 | Total | Advertising & marketing | Architecture | Crafts (!) | Design |
|---|---|---|---|---|---|
| Base: All introduced new products, services or processes or conducted R&D | 443 | 58 | 51 | 15 | 59 |
| Improving quality of goods/services | 41% | 23% | 41% | 42% | 33% |
| Maintaining your market share | 39% | 33% | 30% | 48% | 24% |
| Increasing profitability | 38% | 34% | 27% | 48% | 35% |
| Increasing sales | 33% | 26% | 22% | 55% | 35% |
| Accessing new customers, users or audiences | 32% | 33% | 26% | 42% | 33% |
| Increasing range of goods/services | 32% | 24% | 30% | 42% | 23% |
| Increasing number of people employed | 18% | 10% | 16% | 23% | 11% |
| Starting or increasing exports | 9% | 8% | 5% | 19% | 3% |
Table 6.2.1 (continued) | % scoring 4-5 | Film, TV, video, radio & photography | IT, software & computer services | Publishing | Museums, galleries & libraries (!) | Music, performing & visual arts | |————————————————-|———|———|———|———|———| | Base: All introduced new products, services or processes or conducted R&D | 53 | 107 | 28 | 16 | 56 | | Improving quality of goods/services | 30% | 49% | 38% | 50% | 34% | | Maintaining your market share | 32% | 45% | 32% | 22% | 32% | | Increasing profitability | 24% | 46% | 42% | 10% | 19% | | Increasing sales | 24% | 37% | 46% | 20% | 23% | | Accessing new customers, users or audiences | 30% | 34% | 31% | 20% | 30% | | Increasing range of goods/services | 21% | 38% | 30% | 40% | 24% | | Increasing number of people employed | 18% | 20% | 21% | 10% | 11% | | Starting or increasing exports | 12% | 9% | 10% | 0% | 16% | Firms in the crafts sector were among the most likely to have seen significant benefits from their recent development activity; around half had seen a benefit in increasing sales (55%), maintaining market share (48%) and increasing profitability (48%).
7. Awareness and uptake of funding and support
7.1 Overview
Access to increased public support was identified by firms as one of the key enablers for scaling, accelerating and improving the quality of innovation across the creative industries (Section 5). Public support for innovation in the UK includes direct grant and loan support from Innovate UK as well as R&D tax credits.
Awareness of the R&D tax credit schemes among firms in creative industries is relatively high although take up – at less than 10% of firms – is limited in all sectors except IT, software & computer services. In IT, software & computer services both awareness (at 80% of firms) and use of the tax credit schemes (17%) were markedly higher than in any other sector.
7.2 Awareness and uptake of public funding/support
Over half of all respondents (55%) were aware of HMRC’s R&D tax relief schemes, and one in ten (9%) had used the schemes. Those who knew of the schemes most commonly became aware through an accountant, bookkeeper or payroll provider (27%) or by word of mouth/through business networks (22%).
Only a small minority (3%) of firms had used other government or public sector funding initiatives for R&D or developing new products, services or processes, with the most common being Smart Grants (used by 1%).
Table 7.2.1:Awareness and uptake of R&D tax credits
| Total | Advertising & marketing | Architecture | Crafts (!) | Design | |
|---|---|---|---|---|---|
| Base: All respondents | 625 | 86 | 93 | 19 | 96 |
| Aware of HMRC R&D tax relief | 55% | 40% | 51% | 31% | 32% |
| Used HMRC R&D tax relief | 9% | 3% | 4% | 0% | 2% |
Table 7.2.1 (continued)
| Film, TV, video, radio & photography | IT, software & computer services | Publishing | Museums, galleries & libraries (!) | Music, performing & visual arts | |
|---|---|---|---|---|---|
| Base: All respondents | 67 | 126 | 41 | 24 | 73 |
| Aware of HMRC R&D tax relief | 24% | 80% | 27% | 19% | 19% |
| Used HMRC R&D tax relief | 0% | 17% | 9% | 0% | 0% |
Awareness and use of HMRC’s R&D tax relief schemes was significantly higher among IT, software & computer services firms (80% were aware and 17% had used the schemes). Museum, galleries & libraries and those in music, performing & visual arts had the lowest awareness of the schemes (both 19%), with no respondents in these sectors having used them.
A small proportion of interviewed firms (32 respondents) stated that they had conducted recent R&D as per the tax definition and were aware of the R&D tax relief schemes but had not used them. Among these firms, the main reasons cited for not using the schemes in the last 12 months was because they were not eligible (28%), that they were currently considering it (17%) or that it was too complex/difficult to use (13%).
8. Annex A: Methodology
Sampling
The population of interest for this survey was UK businesses operating across the creative industries sectors as identified by table 2.1.1. Public sector organisations were excluded, so the sample consisted of private sector businesses, charities and not for profit organisations. The sample was sourced from the Dun & Bradstreet commercial business database.
A disproportionate stratified random sampling approach was used, with businesses selected based on industry sector and size (based on number of employees). Organisations in some sectors and with larger employee numbers were intentionally over-sampled to ensure they were adequately represented and to allow more robust sub-analysis.
With the final stage of fieldwork significantly obstructed by the COVID-19 outbreak, the original target number of interview (725) could not be achieved within a reasonable timeframe. However, the vast majority of final survey data therefore essentially relates to the pre-COVID period, meaning that responses should not be significantly skewed by the effects of the outbreak. Table A.1 details the final profile of achieved interviews.
Table A.1: Sample profile
| Achieved | Sampling error | |
|---|---|---|
| TOTAL | 625 | ±3.9% |
| Sector | ||
| Advertising and marketing | 86 | ±10.6% |
| Architecture | 93 | ±10.2% |
| Crafts | 19 | ±22.5% |
| Design: product, graphic and fashion design | 96 | ±10.0% |
| Film, TV, video, radio and photography | 67 | ±12.0% |
| IT, software and computer services | 126 | ±8.7% |
| Publishing | 41 | ±15.3% |
| Museums, galleries and libraries | 24 | ±20.0% |
| Music, performing and visual arts | 73 | ±11.5% |
| Size | ||
| Micro (1-9 employees) | 485 | ±4.4% |
| Small (10-49 employees) | 93 | ±10.2% |
| Medium/Large (50+ employees)[footnote 10] | 47 | ±14.3% |
Fieldwork
A total of 625 telephone interviews were conducted using Computer Assisted Telephone Interviewing (CATI) between 13th February and 31st March 2020. These interviews lasted an average of 18 minutes and were conducted with a member of the senior management team or someone else with responsibility for making decisions about running the business.
An initial stage of cognitive testing was undertaken to fully test key questions. The survey was then put through a live CATI piloting phase with all interviews listened to by an OMB executive, and data analysis undertaken to check understanding (e.g. any questions with large numbers of ‘don’t know’ or counterintuitive responses).
Weighting
To address any distortions caused by the sampling approach, interviews were weighted to the true profile of UK creative industries organisations using the DCMS Sectors Economic Estimates 2017 published in January 2020 (based on ONS Annual Business Survey). The table below shows the unweighted and weighted figures:
Table A.2: Weighting
| Unweighted | Weighted | |
|---|---|---|
| TOTAL | 625 | 625 |
| Sector | ||
| Advertising and marketing | 86 | 53 |
| Architecture | 93 | 35 |
| Crafts | 19 | 3 |
| Design: product, graphic and fashion design | 96 | 50 |
| Film, TV, video, radio and photography | 67 | 71 |
| IT, software and computer services | 126 | 312 |
| Publishing | 41 | 24 |
| Museums, galleries and libraries | 24 | 2 |
| Music, performing and visual arts | 73 | 75 |
| Size | ||
| Micro (1-9 employees) | 485 | 592 |
| Small (10-49 employees) | 93 | 27 |
| Medium/Large (50+ employees) | 47 | 5 |
9. Annex B: Questionnaire
Intro
READ OUT TO ALL
Please can I speak to a member of the senior management team, or someone else with responsibility for making decisions about running the business?
Good morning/afternoon. My name is < NAME > and I’m calling from OMB Research, an independent market research agency, on behalf of the Department for Digital, Culture, Media & Sport (DCMS).
DCMS is carrying out a study on new product or service development activities undertaken by creative businesses in the UK.
AS NECESSARY:
These activities could include development of physical goods, services, content and experiences.
The survey will take around 15 minutes, depending on your answers, and you do not need to prepare anything in advance. Is it convenient to speak to you now or would you prefer to make an appointment for another time?
PROVIDE REASSURANCE TEXT, CONTACT POINTS, ASK GDPR QUESTIONS, CHECK ELIGIBILITY
Background
READ OUT TO ALL
I’d like to start by collecting some background information about your business.
ASK ALL
B1. Which of the following best describes your organisation? READ OUT. SINGLE CODE.
| A private sector company that seeks to make a profit | 1 | |
| A charity, voluntary sector, or not-for-profit organisation | 2 | |
| A public sector organisation | 3 | CLOSE |
| DO NOT READ OUT: Don’t know | 4 |
ASK ALL
B2a. Including yourself, how many < employees/employees, volunteers and trustees > work for your < business/organisation > across the UK as a whole?
ADD IF NECESSARY: By that I mean both full-time and part-time employees on your payroll, as well as < any working proprietors or owners/people who regularly volunteer for your organisation >.
| WRITE IN NUMBER | 1 | GO TO B3 |
| DO NOT READ OUT: Don’t know/refused | 2 | GO TO B2b |
ASK IF DON’T KNOW/REFUSED NUMBER OF EMPLOYEES (B2a=2) B2b. If you had to estimate, would you say that it is…? READ OUT. SINGLE CODE.
| 1 - 2 employees | 1 | |
| 3 - 4 | 2 | |
| 5 - 9 | 3 | |
| 10 - 19 | 4 | |
| 20 - 49 | 5 | |
| 50 - 99 | 6 | |
| 100 - 249 | 7 | |
| 250 or more employees | 8 | |
| DO NOT READ OUT: Don’t know/refused | 9 |
ASK ALL
B3. I have the following as a general description of your < company’s/organisation’s > principal activity. Bearing in mind this is a general description only, does this sound correct? READ OUT. SINGLE CODE.
| IF ‘ADVERTISING + MARKETING’: Advertising, marketing or PR (including communications and media representation) | 1 | GO TO B5 |
| IF ‘ARCHITECTURE’: Architecture | 2 | |
| IF ‘CRAFTS’: Crafts (including jewellery, luxury goods and related articles) | 3 | |
| IF ‘DESIGN - PRODUCT, GRAPHIC + FASHION DESIGN’: Design (including project design, graphic design, fashion design, etc) | 4 | |
| IF ‘FILM, TV, VIDEO, RADIO AND PHOTOGRAPHY’: Film, TV, video, radio or photography (including production, post-production, distribution, broadcasting, animation, visual effects, online media, etc) | 5 | |
| IF ‘IT, SOFTWARE AND COMPUTER SERVICES’: IT, software or computer services (including computer games, publishing software, programming, computer consultancy, etc) | 6 | |
| IF ‘PUBLISHING’: Publishing (including publishing books, directories, newspapers, magazines, etc as well as translation, interpretation, writing & editing) | 7 | |
| IF ‘MUSEUMS, GALLERIES + LIBRARIES’: Museums, galleries or libraries (including archive activities) | 8 | |
| IF ‘MUSIC, PERFORMING + VISUAL ARTS’: Music, performing or visual arts (including sound recording, music publishing, cultural education, performing arts, artistic creation, operation of arts facilities, etc) | 9 | |
| DO NOT READ OUT: No – description incorrect | 10 | GO TO B4 |
| DO NOT READ OUT: Don’t know | 11 | GO TO B4 |
ASK IF NOT SELF-CLASSIFIED AS CREATIVE INDUSTRIES (B3=10-11)
B4. In your own words, please could you give a one sentence summary of what your <business/organisation> does?
| WRITE IN | 1 | |
| DO NOT READ OUT: Don’t know | 2 |
ASK ALL
B5. Roughly how long has your < business/organisation > been trading? READ OUT. SINGLE CODE.
IF NECESSARY: By this I mean when did you first start selling your goods or services.
| Less than 2 years | 1 | |
| 2-5 years | 2 | |
| 6-10 years | 3 | |
| 11-20 years | 4 | |
| Over 20 years | 5 | |
| DO NOT READ OUT: Don’t know | 6 | |
| DO NOT READ OUT: Not currently trading | 7 | CLOSE |
ASK ALL
B6a. Thinking about any export activity, in the last 12 months have you sold any goods or services to individuals or organisations based outside of the UK?
AS NECESSARY: This could include commissions, royalties and licences.
| Yes | 1 | |
| No | 2 | |
| Don’t know | 3 |
ASK IF EXPORTED IN LAST 12 MONTHS (B6A=1)
B6b. Approximately what percentage of your sales in the last 12 months were to individuals or organisations based outside of the UK? PROBE FOR BEST ESTIMATE.
| WRITE IN % (0-100%) | 1 | |
| DO NOT READ OUT: Don’t know | 2 |
ASK ALL
B7. Do you sell your products or services? READ OUT. CODE ALL THAT APPLY.
| To individuals or households | 1 | |
| To other businesses | 3 | |
| To public sector organisations (include health services, schools and universities) | 4 | |
| DO NOT READ OUT: Don’t know | 5 | SINGLE CODE |
ASK ALL
B8. Has your <business/organisation> introduced any new or significantly improved products or services in the last three years? SINGLE CODE.
| Yes | 1 | |
| No | 2 | |
| Don’t know | 3 |
ASK IF INTRODUCED NEW GOODS/SERVICES (B8=1)
B9. Were any of these new or improved products and services introduced new to the market, by which I mean introduced before your competitors? SINGLE CODE.
| Yes - At least some new to the market | 1 | |
| No - Just new to the business | 2 | |
| DO NOT READ OUT: Don’t know | 3 |
ASK IF INTRODUCED NEW GOODS/SERVICES (B8=1)
B10a. Roughly what percentage of your current turnover comes from products or services that you have introduced or improved over the last three years?
| WRITE IN % (0-100%) | 1 | |
| DO NOT READ OUT: Don’t know | 2 | GO TO B10b |
ASK IF DON’T KNOW AT B10a
B10b. If you had to estimate, would you say that it is…? READ OUT. SINGLE CODE.
| Zero | 1 | |
| 1-9% | 2 | |
| 10-19% | 3 | |
| 20-29% | 4 | |
| 30-49% | 5 | |
| 50-69% | 6 | |
| 70% or more | 7 | |
| DO NOT READ OUT: Don’t know | 8 |
ASK ALL
B11. Has your < business/organisation > introduced any new or significantly improved forms of organisation, business structures or processes over the last three years? SINGLE CODE.
| Yes | 1 | |
| No | 2 | |
| DO NOT READ OUT: Don’t know | 3 |
Current R&D Activities
I would now like to move on and ask about any research and development activity your
<business/organisation> may have undertaken in the last 12 months.
ASK ALL
C13. ‘Research and Development’ (R&D) covers three types of activity; basic research, applied research and experimental development. It comprises creative and systematic work undertaken in order to increase the stock of knowledge, and in order to devise new applications of available knowledge. R&D does not include routine changes to existing products, services or processes.
Over the last year, did your < business/organisation > undertake any Research and Development (R&D)?
Please include any R&D undertaken within your < business/organisation >, as well as R&D conducted by others but purchased by your < business/organisation >. SINGLE CODE.
| Yes | 1 | |
| No | 2 | |
| DO NOT READ OUT: Don’t know | 3 |
ASK IF UNDERTAKEN R&D (C13=1)
C1. And was this R&D…? READ OUT IN FULL. SINGLE CODE PER ROW.
| Yes | No | Don’t know | |
|---|---|---|---|
| Undertaken within your < business/organisation > | 1 | 2 | 3 |
| Or, performed by others outside of your <business /organisation> but paid for by your < business/organisation > (AS NECESSARY: This might include other businesses within your group, or public or private research organisations) | 1 | 2 | 3 |
ASK ALL
C2. Does your < business/organisation > have a specific budget for Research and Development (R&D)? SINGLE CODE.
| Yes | 1 | |
| No | 2 | |
| DO NOT READ OUT: Don’t know | 3 |
ASK IF INVESTED IN R&D (C13=1)
C3a. Can you say how much you have invested in R&D activities in the last year? INTERVIEWER NOTE: If the business has not yet completed its first financial year, then ask them to estimate their likely spend.
| WRITE IN AMOUNT (IN £) | 1 | |
| DO NOT READ OUT: Don’t know | 2 | GO TO C3b |
ASK IF DON’T KNOW/REFUSED (C3a=2)
C3b. If you had to estimate, would you say that it was…? READ OUT. SINGLE CODE.
| Up to £10,000 | 1 | |
| £10,001 - £50,000 | 2 | |
| £50,001 - £100,000 | 3 | |
| £100,001 - £250,000 | 4 | |
| £250,001 - £500,000 | 5 | |
| Over £500,000 | 6 | |
| DO NOT READ OUT: Don’t know/refused | 7 |
IF INVESTED IN BOTH INTERNAL & EXTERNAL R&D (C1A=1 AND C1B=1)
C4. And approximately what percentage of your total R&D spend came from…? READ OUT.
AS NECESSARY: The figures you give should add up to 100%, but it’s fine to just provide your best estimates.
| R&D undertaken within your business/organisation> | WRITE IN % | Don’t know |
| R&D performed by others outside of your < business/organisation > but paid for by your < business/organisation > | WRITE IN % | Don’t know |
ASK ALL
C5a. Over the last year has your < business/organisation > funded or collaborated with a university or other external organisation on R&D activities? SINGLE CODE.
| Yes | 1 | |
| No | 2 | |
| DO NOT READ OUT: Don’t know | 3 |
IF INVESTED IN ANY R&D ACTIVITY (C13=1)
C7. Thinking about all of your R&D activity in the last 12 months, did any of this include…? READ OUT ALL. SINGLE CODE PER ROW.
| Yes | No | Don’t know | |
|---|---|---|---|
| Basic research – By that I mean work undertaken primarily to acquire new knowledge without a specific application in mind | 1 | 2 | 3 |
| Applied research – By that I mean work undertaken to acquire new knowledge with a specific application in mind | 1 | 2 | 3 |
| Experimental development – By that I mean work drawing on knowledge gained from research or practical experience, for the purpose of creating new or improved products or processes | 1 | 2 | 3 |
IF MORE THAN ONE TYPE OF R&D (C7=YES TO MORE THAN ONE)
C8. And approximately what percentage of your total R&D spend came from each of these types of work? READ OUT. CATI TO ONLY SHOW THOSE SELECTED AT C7.
AS NECESSARY: The figures you give should add up to 100%, but it’s fine to just provide your best estimates.
| Basic research (AS NECESSARY: By that I mean work undertaken primarily to acquire new knowledge without a specific application in mind) | WRITE IN % | Don’t know |
|---|---|---|
| Applied research (AS NECESSARY: By that I mean work undertaken to acquire new knowledge with a specific application in mind) | WRITE IN % | Don’t know |
| Experimental development (AS NECESSARY: By that I mean work drawing on knowledge gained from research or practical experience, for the purpose of creating new or improved products or processes) | WRITE IN % | Don’t know |
ASK ALL
C9. For the purposes of current or future new product or service development activities, over the last year, did your business invest in any of the following? READ OUT ALL. SINGLE CODE PER ROW.
| Yes | No | Don’t know | |
|---|---|---|---|
| Advanced machinery and equipment | 1 | 2 | 3 |
| Computer hardware or software | 1 | 2 | 3 |
| Licenses for technology or products/services | 1 | 2 | 3 |
| Training related specifically to developing new products or services | 1 | 2 | 3 |
| Any type of design | 1 | 2 | 3 |
| Market research | 1 | 2 | 3 |
| Changes to marketing methods or product launch advertising | 1 | 2 | 3 |
IF INVESTED IN DESIGN (C9E=1)
C10a. Thinking only about your design activities would you be able to estimate how much you spent, in total, on any forms of design in the last 12 months?
AS NECESSARY: Please just provide your best estimate.
| WRITE IN AMOUNT (IN £) | 1 | |
| DO NOT READ OUT: Don’t know | 2 | GO TO C10b |
ASK IF DON’T KNOW/REFUSED (C10A=2)
C10b. If you had to estimate, would you say that it was…? READ OUT. SINGLE CODE.
| Up to £10,000 | 1 | |
| £10,001 - £50,000 | 2 | |
| £50,001 - £100,000 | 3 | |
| £100,001 - £250,000 | 4 | |
| £250,001 - £500,000 | 5 | |
| Over £500,000 | 6 | |
| DO NOT READ OUT: Don’t know/refused | 7 |
ASK ALL
C11. In the last year, have you used any of the following intellectual property protections for your technology, designs, content, products or services? READ OUT. SELECT ALL THAT APPLY.
| Patents | 1 | |
|---|---|---|
| Copyright | 2 | |
| Trademarks | 3 | |
| Registered designs | 4 | |
| Unregistered design rights | 5 | |
| Non-disclosure and confidentiality agreements | 6 | |
| Unique experience, i.e. you offer an experience to customers that is distinctive | 7 | |
| Or any informal means of protecting your intellectual property (IF NECESSARY: e.g. keeping your technology or approaches secret, making your products or services too complex to imitate, getting to market before your competitors, etc) | 8 | |
| DO NOT READ OUT: None of the above | 9 | |
| DO NOT READ OUT: Don’t know | 10 |
ASK ALL
C12. And over the last year, would you say your < business/organisation > has undertaken any activities which aim to advance science or technology by resolving scientific or technological uncertainties? SINGLE CODE.
AS NECESSARY: An advance in science or technology means an advance in overall knowledge or capability in a field of science or technology. The purpose of this may be, for example, to introduce a new product, service or process, or to significantly improve an existing product, service or process.
| Yes | 1 | |
| No | 2 | |
| DO NOT READ OUT: Don’t know | 3 |
Challengers & Enablers
ASK ALL
D1. Moving on, I have a list of possible factors that may constrain < a business’s/an organisation’s > new product, service or process development activity.
Please can you tell me whether each of the following had any impact on your development activity in the last 12 months. READ OUT. RANDOMISE BUT KEEP D & E TOGETHER.
Please answer using a scale of 1-5 where 1 is no impact at all and 5 is a significant impact. READ OUT. SINGLE CODE FOR EACH ROW.
PROMPT AS REQUIRED: How much of an impact has this had on constraining your development activity in the last 12 months?
| 1 - No impact | 2 | 3 | 4 | 5 - Significant impact | Don’t know | |
|---|---|---|---|---|---|---|
| Costs of development too high | 1 | 2 | 3 | 4 | 5 | 6 |
| Availability of finance | 1 | 2 | 3 | 4 | 5 | 6 |
| Lack of qualified personnel to conduct development activity | 1 | 2 | 3 | 4 | 5 | 6 |
| Lack of information on technology | 1 | 2 | 3 | 4 | 5 | 6 |
| Lack of information on markets | 1 | 2 | 3 | 4 | 5 | 6 |
| Market dominated by established < businesses/organisations > | 1 | 2 | 3 | 4 | 5 | 6 |
| Uncertain demand for new products, services or processes | 1 | 2 | 3 | 4 | 5 | 6 |
| Regulations or legislation | 1 | 2 | 3 | 4 | 5 | 6 |
ASK ALL
D2. Would any of the following types of support or improvements encourage your < business/organisation > to undertake < more > R&D or new product, service or process development activity in the future? READ OUT. SINGLE CODE PER STATEMENT. RANDOMISE BUT KEEP G & H TOGETHER.
| Yes | No | Don’t know | |
|---|---|---|---|
| Better access to public support schemes such as grants and subsidies | 1 | 2 | 3 |
| Access to network opportunities such as conferences, trade fairs or exhibitions | 1 | 2 | 3 |
| Advice on intellectual property protection | 1 | 2 | 3 |
| Support to find the required skills or expertise | 1 | 2 | 3 |
| Public research facilities that can be rented | 1 | 2 | 3 |
| Help with the costs of obtaining intellectual property protection | 1 | 2 | 3 |
| Better access to research centres, universities or other higher education institutions | 1 | 2 | 3 |
| Better access to consultants, commercial labs or private R&D institutes | 1 | 2 | 3 |
| Or something else (PLEASE SPECIFY) | 1 | 2 | 3 |
IF WOULD LIKE BETTER ACCESS TO PUBLIC SUPPORT (D2A=1)
D3. Have you experienced any barriers or issues with accessing public support for R&D or new product, service or process development activity?
| Yes | 1 | |
| No | 2 | |
| DO NOT READ OUT: Don’t know | 3 |
ASK IF EXPERIENCED BARRIERS (D1=2-5 TO ANY)
D4. You mentioned that your R&D or new product, service or process development activity has been constrained to some extent over the last 12 months. If you had not experienced these constraints do you think you would have…? READ OUT. SINGLE CODE PER STATEMENT
| Yes | No | Don’t know | |
| Conducted more development activity | 1 | 2 | 3 |
| Conducted development activity in a shorter timeframe | 1 | 2 | 3 |
| Conducted better quality development activity | 1 | 2 | 3 |
Benefits of R&D
ASK IF INTRODUCED NEW PRODUCTS, SERVICES OR PROCESSES OR CONDUCTED R&D (B8=1 OR B11=1 OR C13=1 OR C12=1)
E1. I’d now like to ask about the impact of R&D or new product, service or process development activity on your < business performance/organisation > over the last 12 months.
Please tell me to what extent your development activity has had an impact on each of the following, using a scale of 1-5 where 1 is no impact and 5 is a significant impact. READ OUT. SINGLE CODE FOR EACH ROW.
PROMPT AS REQUIRED: To what extent has your development activity had an impact on this?
| 1 - No impact | 2 | 3 | 4 | 5 - Significant impact | Don’t know | |
|---|---|---|---|---|---|---|
| Increasing your profitability | 1 | 2 | 3 | 4 | 5 | 6 |
| Increasing your sales | 1 | 2 | 3 | 4 | 5 | 6 |
| Increasing the number of people employed by your < business/ organisation > | 1 | 2 | 3 | 4 | 5 | 6 |
| Accessing new customers, users or audiences | 1 | 2 | 3 | 4 | 5 | 6 |
| Starting or increasing exports | 1 | 2 | 3 | 4 | 5 | 6 |
| Increasing the range of goods or services | 1 | 2 | 3 | 4 | 5 | 6 |
| Improving the quality of goods or services | 1 | 2 | 3 | 4 | 5 | 6 |
| Maintaining your market share | 1 | 2 | 3 | 4 | 5 | 6 |
Uptake of public funding/support
READ OUT TO ALL
The next set of questions are about your use of public sector funding or support for R&D or new product, service or process development activity.
ASK ALL
F1. Are you aware of HMRC’s R&D tax relief scheme and how it works? SINGLE CODE. ADD AS NECESSARY: The scheme is a corporation tax relief reducing a business’ tax bill (or, in some circumstances, providing a payable cash credit) and aims to support scientific and technological innovation by incentivising R&D expenditure.
| Yes, have heard of the scheme and have a good understanding of it | 1 | |
| Yes, have heard of the scheme but don’t know much about it | 2 | |
| No, not aware of the scheme | 3 | |
| DO NOT READ OUT: Don’t know | 4 |
ASK IF AWARE OF R&D TAX RELIEF SCHEME (F1=1 OR 2)
F2. How did you first become aware of the R&D tax relief scheme? DO NOT READ OUT. CODE ALL THAT APPLY
| Media advertising | 1 | |
| Word of mouth/business networks | 2 | |
| Internally/from colleagues/staff | 3 | |
| A business/financial adviser/consultant | 4 | |
| An accountant/bookkeeper/payroll provider | 5 | |
| A trade body/professional body | 6 | |
| A tax specialist/advisor | 7 | |
| Other (please specify) | 8 | |
| Don’t know | 9 |
ASK IF INTRODUCED NEW PRODUCTS, SERVICES OR PROCESSES OR DONE R&D (B8=1 OR B11=1 OR C13=1 OR C12=1)
F3. During the last 12 months, did you receive any government or public sector financial support for R&D or developing new products, services or processes? SINGLE CODE.
IF NECESSARY: Please include public support from either national or international sources (e.g. the UK Government, the EU, etc)
| Yes | 1 | |
| No | 2 | |
| DO NOT READ OUT: Don’t know | 3 |
IF RECEIVED FINANCIAL SUPPORT (F3=1)
F4. Please can you tell me the names of the government or public sector funding initiatives that you obtained financial support from in the last 12 months? DO NOT READ OUT. CODE ALL THAT APPLY.
| HMRC R&D tax credits/relief | 1 | |
| Patent box / Intellectual Property Box / Innovation box | 2 | |
| Collaborative R&D grants | 3 | |
| Smart Grants | 4 | |
| Industrial Strategy Challenge Fund | 5 | |
| Investment accelerator | 6 | |
| Knowledge Transfer Partnerships | 7 | |
| Small Business Research Initiative (SBRI) | 8 | |
| Innovation loans | 9 | |
| Catapult centre funding | 10 | |
| Innovation vouchers | 11 | |
| Other (SPECIFY) | 12 | |
| DO NOT READ OUT: Don’t know | 13 |
ASK IF CONDUCT QUALIFYING R&D AND AWARE OF HMRC TAX RELIEF BUT HAVE NOT CLAIMED IT (C12=1 AND F1=1-2 AND F4 NOT 1)
F5. And may I ask why you have not used HMRC’s tax relief scheme in the last 12 months?
| WRITE IN VERBATIM RESPONSE | 1 | |
| DO NOT READ OUT: Don’t know | 2 |
Business Profile
READ OUT TO ALL
The final set of questions are about the profile of your < business/organisation >.
ASK ALL
G1a. What was your annual turnover in the last completed financial year?
IF B5=1 OR 7 | WRITE IN AMOUNT (IN £) | 1 | | | DO NOT READ OUT: Don’t know/refused | 2 | GO TO G1b |
ASK IF DON’T KNOW/REFUSED TURNOVER (G1a=2)
G1b. If you had to estimate, would you say that it was…? READ OUT. SINGLE CODE.
| Up to £50,000 | 1 | |
| £50,001 - £100,000 | 2 | |
| £100,001 - £250,000 | 3 | |
| £250,001 - £500,000 | 4 | |
| £500,001 - £1million | 5 | |
| £1million - £2million | 6 | |
| £2million - £5million | 7 | |
| Over £5million | 8 | |
| DO NOT READ OUT: Don’t know/refused | 9 |
ASK ALL ESTABLISHED AT LEAST 2 YEARS (B5=2-6)
G2a. And was that higher or lower than the previous year’s turnover? SINGLE CODE.
| Higher | 1 | GO TO G2b |
| Lower | 2 | GO TO G2b |
| DO NOT READ OUT: Exactly the same | 3 | GO TO G3 |
| DO NOT READ OUT: Don’t know/refused | GO TO G3 |
ASK IF TURNOVER WAS HIGHER OR LOWER (G2a=1-2)
G2b. Approximately how much < IF G2a=1 higher / IF G2a=2 lower > was it than the previous financial year, in percentage terms?
| WRITE IN (%) | 1 | GO TO G3 |
| DO NOT READ OUT: Don’t know/refused | 2 | GO TO G2c |
ASK IF DON’T KNOW/REFUSED PERCENTAGE CHANGE IN TURNOVER (G2b=2)
G2c. If you had to estimate, would you say that it was…? READ OUT. SINGLE CODE.
| 1-20% < higher/lower > than the previous year | 1 | |
|---|---|---|
| 21-40% | 2 | |
| 41-60% | 3 | |
| 61-80% | 4 | |
| 81-100% < higher /lower > than the previous year | 5 | |
| SHOW IF G2a=1: More than 100% higher | 6 | |
| DO NOT READ OUT: Don’t know/refused | 7 |
ASK ALL
G4. Which of the following best describes your < business/organisation > growth objectives for the next three years in terms of turnover? Do you aim to…? READ OUT. SINGLE CODE.
| Grow substantially (more than 20% growth) | 1 | |
| Grow moderately (up to 20% growth) | 2 | |
| Stay the same size | 3 | |
| Become smaller | 4 | |
| DO NOT READ OUT: Don’t know/refused | 5 |
ASK ALL
G5a. Approximately what percentage of your < employees/employees, volunteers and trustees > have a university degree or equivalent?
IF NECESSARY: Please include both full-time and part-time employees on your payroll, as well as < any working proprietors or owners/people who regularly volunteer for your organisation >.
| WRITE IN (%) | 1 | |
| DO NOT READ OUT: Don’t know/refused | 2 | GO TO G5b |
ASK IF DON’T KNOW/REFUSED PERCENTAGE WITH DEGREE (G5a=2)
G5b. If you had to estimate, would you say that it was…? READ OUT. SINGLE CODE.
| Up to 10% | 1 | |
| 11-25% | 2 | |
| 26-50% | 3 | |
| 51-75% | 4 | |
| 76-100% | 5 | |
| DO NOT READ OUT: Don’t know/refused | 6 |
Wrap-up
READ OUT TO ALL
That’s the end of the interview, thank you very much for your time. I just need to check a few things before you go.
ASK ALL
H1. The Department for Digital, Culture, Media & Sport (DCMS) may be conducting follow-up research to improve their understanding of creative <businesses/ organisations>. Would you be willing for us to pass on your name, contact details and relevant survey responses to them so that they could invite you to take part? SINGLE CODE.
IF NECESSARY: You may not be contacted and, if you are, there is no obligation to take part.
| Yes | 1 | |
| No | 2 |
ASK ALL
H2. DCMS and our research partners at the Policy and Evidence Centre and the Enterprise Research Centre at Warwick University may also wish to conduct further analysis of the survey data. This will involve linking your survey responses to information about your < business/organisation > held by the Office for National Statistics. Are you happy for this to be done? SINGLE CODE.
IF NECESSARY: This will be used for research and statistical purposes only, under strict confidentiality restrictions. This will help them support policy for creative industries, and any findings made public will be completely anonymised so that individual businesses can’t be identified.
| Yes | 1 | |
| No | 2 |
-
DCMS Sector Estimates, 2018: Gross Value Added https://assets.publishing.service.gov.uk/government/uploads/system/uploads/attachment_data/file/863632/DCMS_Sectors_Economic_Estimates_GVA_2018.pdf ↩
-
https://www.nesta.org.uk/report/what-can-we-learn-about-innovation-performance-creativeindustries-uk-innovation-survey/ ↩
-
Strictly speaking, calculations of statistical significance apply only to samples that have been selected using probability sampling methods. However, in practice it is reasonable to assume that these calculations provide a good indication of significant differences in quota surveys like this one. ↩
-
http://www.oecd.org/sti/oslo-manual-2018-9789264304604-en.htm ↩
-
Potts, J. (2009) ‘Introduction: creative industries and innovation policy’, Innovation: Management, Policy & Practice, 11(2), page 141. ↩
-
https://ahrc.ukri.org/documents/project-reports-and-reviews/policy-briefing-digital-r-d/ ↩
-
https://www.oecd.org/sti/inno/frascati-manual.htm ↩
-
https://www.gov.uk/government/publications/guidelines-on-the-meaning-of-research-and-development-for-tax-purposes ↩
-
Note however that in both cases the sub-sample of R&D or innovation activity firms was relatively small (see Table 6.2.1). ↩
-
Although medium and large firms were treated separately in the sampling stage, there was a shortfall in final interview numbers due to COVID-19. It was decided that combining these groups in the reporting would allow for a more robust base for analysis. ↩