Race in the workplace: The McGregor-Smith review - annexes
Published 28 February 2017

© Crown copyright 2017
This publication is licensed under the terms of the Open Government Licence v3.0 except where otherwise stated. To view this licence, visit nationalarchives.gov.uk/doc/open-government-licence/version/3 or write to the Information Policy Team, The National Archives, Kew, London TW9 4DU, or email: psi@nationalarchives.gov.uk.
Where we have identified any third party copyright information you will need to obtain permission from the copyright holders concerned.
This publication is available at https://www.gov.uk/government/publications/race-in-the-workplace-the-mcgregor-smith-review/race-in-the-workplace-the-mcgregor-smith-review-annexes
These are the annexes to ‘Race in the workplace: The McGregor-Smith review’. Read the main report.
Note: The following footnotes relate to the main report and are included here for completeness [footnote 1], [footnote 2], [footnote 3], [footnote 4], [footnote 5], [footnote 6], [footnote 7], [footnote 8], [footnote 9], [footnote 10], [footnote 11], [footnote 12], [footnote 13], [footnote 14], [footnote 15], [footnote 16], [footnote 17], [footnote 18], [footnote 19].
a. Best practice case studies
It would be wrong to suggest that nothing is being done to improve racial diversity in the workplace. Throughout this review, a number of employers have identified initiatives that they have implemented which have delivered real change in the workplace. Going forward, it will be important that the new online portal becomes a vehicle through which these good examples can be shared. However, as a starter, some case studies are included below to support employers in taking positive action in the workplace.
Case study: University of Birmingham – Improving employment outcomes for students
In 2011 the University of Birmingham ran a project to identify the issues affecting employment outcomes for BME students. This involved in-depth consultation with BME learners through a programme of focus groups and interviews.
The feedback the University received indicated that the students would value access to BME role models and better opportunities for networking, especially as many were the first from their family or community to go to University. Accordingly, the project trialled a mentoring scheme through which local BME role models provided direct, interactive and personal employment support to students. Many of the students who took part left the University to work in the areas of their choice. Their mentors had enabled them to make useful fruitful connections. For example – a student who wanted to be a journalist now works for The Voice in London as a result of the support from her mentor, herself a Sky and BBC journalist from BME background, having helped her publish some online articles in the Guardian. Another worked with a community business mentor and they set up their own IT business.
On the basis of this successful pilot, the University launched a full-scale BME mentoring scheme which gives students the opportunity to meet and network with successful BME business and community leaders from the surrounding area. A peer mentoring programme was also developed for students and eventually, running alongside that, a BME ambassador scheme aimed at supporting BME students’ success and attainment. One result is a network of over 200 BME students meeting reguarly and working to promote race equality in their Schools. For the individual students, the impact seems positive. They meet others they can easily relate to and they have an important role to perform at the University. The University planned to launch an impact and evaluation tool in October 2016 to measure the impact of this work more rigorously.
The study also revealed that BME students felt they were part of visible and cultural minorities and that this impacted their ability to ‘find a voice’. To tackle these issues, a website dedicated to supporting the success of BME students was launched in 2015, with an additional website for academics and staff launched shortly afterwards. These websites host the BME Ambassador Toolkit which was designed as a training resource for students and staff.
In 2016 the University’s Equality Diversity ‘Champions’ who are both academic and non-academic staff, worked with over 200 BME ‘Student Ambassadors’ to better understand the BME student experience and develop an action plan to address any issues. This project is supported by the Higher Education Academy as part of its Strategic Enhancement Programme for Retention and Attainment. The Diversity Champions also engage in dialogue with the student ambassadors in order to facilitate more inclusion in the curriculum and the University generally. The aim in the current academic year is to ensure a more systematic approach to this work. For example, the dialogue has made a positive change in the school of Mathematics. Students produced materials celebrating the work of Mathematicians from different cultures and countries and used them at induction. They also established a race equality group within Maths and held socials and study meetings. They invited speakers from diverse backgrounds to be part of the school’s speaker programme. They elected an equality and diversity representative from the students. In English, American and Canadian studies (EDACS) students informed changes to the first year curriculum, changed the School’s displays to be more inclusive, held film nights, had socials and wrote a blog.
Case study: Russell Group universities – Mentoring and development programmes
iLead is a leadership programme for BME academic, research, technical and professional support staff developed by Imperial College London and run from 2008 to 2011. The course involved 4 modules, delivered over 6 months, including a 2-day residential workshop. The programme focussed on how to develop careers, exploring potential barriers to success and understanding effective leadership and management techniques. A survey of iLead participants revealed that 10 had applied for higher grade jobs internally, 5 succeeded in obtaining positions and 7 indicated they had obtained higher grade positions through promotion or other means, such as secondment. 9 of 11 participants who applied for jobs externally obtained new positions. The success of the iLead programme led to it being a model for a pilot scheme across the Higher Education sector in 2010 called Stellar HE. In 2013 the universities of Birmingham, Nottingham and London School of Economics and Political Science (LSE) were all offering Stellar HE to their staff.
Imperial College London now delivers IMPACT (Imperial Positive about Cultural Talent), which was established in 2014. IMPACT is a leadership and personal effectiveness programme for BAME academic and support staff. It is an Institute of Leadership and Management (ILM) accredited programme of 6 workshops run over 6 months. Currently, 27 senior leaders and managers participate as IMPACT mentors. All delegates recieve post-programme coaching from senior managers in order to provide executive-style coaching. Being able to engage with senior managers throughout and after the programme has led to a growth of confidence and morale with IMPACT delegates.
As of June 2016, IMPACT has had 51 BAME delegates, with cohort numbers increasing from 15 delegates to 21 per programme. All senior managers and line managers are held accountable through the delegates’ personal development review meetings which are recorded and sent to the ILM. IMPACT is also being delivered at LSE by the Imperial College’s EDIC team, the programme is entitled CADET.
IMPACT has been shortlisted for Business in the Community’s Race Equality Campaign Awards in 2016, for developing talent.
Case study: NASUWT (teachers’ union) – Example of BME networks/ consultation conference
The National Association of Schoolmasters and Union of Women Teachers (NASUWT) is a TUC-affiliated trade union representing teachers, including head teachers, throughout the United Kingdom.
The NASUWT hosts annually the largest network of BME teachers and head teachers, through its annual programme of consultation conferences. This provides critical information on the experiences of BME teachers.
The NASUWT’s annual BME Teachers’ Consultation Conference, now the largest gathering of its kind in Europe, provides rich data and information on the experiences of BME teachers and head teachers across the UK. Each event consists of a number of Continuing Professional Development (CPD) sessions covering a variety of subjects.
Research commissioned by the NASUWT demonstrates discriminatory practices within Performance Management and Capability processes. For the past 4 to 5 years we have provided CPD on Managing your Performance Management, providing information on understanding the performance management process and strategies for avoiding discriminatory practices. Feedback demonstrates that these sessions have empowered BME teachers to engage constructively in the performance management process, increased awareness of the risks around discrimination and thus supported their career progression. This process has also given us rich information and evidence for discussions with Education Ministers on matters such as performance management. Indeed the NASUWT worked positively with the DfE on providing checklists for avoiding discriminatory practices in pay and performance management processes for all schools.
We evaluate the outcomes and impact of each event by monitoring teachers’ experiences of these consultation conferences. Comments from participants include: ‘this has built my self-esteem as a BME teacher and I now have knowledge of how to tackle workplace bullying’; ‘Challenging and standing up for my rights is one of the things I will take from this conference’; ‘The insight and experiences was very valuable and I realised I’m not the only one who has experienced racism’.
A large proportion of BME teachers are supply teachers or have temporary contracts. They report experiences of prejudice in obtaining full time or permanent work in schools. As a result we work with supply agencies to provide advice on good/nondiscriminatory employment practices process and also provide personal development sessions at these conferences on interview techniques, writing CVs and understanding their employment rights. Many have returned stating that the knowledge they have obtained at these events have been useful in asserting their rights and improving their confidence in seeking employment.
Case study: Lloyds Banking Group – Data initiatives to improve disclosure and diversity champions
At Lloyds Banking Group we have launched regular communication campaigns, sponsored by senior leadership, to encourage colleagues to complete all personal details (including ethnicity, disability, sexual orientation) on our HR system. We have been able to link the request to complete personal data with our Group purpose of Helping Britain Prosper through better representing the customers and communities we serve, whilst also improving the workplace for everyone – giving colleagues a positive reason to share this information. At launch we supported the communication campaign by equipping leadership and line managers with a guidance pack, including FAQs, to help them explain to colleagues the positive benefits of Lloyds Banking Group having accurate data around the diversity of our workforce. Since the launch of our communications campaign we have seen a 4% increase in completion of ethnic origin data across our full employee population, equating to over 3,000 colleagues voluntarily updating their details.
At Lloyds Banking Group we are firmly committed to improving the representation of BAME individuals at all levels, particularly in our senior management population, to better represent the customers and communities we serve. We have invested significant time and resource to analysing our internal data, qualitative and quantitative, to understand the barriers and opportunities for BAME colleagues. We know from this data that we are seeing considerable improvements in hiring and promoting BAME colleagues.
Our Career Development Programme for ethnic minority colleagues receives consistently positive feedback from delegates, and we have been able to show that the promotion rate for colleagues going through the programme is significantly higher than for BAME colleagues who have not been through it.
Appointing ‘diversity champions’ or advocates in each business unit has also been a highly effective strategy, coupled with being able to offer a practical programme of support for BAME colleagues. Our diversity champions have been able to raise the profile of our Inclusion & Diversity ambitions, including the availability of specific development opportunities, across the business.
Case study: University and College Union (UCU) – Engaging with BME staff to understand the obstacles to progression and response to this
UCU has recently conducted a survey of its BME staff in both further and higher education, with a range of questions about their own experiences in the workplace. The survey report, The experiences of Black and Minority Ethnic staff in further and higher education, was published in February 2016 and showed that:
An overwhelming majority (90%) of staff felt they had faced barriers to promotion. Half (50%) said they had not been fully informed of the process for applying for promotion, and three-fifths (59%) reported that senior managers and colleagues had not supported them to progress their career;
- 7 in 10 (71%) respondents said that they had ‘often’ or ‘sometimes’ been subject to bullying and harassment from managers, and 68% said the same was true of colleagues;
- nearly four-fifths (78%) of respondents across post-16 education reported they were ‘often’ or ‘sometimes’ excluded from decision making;
- four-fifths (82%) of respondents across both sectors said they were subjected to cultural insensitivity
The survey also asked BME staff which measures they felt would be most effective in tackling workplace racism. The measures that received most support were ‘effective sanctions against perpetrators of racism’ (68.3%) and ‘improved support for BME staff’ (61%), as well as ‘training for senior staff’ (56.3%).
To accompany the report, UCU produced a short film, ‘Witness’, detailing some of the issues which BME staff face in the workplace. Many of those interviewed reported experiencing ‘covert’ or ‘subliminal’ examples of racism, and this was identified as being harder to tackle than ‘overt’ racism such as namecalling. Interviewees also suggested that many working in the education sector believe it to be quite a liberal environment which supports equality. However, this belief can actually mean that when people draw attention to what they consider to be racism or discrimination, they are taken less seriously.
In response to the challenges faced by BME staff in higher education, the Equality Challenge Unit has introduced a Race Equality Charter (REC), which aims to change institutional culture. Member institutions develop initiatives and solutions for action, and can apply for a Bronze or Silver REC award, depending on their level of progress.
Case study: Ernst & Young (EY) – Inclusive leadership programme and promotion policies
Educating the wider firm
Our long-term work on building an inclusive culture is vital to the success of our firm’s vision. So having identified the need for intervention, we are implementing an Inclusive Leadership Programme (ILP).
The ILP aims to help our people to understand the impact of their own behaviours and how to change those behaviours to enable individuals to achieve their potential. It covers 3 main areas: unconscious bias (commonly addressed by many organisations); insider/outsider dynamics; and intent/impact.
Culture change takes time – and we are therefore patient, while at the same time impatient to interrupt the status quo. The key for the success of the programme to date has been the role modelling from our leadership team. The ownership and accountability lies with them and not with a diversity and inclusiveness team. What we mean is:
- our board challenges the proportion of BME senior promotions and challenges whether we achieve our target to admit 10% BME partners every year
- our HR team challenges the representation of BME people on our leadership programmes
- our resourcing team challenges the way work is allocated to our BME team members
- our recruitment teams have set targets for recruitment of BME people at all levels
The language of inclusion is starting to be used more widely; especially the concept of insiders and outsiders, affinity and confirmation bias, and the phrase ‘interrupt the status quo’. We are starting to use action planning that starts “I will take Jyoti to the AB meeting on Thursday” rather than “We should take more diverse junior team members to client meetings”.
Since the inception of the ILP, 94% of Partners and just over 1,500 of the manager population and above have undertaken the programme. We have seen an increase in BME representation at each level of the firm. Our BME partner representation has gone up from 3% in 2012 to 8% in 2016 and more of our BME population are receiving high performance ratings.
Still, we are not complacent as there is much work to do, but we are confident that including all of our people in the challenge to change will eventually create a more inclusive culture.
Robust performance appraisal and promotion policies
EY is a professional services firm that uses its data-driven approach to get clear insight into the diversity of its workforce. This underpins its proportional promotion process which seeks to advance employees on a representative basis according to the diversity composition of each job level.
For example, with 20% from BME backgrounds at manager level, EY expects 1 in 5 promotions from manager to senior manager to be from ethnic minorities. The process works on a comply or explain basis; if a business unit fails to comply then its HR teams ask for feedback from leaders making promotion decisions on why eligible candidates were unsuccessful and using that feedback works to understand why the target is not being achieved. It then supports business leaders to put in place actions that will improve the likelihood of success. An example of one such action is a review of work allocation according to diversity; this is because they believe that promotion follows great work experience and stretching projects, and if project work is allocated in an unequal way then promotions will also be skewed.
The point is to make the promotion process as fair as possible by challenging leaders to make decisions based on employees’ skills and potential, rather than their characteristics or background, or on what the traditional model of a leader looks like. Since the process began 2 years ago, promotions have become more representative: by the most senior career stage we now have 8% BME partners compared to 3% in 2011.
In tandem with this process we monitor the distribution of performance ratings by ethnicity, to ensure that both the highest and the lowest performance ratings are distributed in a representative way: where they are not, they are challenged in the same way.
Key to the success so far has been buy-in from leaders who value support in uncovering unconscious bias and sharing good practice amongst those who make promotion and appraisal ratings decisions.
Case study: Scottish Trades Union Congress (STUC) – Mentoring and training to support career progression
The STUC believes that the clustering of BME employees in lower grades is a clear area of concern in the Scottish economy. The STUC has been involved in running mentoring and training schemes for BME workers to support career progression in workplaces across Scotland. The STUC Black Workers’ Committee has, with the support of GMB Scotland and Scottish Union Learning, been running ‘Moving into Management’ courses for BME workers in Scotland. The Committee has organised a series of 4 courses that have provided 62 learning places to BME workers across Scotland. These courses have not only focused on providing skills for advancement within the workplace but have also encouraged peer to peer mentoring that allows the outcomes of the course to be pursued even when the course is finished. A key element to the training was a specific focus on racism, and the direct support that was offered around building networks and resilience.
To date the course has proved very popular, with places on the most recent course being filled in a matter of days. They have also been evaluated very well, with many participants finding the learning extremely valuable. From the feedback received we have also heard specific examples of workers gaining promotion as a result of the course and the skills gained from the learning.
The STUC has also run a mentoring project in Further and Higher Education (FE/HE) in Scotland for BME staff members, to support them to move into more senior positions. This scheme was designed to support the advancement of BME staff through training and peer mentoring. Core to the success of such schemes, however, is a parallel focus on institutional barriers to advancement and recognition from senior management that within the organisation BME workers are over-represented in the lower grades.This organisational focus combined with specific training for managers, training and support for BME workers and a shared desire to change outcomes in the organisation, can produce meaningful change that benefits both workers and employers. Feedback from those who took part showed that:
- 73% reported an increase in personal confidence
- 64% reported increased confidence in their jobs
- 54% felt that participation had helped them develop professionally
Of those who responded to the final monitoring requests (after completion of the project) 60% had applied for new roles at the same FE/HE institution or at another FE/HE institution.
Case study: Royal Bank of Scotland (RBS) – Unconscious bias training
To help understand the impact of unconscious bias on our people and the organisation, in 2014, RBS undertook unconscious bias testing (across the UK and internationally) around disability, sexual orientation, age, ethnicity and gender leadership. The purpose of this was to understand how unconscious bias was affecting the organsiation and what training we could introduce to help mitigate against it.
From the findings, RBS created a tailored training programme with targeted interventions aimed at each level of the organisation. This programme consisted of a workshop for senior leaders, a webinar for those with managerial responsibilities, and scenario based e-learning for all employees.
In 2015, our Executive Committee was dedicated to rolling out unconscious bias training across the bank as part of building the foundation for our Inclusion agenda; specifically, to improve our awareness of how our biases can influence us to make poor decisions.
Since introducing the training, across RBS to date, over 40,000 employees have undertaken the training. As a result of the training,
- 96% of participants would recommend the training to a friend
- 97% report that they will ‘do their job differently’
Some of the tangible ways they have been doing this are by:
- revisiting talent and succession plans with a BAME (and gender) focus
- requiring more diversity on all shortlists (for example, at least one woman or BAME candidate) and consider more non-traditional candidates for certain roles (for example, part time, retirees, carers)
- looking more broadly at who they consider for example, mentoring more diverse groups of people, specifically BAME and female talent
To support our understanding of the impact of the training, we have put mechanisms in place to track and analyse the recruitment and retention of BAME employees.
We do recognise that there is no magic wand or silver bullet. Therefore, the unconscious bias training is only one element in a wider inclusion programme of work. This training is providing the fundamental foundation for future areas of the Inclusion agenda and is part of a wider range of initiatives across the bank.
The business impact of the Unconscious Bias training
Examples outlined in the feedback received to date demonstrate the impact the unconscious bias training is having: building a stronger pipeline of BAME individuals, improvements in our recruitment and performance management/promotion processes and creating an environment where employees feel they can be themselves. By helping individuals be more aware of their biases, the training is driving positive change across the organisation.
Overall, the feedback shows that the training is affirming how internal reflection and awareness can help people approach their day to day activity differently; helping managers to mitigate their bias in their leadership and have a positive impact on colleague and customer engagement. For example:
Leadership
Strengthening leadership actions and positively influencing decision making – helping leaders become more reflective and considerate in how they lead, the tone they set, and the decisions they make:
- Leaders are more aware of how their behaviours affect the work environment. Leaders are committing to role model an unconscious bias approach, leading by example; being mindful of the language used, making more considered decisions, and challenging inappropriate behaviour.
Transforming the way we build and develop teams using techniques from Determined to Lead (our leadership programme):
- Leaders are reviewing their team’s strengths to provide more stretching development opportunities based on each individual’s needs and ensure each individual has the clarity and capability to complete the required task;
- Openly discussing unconscious bias in team meetings, using techniques from Determined to Lead to embed key messages – for example, looking at individuals’ motivational drivers to help the team learn from each other and work together more effectively, valuing the differences people bring to their teams, and improving coaching techniques to embed the learning.
Recruitment and retention
Changing recruitment practices, reviewing talent development and better performance management:
- revisiting talent and succession plans with a new perspective
- adopting a more joined up approach with their peers to create a plan that is more inclusive of different people
- banning same gender panels, requiring more diversity on all shortlists (for example, at least one woman or BAME candidate), and considering more non-traditional candidates for certain roles (for example, part time, retirees, carers)
- looking more broadly at who they consider talent – for example, mentoring more diverse groups of people, specifically BAME and female talent
Case study: NHS – Actions to drive race equality
NHS Workforce Race Equality Standard
The NHS has a particular responsibility to address race inequality in employment since we now have convincing evidence of the scale of race discrimination, and the impact this has on NHS organisations, staff and patient care. That is why the NHS Equality and Diversity Council, which brings together all major national bodies in the NHS, has for the first time in the history of the NHS supported a contractual requirement to drive race equality in the employment of NHS staff.
The Workforce Race Equality Standard, as of 1 April 2015, is written into the NHS Standard Contract and requires all NHS providers, except the very smallest, to collect, analyse and publish workforce data on the proportions of NHS staff from BME backgrounds across all professions in every grade, including senior grades.
There are also contractual requirements to:
- publish the proportion of Trust Board members from BME backgrounds compared to the proportion of the workforce from such backgrounds
- publish the relative likelihood of BME staff being appointed once shortlisted compared to the likelihood of White staff being appointed once shortlisted; *collect, analyse and publish the relative likelihood of BME staff accessing non-mandatory training, including that which is designed to improve their career opportunities
- the purpose of collecting, analysing and publishing this data is so that NHS providers meet the new contractual requirement to close the gap between the experience and treatment of BME NHS staff and White NHS staff
- in addition, a new assessment framework for Clinical Commissioning Groups will enable them to better monitor this contract. We expect Trust Boards to consider this data and publish action plans on how the gaps identified will be closed. The Care Quality Commission, for the very first time, has included consideration of whether NHS providers are implementing the Workforce Race Equality Standard into its ‘well led’ domain on inspections. This is because healthcare organisations that are failing their BME staff may well be at risk of not being well led organisations.
- the national contractual requirement is to close the gap in treatment and experience against the 9 indicators of the Workforce Race Equality Standard. We expect individual NHS organisations to set local targets on precisely how they will close the gaps identified and they know that these will be monitored and inspected against nationally. We know that some Trusts are developing innovative and effective evidence-based approaches to making sustainable progress because they recognise the benefits to staff and patients of doing so. The contractual and regulatory framework which is now in place seeks to ensure that all NHS providers make such progress.
- the Equality and Diversity Council will, from time to time, be publishing reports on progress made against the NHS staff survey findings, 4 of which helps to form part of the Standard which we expect will focus Board attention. This government is determined to tackle the discrimination against BME staff in the NHS since it not only adversely impacts on staff but on the care provided to patients.
Bradford Teaching Hospitals NHS Foundation Trust
Bradford Teaching Hospitals NHS Foundation Trust (BTHFT) employs around 5,500 people. It is a large acute hospital serving a population of over half a million. The population of Bradford is ethnically diverse, with 33% BME population, 27% of whom are from Asian or Asian British heritage. The district has the largest proportion of people of Pakistani ethnic origin (20.3%) in England.
In 2012, the Trust began mapping the comparative success of White and BME shortlisted candidates who were successful in getting jobs. It found that across all posts, White candidates had a 1 in 5 chance of being appointed, while BME candidates had a 1 in 8 chance. At the senior pay bands in the Trust (Bands 8 and 9) BME shortlisted candidates had a 1 in 17 chance of appointment compared with one in 4 for White candidates. This position worsened between April 2012 and March 2013 when no BME shortlisted candidates were appointed in the previous 12 months. At least 4 BME candidates should have been appointed to these Bands, if other things had been equal.
The Trust Board was determined this must change. Equality briefings were devised for all senior managers with responsibility for managing teams, chairing recruitment panels and undertaking disciplinary action, grievance or investigation processes. Briefings include the data outlined above and looked in detail at potential reasons for the disparity in outcomes for White and BME candidates, including looking at conscious and unconscious bias. When no BME people had been appointed at Bands 8 and 9 in 2012 to 2013, further action was taken:
- all posts had to be externally advertised unless organisation change applied
- the Head of Equality or Assistant Director of Human Resources sat on all interview panels for these posts for a trial period to determine whether there was any evidence of discriminatory practice
- the Head of Equality was to contact every BME who had been shortlisted but failed to attend interview to determine whether there were any patterns to non-attendance
The vast majority of the equality briefings took place between April and September 2013. In that time the chance of White and BME people being appointed was exactly the same at 1 in 4 chance. Unfortunately the positive effect was not sustained and the employment chances fell away to one in 14. As a result of the slippage in performance, in February 2015, the Board of Directors set a target for our workforce to be made up of 35% BME staff by September 2025. They monitor the employment position of BME staff in relation to overall staffing numbers, senior manager numbers, promotion and turnover. Every 6 months the Board sees the progress made on the numbers and position of BME people in our workforce. To reinforce the importance the Trust places on this initiative, each Division is performance managed against the targets every 6 months. The first 12 months data is encouraging:
- overall staffing numbers – increased from 24.7% to 26.8%
- senior manager numbers – increased from 7.6% to 10.2%
- turnover – lower numbers of BME leaving than might be expected at 22.3%
Case study: National Union of Teachers – Development programme for BME teachers
Equal Access to Promotion (EAP) is a professional development programme specifically designed to support greater promotion pathways for Black teachers. It is open to school-based Black teachers with middle management/leadership roles and responsibilities who wish to develop their leadership skills and understanding and/or are considering taking on further leadership responsibilities. To be eligible to apply applicants need to be in their fourth to twelfth years of teaching.
The programme has been successful and evaluations were very positive. Teachers confirmed that motivation and confidence building were some of the identified needs the programme had met. They considered EAP to be more relevant to meeting their personal development needs than generic leadership development programmes. Teachers’ comments also confirmed that they consider EAP to be of very high quality in focusing them in the right direction towards career progression.
Teachers rated very highly the provision of a safe, non-judgemental and nurturing environment, which gave them the needed opportunity to learn and practise new skills and capabilities. Teachers also commented positively about the opportunities offered by the programme to network with other colleagues of similar backgrounds and experiences. The programme filled a gap in that they found access to a support group with whom they could share their work and career with positive regard and respect was very comforting and reassuring.
Of all the value added discerned in participants’ comments, the availability of role models and mentors in the form of motivating and inspiring practising Black head teachers and school leaders as facilitators on the programme stood out. Most participants rated this as the most important and unique element of the programme. They found it reassuring that others like them have had to overcome the odds and made it to leadership positions and if they had done it and were available to guide and mentor them, then it would not be an impossible task. It gave them a lot of encouragement and gave a boost to their confidence.
Case study: KPMG – People development
Context – Data and insight
In 2014, KPMG published its diversity target zones to encourage better representation for gender, disability, sexual orientation and ethnicity across the firm and at senior levels. We continue to recognise the commercial, creative and cultural benefits brought about by an inclusive environment and a more diverse workforce.
Within the BAME population, KPMG identified that particular attention needed to be paid to the representation of Black and Mixed colleagues. Our employee data around ethnicity is robust at approximately 94% declaration. We found patterns of difference around the career experiences of Black and Mixed vs. Asian and White colleagues. In publishing its diversity target zone for ethnicity KPMG set a clear focus on increasing our Black and Mixed ethnic diversity at senior levels.
The results of KPMG’s biannual employee survey showed encouraging trends that engagement across all staff groups had improved in comparison with the previous reporting year. BAME employees showed the same or slightly better engagement scores when compared to their White counterparts across a number of indicators – including overall satisfaction with KPMG as an employer, wellbeing, learning and development, and communication.
Specific analysis of the qualitative feedback revealed one clear opportunity for improvement – to enhance career development in a way that impacted on the overall sense of engagement and feeling valued. KPMG co-sponsored the Business in the Community report Race at Work – the largest ever survey on race and employment in the UK – to advance our thinking. Race at Work showed that career achievement was a clear priority for Black employees across the UK.
What KPMG is doing – Developing people
KPMG recognised the value of people development as a way to address both the immediate challenges around engagement and longer-term pipeline aspects of building a diverse workforce. We are building and expanding on our mentoring programmes within a broader set of development activities aimed at linking employee experience, career progress and our target zones for Black and Mixed staff.
KPMG’s diverse talent development programme, GROW, is targeted at manager-to-director grades from our target zone groups (women, LGBT, disabled, and Black and Mixed colleagues). It is designed to deliver stretching personal and professional development to help colleagues embrace their authentic leadership style, with a strong emphasis on mentoring. Participants will be connected with sponsors as part of their transition out of the programme. Mentoring takes the form of peer-to-peer relationships within the programme with the expectation of transferring learning to, and encouraging career conversations with, diverse mentees as an inclusive leadership outcome.
The GROW programme is sponsored by Melanie Richards, Vice-Chairman of KPMG and will see 2 more cohorts commencing during FY17 – bringing the total to 96 participants. At this point in the programme we are making changes to the nomination process to reach a greater proportion of Black and Mixed colleagues.
KPMG is spreading the value of peer mentoring through its African and Caribbean Network (ACN). KPMG has recently completed a cross-organisation peer mentoring partnership for BAME network colleagues with the Department for Transport. This model of mentoring benefits from deeper enquiry, greater challenge from an outside perspective and the exchange of different ‘career content’, including networks, development strategies and resources. The feedback from this programme showed the clear value of the programme to delegates. We are scoping out the second phase of the mentoring partnership with Department for Transport which will extend the Programme to a mixed cohort.
Vitally, these efforts to improve diverse talent development have led to bottom-up change stemming from our ACN. The ACN chair participated on GROW in 2015 to 2016 and is collaborating with KPMG’s Diversity and Inclusion team to lead a programme of activity across attraction, retention, people management and development. Starting with focus groups in July 2016, the ACN secured sponsorship from the Managing Partner and UK People Director to improve the career experiences and outcomes of Black and Mixed staff. Thishas already incuded shifts around our approach to Black and Mixed graduate attraction and agreement to embed reciprocal mentoring with senior partners.
Whilst it is too early to share outcomes from this corporate plan, KPMG is clearly committed to leading on this agenda and we are optimistic that these changes will shift the experiences and outcomes for Black and Mixed colleagues and encourage progress beyond our firm.
Case study: Herbert Smith Freehills – Good practice for publishing statistics
We carry out an annual audit across all diversity strands to monitor our demographics and inclusion indicators. This is done anonymously, which encourages participation and disclosure. The audit is fully supported by senior management. We publish our statistics and the results inform the development of our diversity and inclusion programmes. We have a multiculturalism network which also fully supports the audit. When monitoring, it is important to give people confidence in the purpose of collecting the data, how it will be stored and used and by whom.
From 2012 to 2015, representation of BAME in the firm has increased from 14% to 17%. We have had a particular focus on graduate recruitment (GR) and increasing BAME representation in our Trainee Lawyer population as the basis for building a more diverse talent pipeline. BAME trainees have increased from 18% to 32% as a result of this focus (working with Rare recruitment which specialises in top BAME graduates, hosting GR panel events on multiculturalism, and providing unconscious bias training to GR recruitment partners).
Case study: Arts Council England (via Citizen Space) – Programmes to increase ethnic diversity in specific industries
Critical Mass programme
The Critical Mass programme at the Royal Court Theatre is aimed at emerging or developing BAME playwrights and creates structured opportunities in creative writing and skills development, along with showcasing their work and linking them with relevant sector agencies and organisations. Previous participants have gone on to have their work performed by professional actors.
Inspire programme
The Inspire programme, part funded by Arts Council England was aimed at attracting more BAME curators in museums and galleries. It gave the opportunity for BAME people with some experience in the cultural sector to undertake 2-year work placement opportunities. A number of participants have progressed to Curators.
Change Makers fund
Arts Council England is in the process of delivering the Change Makers fund to increase the diversity of senior leadership in the arts and culture sector. A cohort of BME and disabled potential leaders will undertake a training and leadership programme, hosted by a lead organisation and designed to develop the leadership skills and experience of BME and disabled potential leaders. This programme should assist potential BME leaders in progressing to leadership roles in the sector.
Case study: Taylor Bennett Foundation (TBF) – Industry-specific training courses
The Taylor Bennett Foundation is a registered charity seeking to address the need for greater diversity in PR by finding and preparing talented university graduates from ethnically diverse backgrounds for careers in the communications industry.
The PR industry struggles to attract and recruit young people from ethnically diverse backgrounds. According to the 2013 PRCA and PR Week Census only 8% of PR practitioners are non-White. The Foundation is a model for how other industries can engage with the imperative of diversity and the challenge of recruitment.
The Foundation provides 10-week intensive training courses delivered in partnership with top tier PR agencies and businesses. Trainees are paid a training allowance (the equivalent of the minimum wage) plus travel expenses. As of September 2016, 167 trainees have gone through the programme since launch in 2008.
Over 400 graduates have had the opportunity to attend a full day’s assessment by experienced head-hunters and PR professionals and receive personal feedback on their performance, regardless of their success in securing a place on the programme.
Over 100 organisations have contributed their time or financial support to the programme, typically on a repeat basis. In 2016 the Foundation also launched a 6-month mentoring scheme for BME graduates, partnering them with PR industry mentors and aim to have 100 mentorships completed by December 2017.
Today, alumni of the TBF programme are working in high calibre companies and PR agencies, including: ACCA, Battenhall, the BBC, Brunswick, Deloitte, DiversityInCare, Edelman, Finsbury, FleishmanHillard, FTI Consulting, Golin, Health Education England, ITV, Ketchum, L’Oreal, MHP, Porter Novelli, Tata Group, The Red Consultancy, Thomson Reuters, and Vodafone.
- 75% of alumni are working in PR and 93% are in confirmed employment (whether in PR or elsewhere)
- 76% have had a rise in salary in the last year. The average alumni salary is £26,000 calculated across the range of alumni with between one and 7 years of experience since completing the programme; according to the graduate jobs and information site, Prospects, a typical graduate starting salary in PR is £18,000 to £20,000
- 59% of alumni have taken a new role in the last year, and a marked pay increase can be seen according to years of experience
Case study: PwC – Inclusion and supporting talent
Motivation:
At PwC we are committed to creating an inclusive culture where everyone can reach their full potential, value difference and be themselves at work. For us diverse teams are a business advantage and we want to reflect our clients and the wider world. We have monitored the diversity of our pipelines since 2011 but recognised that if we really want to move the dial on diversity we needed to make some systemic changes to how we attract, retain and promote our people. This also had to cover all aspects of difference, not just gender and, through monitoring our pipelines, we concluded that we needed to work harder at attracting, advancing and retaining ethnic minority talent.
Actions we are taking:
Recruitment
In 2009 BAME students made up only 23% of our overall student intake. So we set ourselves a target for 30% of our student hires to be BAME. We aimed to reach our target in a number of ways:
- Removed UCAS scores as entry criteria for our graduate roles. In May 2015 we were the first large employer to remove UCAS scores as entry criteria for the majority of our graduate roles as a way to broaden access to our profession and make sure we were assessing people on their potential and not their backgrounds.
- Extended the schools and our Back to Schools programme. We combined our schools recruitment and community affairs team to ensure a coordinated approach to our schools outreach programme. We recognised that we needed to target a wider range of schools to raise aspiration about different career options to a more diverse student group and reach a greater number of students.
- Extended the universities we engage with. We’ve also increased the number of UK universities we have a relationship with and now recruit from over 90 universities.
Engagement
The PwC Diversity Career Mentoring programme. We know that a lack of, and access to, role models is a barrier to BAME employees’ career progression so we decided to use our own people to inspire the next generation and provide more visible role models. The PwC Diversity Career Mentoring programme was set up in 2013 to provide university students from diverse ethnic and socioeconomic backgrounds with mentors from within the PwC business. The mentors provide students with insight on life at PwC as well as sharing tips and advice on cv writing, job application skills, the firm’s recruitment channels and general guidance on employability skills required for working life.
Sponsorship programme for high potential BAME directors. We know that BAME staff are less likely to have career sponsors, which can impact their allocation to jobs, the roles they have and their career progression. To address this, we started an active sponsorship programme for high potential BAME and female directors and senior managers, called Talent Watch, to ensure that all high potential people are actively sponsored on their career and can address any barriers.
Measurement
We have set ethnicity and gender targets for manager level and above, which provide direction and drive the promotion, recruitment and retention activities that underpin them. This year we have published our targets, and progress against them, in our digital annual report. We believe that greater transparency drives accountability and targets action where it is needed most. Business leaders are also accountable for these targets and for driving change where it is needed.
Our results:
These interventions are producing measurable results, but we recognise that we need to keep up the focus and attention on this important area of diversity to make a sustainable difference.
Recruitment
Our combined efforts are starting to change the profile of our student intake. Since removing UCAS scores we have hired graduates from broader social backgrounds than ever before. In our 2015 student intake of over 1,600, 36% were first generation graduates, 72% attended state school, 11% came from homes eligible for income support and 8% were eligible for school meals. We track the social mobility of our graduate in-take and report it in our digital annual report.
In our 2016 graduate intake, 39% of our joiners are BAME, compared to 21.4% of the UK graduate population. We have also recruited more graduates from non-Russell Group universities. 69% of 2016 graduate intake are from Russell Group Universities, down from 73% in 2014.
Engagement
To date, 70 PwC staff have volunteered to be mentors to our Diversity Mentoring programme and 144 mentees have completed the programme. 6 mentees have gone on to successfully join PwC, working across a range of client facing areas. Others have gone on to pursue professional careers elsewhere. The programme has been so successful that it is now being extended to our regional offices to provide mentors to more people.
b. Literature review
This literature review summarises the key academic evidence and analysis on the progression of BME individuals in the UK labour market. It covers the population of ethnic groups in the UK, the picture for BME groups in the labour market, the pipeline of BME talent from education, the business case for change, the barriers to progression in work experienced by BME individuals and the evidence available on what works.
Ethnic groups in the UK population
14% of the UK population identify as BME[footnote 20]. This is increasing, with the proportion expected to increase to 21% by 2051[footnote 21].
We use Office for National Statistics (ONS) groups to define ethnicity. According to these definitions, and using the latest 2011 Census data, White is the ethnic group with which the majority of people identify – 48.2 million people (86.0% of the population). Within this group, the largest proportion of people identify themselves as being White British – 45.1 million (80.5%), followed by Any Other White – 2.5 million (4.4%). The next largest ethnic group with which people identify is Indian – 1.4 million people (2.5%), followed by Pakistani – 1.1 million (2.0%)[footnote 22]. The level of ethnic diversity in the UK continues to increase over time. All non-White groups in the UK have been growing since 2001[footnote 23]. Projections by the University of Leeds predict large differences in the growth of ethnic minority groups to 2051, with the White British group growing by 4% but the BME share of the population expected to increase to 21%[footnote 24].
What is the picture for Black and Minority Ethnic groups in the UK labour market?
Evidence shows that there is a persistent though decreasing employment gap between BME groups and the White population. The difference between the BME and White employment rates was 12.8 percentage points in 2015[footnote 25]. BME individuals in work tend to be overrepresented in lower paid occupations and sectors, and are underrepresented in higher paid occupations (such as professional and managerial roles)[footnote 26],[footnote 27].
Extensive research now exists pointing to the presence of ethnic inequalities in employment, which have persisted over time. Not only are there disparities in the proportions of people from BME groups getting into work compared with White people (with the consequence that BME individuals are more likely to be unemployed – see next section), but the evidence also points to:
- inequalities in types of occupation, indicating that BME individuals are less able to secure career opportunities aligned to their skills and qualifications
- inequalities in contract types and degrees of job security
- wage differentials and an overrepresentation of BME individuals in low paid jobs
- differences in working hours and in levels of self-employment
- barriers to progression up the career ladder for some ethnic minority groups
Compounding the challenge of identifying and tackling the issues of labour market entry and progression inequalities for BME individuals is the variance in the scale and nature of the problems by ethnic group, gender, region, age, class and migrant status (including whether someone is a first, second or third generation migrant). In addition, it is obvious that BME individuals are not just one group and labour market inequalities vary by ethnic group.
The combination of the factors identified above that determine labour market outcomes makes capturing the whole picture of the challenge very difficult. Therefore, it is necessary to consider the issues facing BME individuals in the labour market in some detail, to account for the wide discrepancies across the BME population.
The employment and unemployment gap
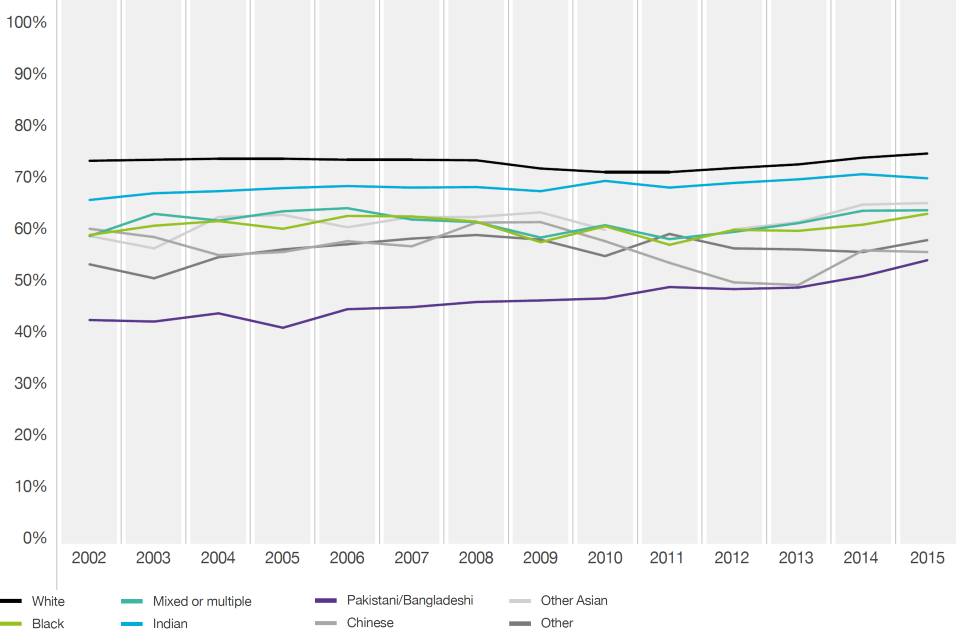
Graph 1: Employment rate by ethnic group, Great Britain, 2002 to 2015. Source: DWP, 2016[footnote 28]
""
| Employment rate by ethnic group | 2002 | 2003 | 2004 | 2005 | 2006 | 2007 | 2008 | 2009 | 2010 | 2011 | 2012 | 2013 | 2014 | 2015 |
|---|---|---|---|---|---|---|---|---|---|---|---|---|---|---|
| White | 74.2% | 74.4% | 74.6% | 74.6% | 74.4% | 74.4% | 74.3% | 72.7% | 72.0% | 72.0% | 72.8% | 73.5% | 74.8% | 75.6% |
| Black | 59.8% | 61.6% | 62.5% | 61.0% | 63.5% | 63.4% | 62.4% | 58.4% | 61.5% | 57.9% | 60.8% | 60.6% | 61.8% | 63.9% |
| Mixed or multiple | 59.6% | 63.9% | 62.6% | 64.4% | 65.0% | 62.8% | 62.3% | 59.3% | 61.7% | 59.0% | 60.4% | 62.1% | 64.5% | 64.6% |
| Indian | 66.6% | 67.9% | 68.3% | 68.9% | 69.3% | 69.0% | 69.1% | 68.3% | 70.3% | 69.0% | 69.9% | 70.6% | 71.6% | 70.8% |
| Pakistani/Bangladeshi | 43.3% | 43.0% | 44.6% | 41.8% | 45.4% | 45.8% | 46.8% | 47.1% | 47.5% | 49.7% | 49.3% | 49.6% | 51.8% | 54.9% |
| Chinese | 61.0% | 59.4% | 55.9% | 56.5% | 58.6% | 57.6% | 62.2% | 62.3% | 58.6% | 54.4% | 50.6% | 50.1% | 56.8% | 56.5% |
| Other Asian | 59.6% | 57.2% | 63.3% | 63.7% | 61.3% | 63.3% | 63.3% | 64.2% | 60.8% | - | 60.9% | 62.3% | 65.7% | 66.0% |
| Other | 54.1% | 51.4% | 55.5% | 57.0% | 58.0% | 59.1% | 59.8% | 58.9% | 55.7% | 60.0% | 57.2% | 57.0% | 56.5% | 58.8% |
Data from the Department for Work and Pensions (DWP) on the unemployment rate of individuals by ethnic group illustrates not only that BME individuals are more likely to be unemployed, but that the problem has persisted over time and varies significantly by ethnic minority group[footnote 29]. Graph 1 indicates that the employment rate of the White group has continuously been higher than that of any ethnic minority group[footnote 30]. The gap between the BME and White employment rates was 12.8 percentage points in 2015, down from 16.6 percentage points in 2002. Among ethnic groups, Indian individuals tend to have the highest employment rates. In contrast, employment among the Pakistani and Bangladeshi group has been persistently much lower than among all other groups, despite an upward trend in the last 10 years.
Joseph Rowntree Foundation’s (JRF) research suggests that changes in employment patterns over time could be described as positive for the Indian, and to some extent Chinese, ethnic groups[footnote 31]. However, their key message was still one of enduring ethnic minority disadvantage compared with the White British group. Their further research suggests that existing labour market inequalities are likely to persist in the medium term[footnote 32].
The overall employment rate masks a number of variances within ethnic minority groups by gender and levels of participation. Examples of the key underlying variances include:
- Minority groups are disproportionately affected by youth unemployment, with the unemployment rate of the young Black group (30.3%) more than double that of the young White group (13.3%)[footnote 33]
- There are high rates of unemployment amongst Pakistani/ Bangladeshi women, despite falling in recent years from over 24.0% in 2012 to 15.0% in 2015. It is still significantly higher than the White female unemployment rate of 4.6%[footnote 34]
- Despite falling over the last decade from 51.1% in 2005 to 37.9% in 2015, high levels of economic inactivity remain amongst Pakistani/Bangladeshi groups. Female rates of inactivity are significantly higher than the male rates at 57.2% in 2015[footnote 35]
- Employment gaps persist across all regions in the UK, but are particularly high in the North East, Yorkshire and the Humber, Northern Ireland and Wales[footnote 36]
- Research has found that labour force exit and entry probabilities do not differ between Indian, Caribbean and White women. However, Pakistani and Bangladeshi women are less likely to enter and more likely to exit the labour market. In contrast, Black African women have comparatively high re-entry rates[footnote 37];
- Self-employment is an important form of employment for BME men, particularly the Pakistani group, with over 30% of Pakistani men in employment being self-employed. The self-employed are mainly concentrated in sectors such as retail, restaurants and taxi-driving. Self-employment rates are lower for the Chinese and Indian groups. Among women, self-employment rates are significantly lower than the male self-employment rates for all ethnic groups[footnote 38]
Overrepresentation in lower paid and lower skilled jobs
JRF reports that a higher proportion of BME individuals tend to work in low paying occupations, including sales, catering, elementary personal services, hairdressing, textiles and clothing[footnote 39]. Conversely, they are often underrepresented in higher paid jobs such as building, metalworking and chemical operatives, printing, plant and machine operatives, security and protective services, and in industries where ethnic minorities thrive, such as clerical, secretarial work, cashiers, some communications work, buyers and brokers’ agents[footnote 40]. JRF reports that within occupations there is relatively little inequality between BME and White British people, but nonetheless BME employees are more likely to be the lowest paid within their job type and in the lowest paid types of job. In addition, ethnic minority workers (9%) are more likely to work in temporary employment than White workers (5.5%)[footnote 41].
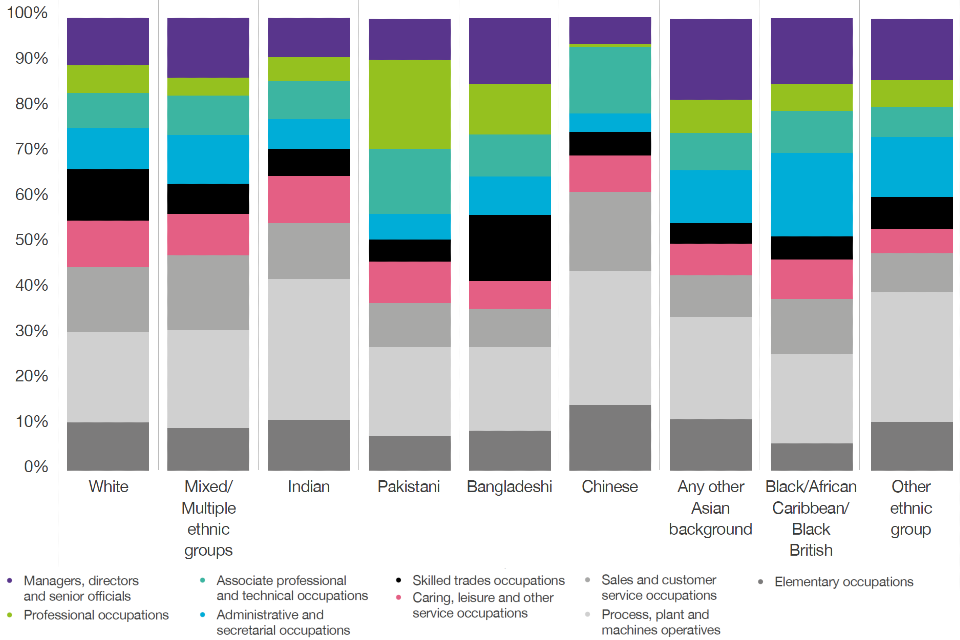
Graph 2: Proportion of individuals in each occupation group, by ethnic group, Quarter 1 2016. Source: ONS Labour Force Survey, 2016[footnote 42]
""
| Proportion of individuals in each occupation group | White | Mixed or multiple | Indian | Pakistani | Bangladeshi | Chinese | Other Asian | Black | Other |
|---|---|---|---|---|---|---|---|---|---|
| Managers, Directors And Senior Officials | 10.5% | 9.3% | 11.1% | 7.6% | 8.7% | 14.3% | 11.2% | 5.8% | 10.6% |
| Professional Occupations | 20.0% | 21.6% | 31.1% | 19.6% | 18.5% | 29.6% | 22.7% | 19.8% | 28.7% |
| Associate Professional And Technical Occupations | 14.4% | 16.6% | 12.4% | 9.7% | 8.5% | 17.6% | 9.1% | 12.2% | 8.6% |
| Administrative And Secretarial Occupations | 10.3% | 9.2% | 10.5% | 9.2% | 6.1% | 8.1% | 7.1% | 8.8% | 5.5% |
| Skilled Trades Occupations | 11.3% | 6.7% | 6.0% | 4.9% | 14.6% | 5.2% | 4.5% | 5.1% | 7.0% |
| Caring, Leisure And Other Service Occupations | 9.2% | 10.7% | 6.5% | 5.7% | 8.5% | 4.1% | 11.7% | 18.4% | 13.3% |
| Sales And Customer Service Occupations | 7.7% | 8.7% | 8.5% | 14.4% | 9.3% | 14.7% | 8.3% | 9.3% | 6.6% |
| Process, Plant And Machine Operatives | 6.1% | 4.0% | 5.3% | 19.7% | 11.1% | 0.7% | 7.3% | 6.0% | 6.0% |
| Elementary Occupations | 10.6% | 13.3% | 8.7% | 9.1% | 14.7% | 5.9% | 18.0% | 14.6% | 13.6% |
A further study by JRF reports that employed BME individuals from some ethnic minority groups are more likely to work in certain occupation types, making the distribution of BME groups unequal across occupational types[footnote 43].
Graph 2 illustrates that whilst some ethnic groups have a high proportion of employed individuals working in managerial and professional occupations, including the Chinese (43%) and Indian (42%) groups, other groups such as the Bangladeshi group(27%) have the lowest proportion of its workforce in these roles. In addition, within highly paid sectors Chinese and Indian groups actually face a larger wage gap than BME individuals in the low paying sectors, which indicates that within these sectors these individuals struggle to reach the most highly paid positions[footnote 44].
Conversely, certain ethnic groups are disproportionately represented in elementary occupations and process, plant and machine operatives, such as the Pakistani (29%) and Bangladeshi (26%) groups, compared with only 17% of the White group working in these occupations. In addition, JRF notes that intermediate skills occupations are generally dominated by particular ethnic groups. For instance, the African group has the largest share in personal service occupations such as hairdressing and beauty, the Bangladeshi and Pakistani group has the largest shares in sales and customer service occupations, and process, plant and machine occupations (for example, textile, plastics and metalworking machine operatives) are most common for the Pakistani group.
Where the occupations dominated by certain BME groups are low-skilled, this could be a sign of difficulty in getting other forms of employment or a stereotyping of BME individuals into particular jobs. Whilst strong representation in managerial and professional roles might be seen as a story of success for some BME groups, JRF points out that managerial roles could also indicate self-employment[footnote 45].
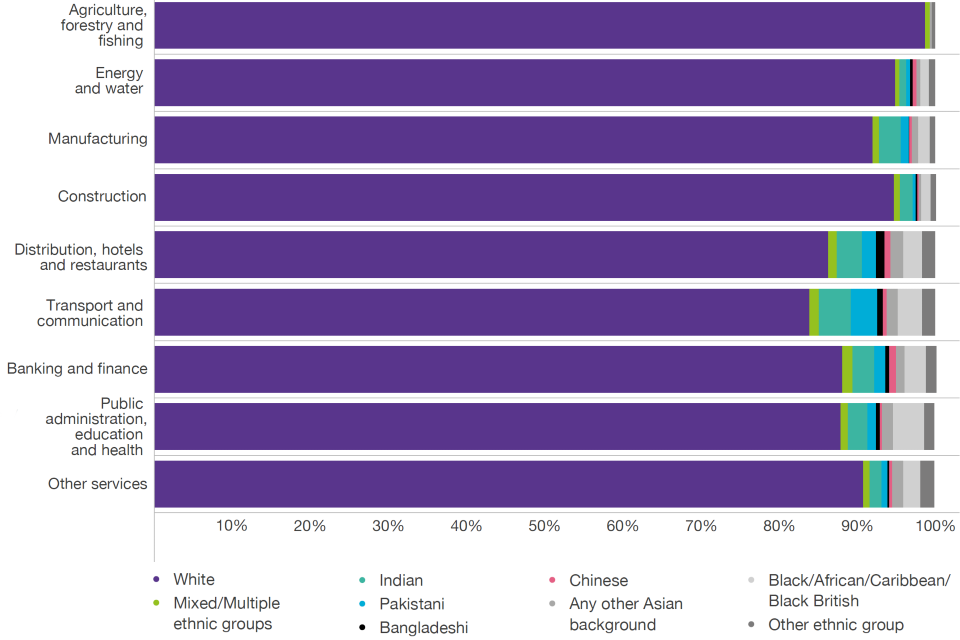
Graph 3: Proportion of individuals in each sector, by ethnic group, Quarter 1 2016. Source: ONS Labour Force Survey, 2016[footnote 46]
""
| Proportion of individuals in each sector | White | Mixed or multiple | Indian | Pakistani | Bangladeshi | Chinese | Other Asian | Black | Other |
|---|---|---|---|---|---|---|---|---|---|
| Agriculture, forestry and fishing | 98.7% | 0.6% | 0.0% | 0.0% | 0.0% | 0.0% | 0.3% | 0.0% | 0.4% |
| Energy and water | 94.9% | 0.5% | 0.9% | 0.5% | 0.3% | 0.5% | 0.5% | 1.1% | 0.8% |
| Manufacturing | 92.0% | 0.8% | 2.8% | 1.0% | 0.1% | 0.3% | 0.8% | 1.5% | 0.7% |
| Construction | 94.7% | 0.8% | 1.6% | 0.4% | 0.2% | 0.2% | 0.3% | 1.2% | 0.7% |
| Distribution, hotels and restaurants | 86.3% | 1.1% | 3.2% | 1.8% | 1.1% | 0.8% | 1.6% | 2.4% | 1.7% |
| Transport and communication | 83.9% | 1.2% | 4.1% | 3.4% | 0.7% | 0.5% | 1.4% | 3.1% | 1.7% |
| Banking and finance | 88.1% | 1.3% | 2.8% | 1.4% | 0.5% | 0.9% | 1.1% | 2.7% | 1.4% |
| Public admin, education and health | 87.9% | 0.9% | 2.5% | 1.1% | 0.5% | 0.3% | 1.4% | 4.0% | 1.3% |
| Other services | 90.8% | 0.8% | 1.5% | 0.8% | 0.2% | 0.4% | 1.4% | 2.2% | 1.8% |
Similarly, it is interesting to examine how ethnic minorities are distributed across sectors. Graph 3 looks at ethnic group employment by sector. Again, a number of concentrations stand out; for example, some sectors such as transport and communication and distribution, hotels and restaurants exhibit relatively high proportions of BME individuals within their workforce. In contrast, within other sectors, such as agriculture, forestry and fishing; and energy and water, the large majority of employees are White.
Projections by JRF show that the occupational structure of employment is expected to polarise to 2022, with projected increases in high pay and low pay occupations of 2.34 million and 0.52 million respectively, whereas occupations associated with middle-level skills are projected to decrease by 1.01 million[footnote 47]. These forecasts predict Indian and Chinese groups will be concentrated in highly paid occupations, while Pakistani, Bangladeshi, Black and other Asian groups will continue to be overrepresented in the low paid to intermediate sector.
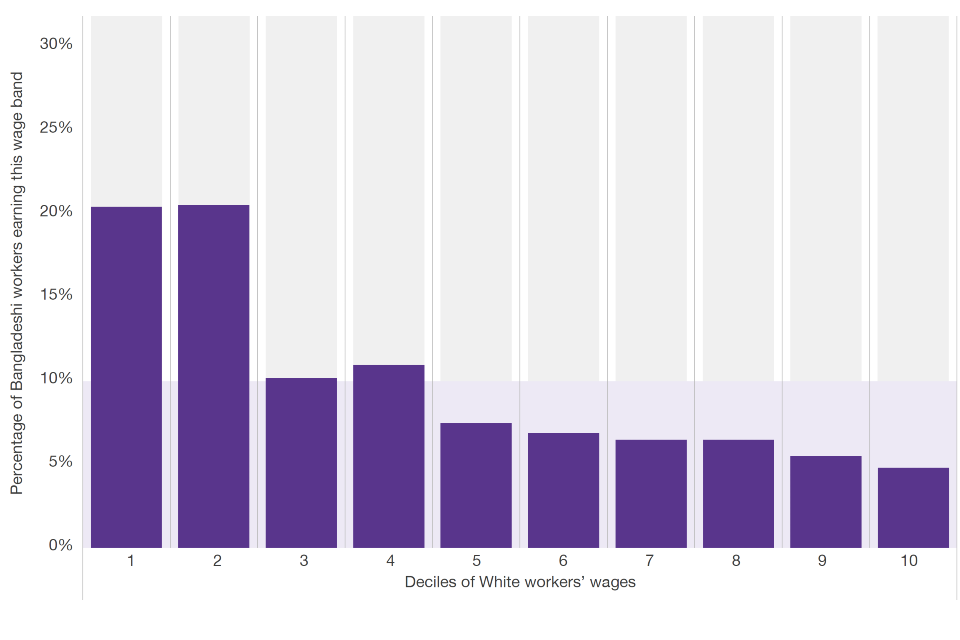
The types of jobs that ethnic minorities find themselves in impacts on wider income inequality. This is particularly stark for some ethnic groups. For instance, between 2011 and 2015, 20% of Bangladeshi individuals in work earned less than the wages of the bottom 10% of White workers. A similar picture is true for workers reporting as being from Pakistani origin, where 16% earn less than the bottom 10% of White workers. However, there have been some success stories. The income distribution for Black/African/Caribbean/Black British workers is almost comparable with that for White workers. Likewise, there are now more Indian workers who are in the top earnings decile (top 10%). Graphs 4 to 7 can be used to compare the wage distribution of BME workers with that of White workers[footnote 48].
Graph 4: Wage distribution of hourly earnings for Bangladeshi individuals, 2011 to 2015. Source: ONS Labour Force Survey, 2011 to 2015[footnote 49]
""
| Deciles of White workers wages | Wage distribution of hourly earnings for Bangladeshi individuals |
|---|---|
| 1 | 20.5% |
| 2 | 20.6% |
| 3 | 10.2% |
| 4 | 11.0% |
| 5 | 7.5% |
| 6 | 6.9% |
| 7 | 6.5% |
| 8 | 6.5% |
| 9 | 5.5% |
| 10 | 4.8% |
Graph 5: Wage distribution of hourly earnings for Pakistani individuals, 2011 to 2015. Source: ONS Labour Force Survey, 2011 to 2015[footnote 50]
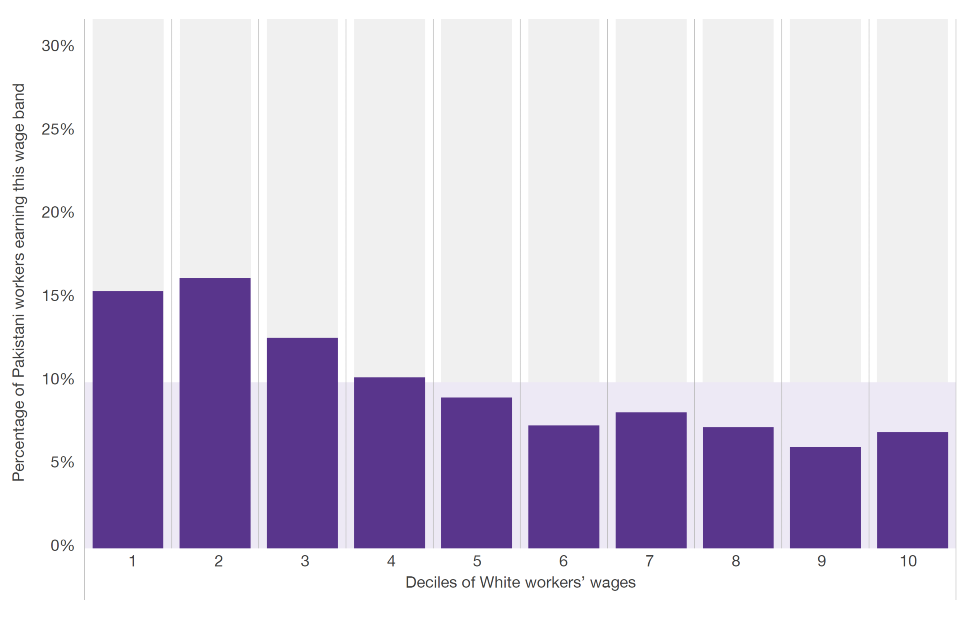
""
| Deciles of White workers wages | Wage distribution of hourly earnings for Pakistani individuals |
|---|---|
| 1 | 15.5% |
| 2 | 16.3% |
| 3 | 12.7% |
| 4 | 10.3% |
| 5 | 9.1% |
| 6 | 7.4% |
| 7 | 8.2% |
| 8 | 7.3% |
| 9 | 6.1% |
| 10 | 7.0% |
Graph 6: Wage distribution of hourly earnings for Black/African/ Caribbean/Black British individuals, 2011 to 2015. Source: ONS Labour Force Survey, 2011 to 2015[footnote 51]
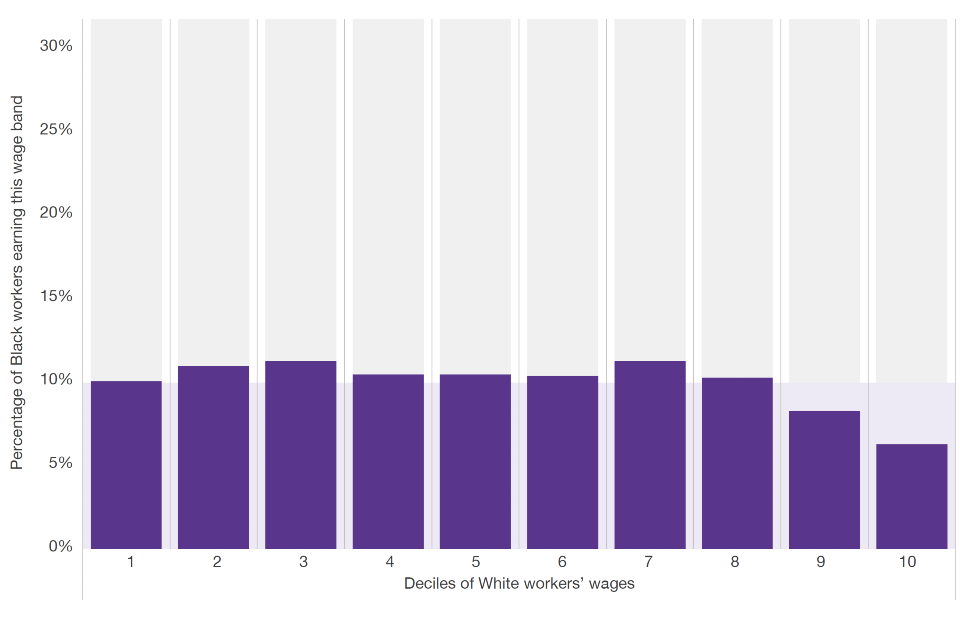
""
| Deciles of White workers wages | Wage distribution of hourly earnings for Black individuals |
|---|---|
| 1 | 10.1% |
| 2 | 11.0% |
| 3 | 11.3% |
| 4 | 10.5% |
| 5 | 10.5% |
| 6 | 10.4% |
| 7 | 11.3% |
| 8 | 10.3% |
| 9 | 8.3% |
| 10 | 6.3% |
Graph 7: Wage distribution of hourly earnings for Indian individuals, 2011 to 2015. Source: ONS Labour Force Survey, 2011 to 2015[footnote 52]
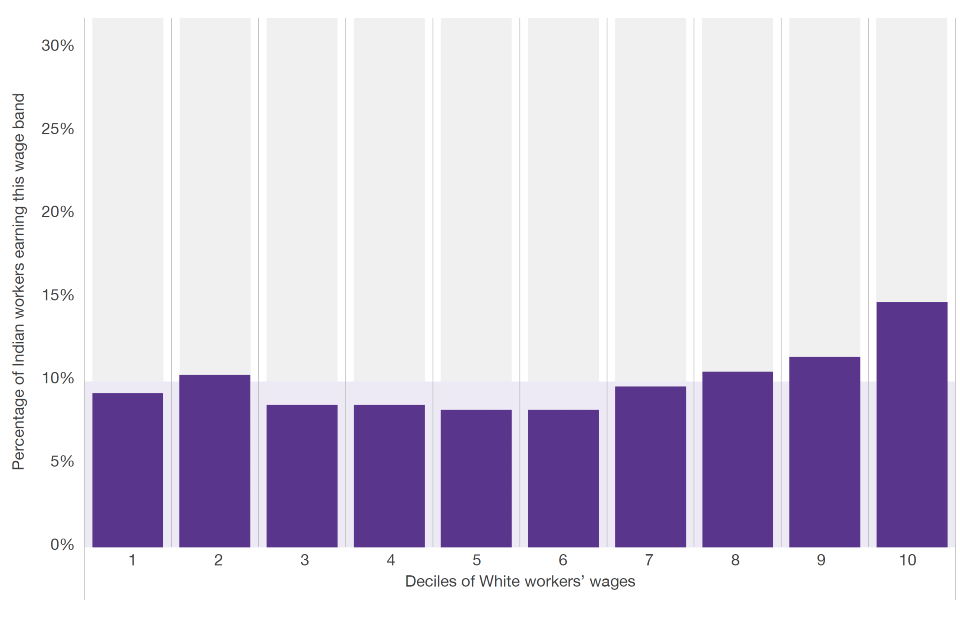
""
| Deciles of White workers wages | Wage distribution of hourly earnings for Indian individuals |
|---|---|
| 1 | 9.3% |
| 2 | 10.4% |
| 3 | 8.6% |
| 4 | 8.6% |
| 5 | 8.3% |
| 6 | 8.3% |
| 7 | 9.7% |
| 8 | 10.6% |
| 9 | 11.5% |
| 10 | 14.8% |
Less able to secure opportunities for employment which matches their skills and abilities
Graph 8: Qualification, by ethnic group, Quarter 1 2016. Source: ONS Labour Force Survey, 2016[footnote 53],[footnote 54]
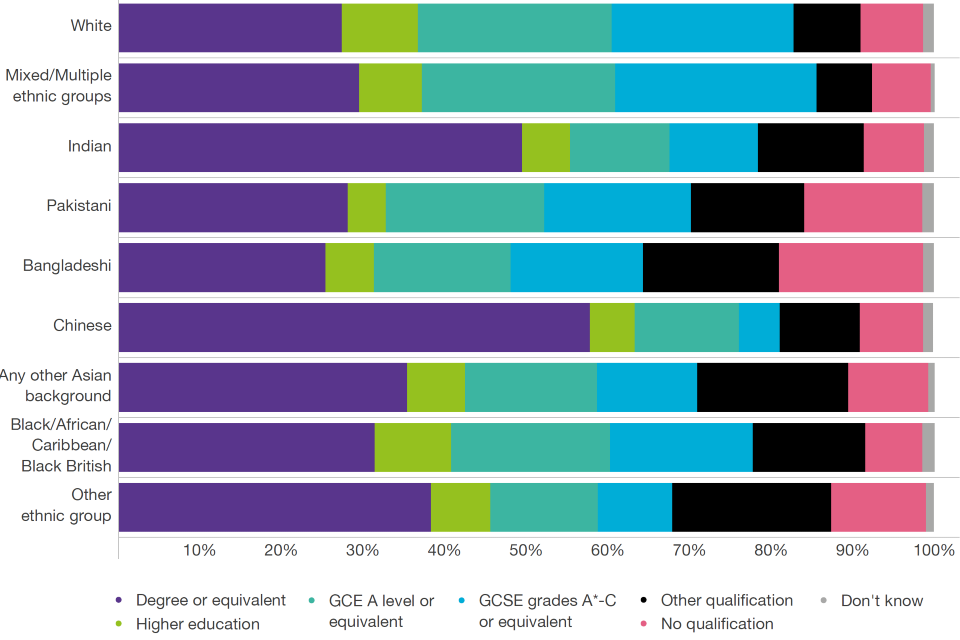
""
| Qualification by ethnic group | White | Mixed or multiple | Indian | Pakistani | Bangladeshi | Chinese | Other Asian | Black | Other |
|---|---|---|---|---|---|---|---|---|---|
| Degree or equivalent | 27.4% | 29.5% | 49.5% | 28.1% | 25.4% | 57.8% | 35.4% | 31.4% | 38.3% |
| Higher education | 9.3% | 7.7% | 5.9% | 4.7% | 5.9% | 5.5% | 7.1% | 9.4% | 7.3% |
| GCE A level or equivalent | 23.8% | 23.7% | 12.2% | 19.4% | 16.8% | 12.8% | 16.2% | 19.5% | 13.2% |
| GCSE grades A*-C or equivalent | 22.3% | 24.7% | 10.8% | 18.0% | 16.2% | 5.0% | 12.3% | 17.5% | 9.1% |
| Other qualification | 8.2% | 6.8% | 13.0% | 13.9% | 16.7% | 9.8% | 18.5% | 13.8% | 19.5% |
| No qualification | 7.7% | 7.2% | 7.4% | 14.5% | 17.7% | 7.8% | 9.8% | 7.0% | 11.6% |
| Don’t know | 1.3% | 0.5% | 1.2% | 1.4% | 1.3% | 1.2% | 0.8% | 1.5% | 1.0% |
Graph 8 illustrates the highest level of qualification of BME individuals in comparison to the White group. It is evident that BME individuals generally have educational outcomes on par with or even superior to the White group. For instance, 37% of BME individuals have obtained a degree or equivalent, as opposed to only 27% of the White group. In particular, individuals in the Chinese (58%) and Indian (50%) groups are more likely to have obtained a degree. In contrast, individuals from the Pakistani (15%) and Bangladeshi (18%) groups are much more likely to have no qualifications.
Despite these positive outcomes, there is a variety of evidence that suggests that BME individuals are more likely to be overqualified for the job that they are in. In many cases this will mean that the skills and abilities of BME individuals are not being fully utilised. JRF finds that, taken as a whole, ethnic minority groups tend to have a slightly higher educational attainment than those from White ethnic groups on average[footnote 55]. The ‘overqualification’ of ethnic minority employees in low paying jobs is widespread, with Pakistanis and Bangladeshis being most likely to be overqualified.
A further JRF study in 2015, which looked at supporting young BME individuals from education into work, found that[footnote 56]:
- all BME groups are more likely to be overqualified than White ethnic groups. The gap is widest for those with A-level qualifications
- over 40% of all Black African employees with A-level and graduate-level qualifications are overqualified for their current jobs
- BME women entering the labour market in recent times, particularly Black African and Pakistani/Bangladeshi women, are taking jobs well below their qualification level
- despite a slightly higher level of educational qualifications amongst BME individuals relative to the White population, BME individuals are less likely to attend Russell Group universities
There is a wealth of evidence suggesting that BME individuals struggle to achieve the same progression opportunities as their counterparts. Research in 2015 by Business in the Community (BITC) found that 1 in 8 of the working age population are from a BME background, yet only 1 in 10 are in the workplace and only 1 in 16 top management positions are held by an ethnic minority person[footnote 57]. As noted above, JRF found that a higher proportion of BME individuals tend to work in low paid occupations[footnote 58]. JRF notes that progression from these low paid, low skilled positions is as challenging for some BME groups as it is getting into employment in the first place.
BITC’s Gender and Race Benchmark looked at trends in performance and appraisal and found that[footnote 59]:
- BME employees are less likely to be rated in the top 2 performance rating categories (27% compared with 35% of White employees)
- BME employees are less likely to be identified as ‘high potential’ (10% compared with 20% of White employees)
- the public sector is less likely to identify BME as ‘high potential’ in similar proportions as White employees
- there is an issue with talent programmes, in that the future leadership pipeline within the private sector is imbalanced when analysed by race
- appraisal mechanisms feeding into leadership are more likely to rate BME employees less favourably;
- white employees are more likely to be promoted overall compared with all other groups
- BME women are more likely to be promoted than BME men (BME women overall promotion rate is 7.3% compared with 6.4% for BME men)
- in terms of opportunities for progression 35% of Pakistani, 33% of Indian and 29% of Black Caribbean employees report feeling that they have been overlooked for promotion[footnote 60]
Graph 9: Percentage of employees reporting that they have been overlooked for promotion by ethnic group[footnote 61]. Source: Business in the Community, 2015[footnote 62]
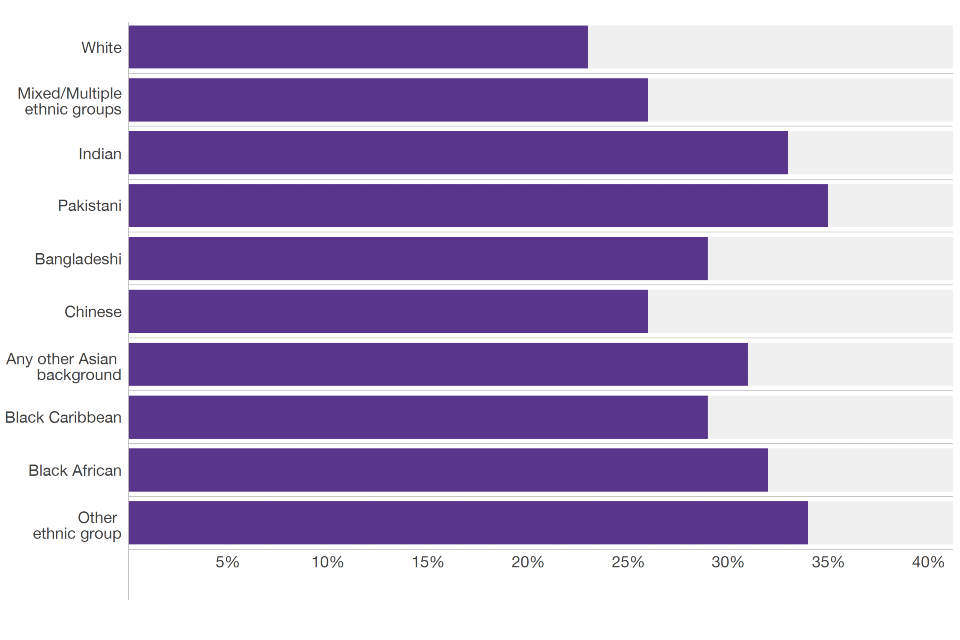
""
| Ethnic group | % of employees reporting that they have been overlooked for promotion |
|---|---|
| White | 23% |
| Chinese | 26% |
| Mixed | 26% |
| Bangladeshi | 29% |
| Black Caribbean | 29% |
| Other Asian | 31% |
| Black African | 32% |
| Indian | 33% |
| Other Asian | 34% |
| Pakistani | 35% |
According to JRF, BME groups also tend to have unequal access to opportunities for development, often because of a lack of clear information on training opportunities or progression routes within their workplaces[footnote 63]. This can be made worse if progression relies on opaque or informal processes, if there is a lack of BME role models or mentors at higher levels within their workplaces to provide support and advice, or if there is a gap between equality and diversity policies and practice in the workplace.
Underrepresentation of BME at the top
In addition to the evidence that BME individuals struggle to achieve the same progression opportunities as their White counterparts, there is evidence that BME individuals are underrepresented at managerial and senior positions in business.
BITC reports that there has been virtually no ethnicity change in top management positions in the 5 years between 2007 and 2012, and, in fact, the gap at management level widened during that period[footnote 64]. Again, it is important that ethnic groups are considered separately, because there are significant differences in success rates and sector representation between ethnic groups. The Black and Black British group did particularly poorly over the period between 2007 and 2012, with the number of Black/Black British people in top management positions decreasing by 42%.
BITC also found that a number of UK sectors appear to be closed off to BME people when it comes to leadership opportunities, with almost three-quarters (74%) of management positions held by BME individuals clustered in 3 sectors: banking and finance; distribution, hotels and restaurants; and public administration, education and health. The banking and finance sector appears to perform better than some other sectors, with the number of managers from all but one ethnic group increasing between 2007 and 2012. The majority of management positions within the energy and water, construction, legal, media and political sectors were held by White people.
The number of BME managers in the ‘other services’ sector has had the second fastest growth rate, of 51%, between 2007 and 2012. ‘Other services’ covers activities of membership organisation, repair of computers and personal household goods, and personal service activities such as dry-cleaning, hairdressing and beauty treatments. BITC suggests that this could indicate a preference by BME individuals to start their own business rather than find employment in the more traditional industries. Whether this is by choice or necessity is an interesting question. On a positive note, BITC reports that 10% of BME employees are on the first rung of the promotion ladder, which is proportionate to the 10% of BME people in employment at the time of the BITC report.
With regard to the public sector, 11% of civil servants in government agencies are BME individuals[footnote 65]. However, at a senior level this number decreases to 7%. 6% of MPs and members of the House of Lords have an ethnic minority background, which means that the 14% of the population who are BME individuals are currently being underrepresented. In the health sector, 18% of NHS staff and 41% of doctors come from an ethnic minority background. However, the General Medical Council reports that White UK medical graduates are more likely than BME graduates to pass specialty exams, and that the chances of passing are particularly low if a primary qualification was gained outside the UK or EEA[footnote 66].
Green Park’s annual survey of Britain’s 10,000 top business leaders, reports that there has been a decline in BME presence in the pipeline Top 100 leaders, which it defines as the most senior leaders including all reports to main board directors[footnote 67]. Its analysis finds that the equivalent of nearly 40 non-White leaders has been lost in the 12 months preceding the survey. On a somewhat positive note, Green Park found that there were 3 non-White Chairs of FTSE 100 companies in spring 2015, up from 2 in 2012.
Research by Third Sector also finds that, amongst leadership of the top 50 UK fundraising charities, just 12% of chief executives, 6% of senior managers and 8% of trustees are non-White[footnote 68]. These proportions fall short relative to the overall proportion of non-White people living in the UK. Furthermore, 19 of the 50 top charities surveyed have no non-White people on their top teams or trustee boards.
Pipeline of talented and skilled Black and Minority Ethnic individuals
BME individuals are more likely to participate in higher education than White British individuals[footnote 69]. However, evidence indicates that this does not translate into equal outcomes in terms of both degree attainment and employment after graduation[footnote 70],[footnote 71]. Similarly, figures suggest that there remains an employment gap for those with vocational qualifications and for those who have completed apprenticeships[footnote 72].
Higher education
Examining the performance of different ethnicities in the UK’s higher education system is one way to better understand the pipeline of skilled individuals from different ethnic backgrounds who are entering the labour market. There is a very good story to tell on the relative progression of BME groups to higher education in England and the higher representation of BME groups in English higher education institutions relative to their share of the population. However, issues remain around the retention, attainment and progression from higher education for some BME groups.
Research by the Institute for Fiscal Studies confirms that BME groups are more likely to participate in higher education than the White British category, including to the most selective institutions once you control for background characteristics and prior attainment[footnote 73]. All BME groups are at least 10 percentage points more likely to participate in higher education than White British individuals once background characteristics and prior attainment are taken into account.
UCAS has also found that there is no systematic bias in the offers made by selective institutions to students from different ethnic backgrounds, once you take into account that BME students tend to have higher aspirations and are more likely to apply to more competitive courses with comparatively lower predicted grades than their White peers[footnote 74]. Table 1 is based on UCAS data and shows that the entry rates to higher education are higher for every ethnic minority group than that for the White group and that entry rates for ethnic minority groups are growing more quickly than for the White group[footnote 75].
Table 1: UCAS entry rates for BME groups – English domiciled 18 year olds from state schools. Source: UCAS, 2016[footnote 76]
| Ethnic group | 2006 | 2007 | 2008 | 2009 | 2010 | 2011 | 2012 | 2013 | 2014 | 2015 |
|---|---|---|---|---|---|---|---|---|---|---|
| White | 21.7% | 22.2% | 23.4% | 24.0% | 24.2% | 25.7% | 24.6% | 26.1% | 27.2% | 27.8% |
| Mixed | 22.7% | 24.2% | 24.8% | 25.5% | 25.3% | 28.7% | 27.6% | 29.0% | 30.6% | 31.8% |
| Chinese | 50.8% | 50.7% | 50.0% | 50.4% | 49.6% | 57.3% | 54.1% | 54.5% | 56.1% | 57.6% |
| Black | 20.9% | 22.5% | 24.9% | 26.0% | 27.2% | 30.4% | 30.1% | 33.4% | 34.3% | 36.7% |
| Asian | 33.9% | 34.0% | 35.1% | 35.6% | 34.2% | 36.3% | 35.3% | 37.9% | 38.7% | 41.0% |
| Any other ethnic group | 26.4% | 26.8% | 27.5% | 27.4% | 27.2% | 29.7% | 30.1% | 31.2% | 33.3% | 35.8% |
Despite the positive story around gaining entry to higher education, there is a more concerning picture on how BME individuals progress through the higher education system. The Department for Business, Innovation and Skills’ national strategy for access and success for disadvantaged students in higher education indicated that outcomes for some BME students fall below what might be expected given their prior attainment[footnote 77]. Despite currently participating in higher education at higher rates than the White group, BME students achieve consistently lower degree outcomes than those from White backgrounds entering with the same A-level grades.
Higher Education Funding Council for England (HEFCE) data shows that non-continuation rates for Black Caribbean first degree entrants are the highest of all ethnic groups at 12.5% of 2012 to 2013 entrants, compared with 6.5% of White entrants. There are also differences in degree attainment and progression to employment and further study which particularly affect Black students[footnote 78]. This is true across a range of outcomes, such as completing the degree, gaining a first or upper second degree classification, and progressing to highly skilled employment or further study. HEFCE data on degree outcomes shows that a higher proportion of White graduates achieved a first or upper class degree in 2013 to 2014 (76%) compared with their BME counterparts (60%)[footnote 79].
HEFCE data on employment outcomes indicates that there are significant differences in professional employment rates amongst ethnic groups[footnote 80]; with Black Caribbean qualifiers having the lowest rate of professional employment 6 months after graduation, at 55.4%, which is 9.3 percentage points lower than the highest rate of 64.7% for White qualifiers[footnote 81]. At 40 months after graduation, it is Black African qualifiers who have the lowest rates of professional employment, at 65.9%, while Asian Indian and White qualifiers have the highest rates at 79.1% and 78.7% respectively. BITC’s Gender and Race Benchmark[footnote 82] supports these results and found a significant drop-off in the proportion of BME graduates (and apprentices) progressing from application to hire stages of recruitment, while White candidates tend to progress from application to hire in similar proportions.
Moreover, a study by the Institute for Social and Economic Research at the University of Essex also concludes that 6 months after graduation, BME university graduates are much less likely to be employed than White British graduates. Pakistani and Bangladeshi groups face the largest employment gap, being about 10% to 15% less likely to be employed[footnote 83]. The authors find that this can mainly be attributed to a lack of social capital and networks through family or the local community, while university quality has relatively little impact on employment outcomes.
In addition to difference in employment rates, there is also a difference in wages, as the Trade Union Congress (TUC) reports[footnote 84]. On average, Black workers with degrees earn 23.1% less than their White counterparts, while all BME workers earn 10.3% less. This seems to support the theory that BME individuals struggle to find work that matches their qualifications and to progress within the workplace. In another study, the TUC also finds that BAME individuals with degrees are 2.5 times more likely to be unemployed than White graduates[footnote 85].
Further education and apprenticeships
The TUC reports that there exists a severe unemployment gap for those with vocational qualifications: the unemployment rate of BME workers who have obtained HNC/HND (Higher National Certificates/Higher National Diplomas) and BTEC (Business and Technology Education Council) qualifications compared with White workers is over 5.5 percentage points[footnote 86]. Similarly, the unemployment gap with regard to skills-based qualifications through training is 5.5 percentage points, while in apprenticeships the employment gap is 23.0 percentage points.
Inter-generational differences within Black and Minority Ethnic groups and social networks
Evidence has found that BME groups experience significantly lower upward social mobility rates compared with their White counterparts[footnote 87]. Additionally, research suggests this varies significantly by ethnic group and gender[footnote 88].
Inter-generational differences
We have highlighted that labour market outcomes for BME individuals vary significantly, not just by ethnicity but by other characteristics, including age and gender. There is also evidence that shows inter-generational differences in outcomes.
Examining social mobility, which can be defined as the movement of individuals/families within or between social classes in a society, is one way of considering the issue of inter-generational performance of BME individuals or groups. As an example, Li and Heath, who undertook one of Britain’s largest longitudinal studies of class and ethnicity in Britain between 1982 and 2011, found that first generation Black African, Indian and Pakistani and Bangladeshi groups had significantly lower upward mobility rates than their White counterparts[footnote 89]. 43% of White men and 46% of White women had moved up to a higher socioeconomic class than their father, but just 34% of first generation Pakistani and Bangladeshi men and 28% of Pakistani and Bangladeshi women moved up from the socio-economic class of their father.
The researchers highlight that social mobility also differs by gender, for example second generation south-Asian men have benefited more from upward occupational mobility than women. Interestingly, amongst second generation Black Caribbean and Chinese groups, Black Caribbean men (40%) and Chinese women (47%) experience lower rates of upward mobility than Black Caribbean women (67%) or Chinese men (57%). A study by Longhi, Nicoletti and Platt reports that second generation Indian Muslim, Indian Hindu and Indian Pakistani men generally earn higher wages than the first generation[footnote 90]. However, the amount that can be explained by workers’ individual characteristics (rather than discrimination) does not necessarily increase with generations.
In contrast, research by Heath and Li using data from 1972 to 2005 shows that for Black African, Black Caribbean and Pakistani and Bangladeshi migrants and their descendants, severe ethnic penalties continue to persist[footnote 91]. However, White Irish, White Other and Chinese groups experience no such ethnic penalties. According to this research, for the 3 main disadvantaged groups, no sign at all of improvement through time could be found.
The importance of social networks features prominently
The Organisation for Economic Co-operation and Development (OECD) describes social networks as ‘the links, shared values and understandings in society that enable individuals and groups to trust each other and so work together’[footnote 92]. The literature includes many references to the importance of social networks. According to JRF[footnote 93], strong social networks are a form of social capital, and in this way they place a value on social networks. There is also some evidence to suggest that neighbourhood concentration of own ethnic group is associated with higher life satisfaction[footnote 94].
Another JRF study highlights that having a mixed ethnic friendship network and having friends who are employed reduce the probability of living in poverty – about two-thirds of people in the UK have friends from mixed ethnic groups[footnote 95]. However, these factors do not have as strong an influence as other factors, such as level of qualification. The benefit of a mixed ethnicity social network is felt mostly by ethnic groups with the lowest level of poverty. In addition, the number of close friends may also be an even stronger predictor of poverty status.
The social networks of employers may also influence the careers of BME groups through a process of ‘homosocial reproduction’. This concept was first introduced by Kanter in 1977 to understand the lack of career success of women, but has been applied to BME groups, and is understood as employers wishing to select employees who are similar to themselves[footnote 96],[footnote 97]. This means that predominantly White European executive and managerial groups would ‘reproduce’ themselves by appointing White Europeans.
A 2011 study by the OECD identified that a lack of effective jobsearch networks can make accessing employment difficult, given that it is very often about knowing the right people[footnote 98]. However, some ethnic social networks can be limiting – and can result in young people getting jobs in a limited set of sectors in which their social group is already working.
Other evidence confirms the importance of social networks and ethnic communities within the UK labour market. Research found that the higher the percentage of a given ethnic group living nearby, the higher the employment rate of that ethnic group[footnote 99]. However, this effect rapidly diminishes with distance and disappears completely at about 90 minutes’ travel time.
What is the business case for change?
There is a variety of literature covering the imperatives for businesses to take action, including widening the talent pool, growing the customer base and increasing innovation. Analysis suggests that the potential benefit to the UK economy from full representation of BME individuals across the labour market through improved participation and progression is estimated to be £24 billion per annum, which represents 1.3% of GDP[footnote 100]. Despite these potential benefits, only 57% of organisations have a race champion at board level or equivalent[footnote 101].
What is the potential value of action?
BME individuals are both less likely to participate in the labour market and less likely to progress through the labour market when compared to White individuals. Across the workforce this means there are significant wasted resources, as BME individuals are not obtaining employment that matches their skills and abilities. The reasons behind this are wide ranging and complex, from differences in professional networks and aspirations to discrimination. Fully utilising the skills and potential of BME individuals would deliver large economic benefits to the UK.
The need for a business case
JRF emphasises the need for greater recognition of the business case for maximising the untapped talent of ethnic minority groups[footnote 102]. BITC’s Gender and Race Benchmark found that 87% of benchmarking organisations have a business case for diversity and inclusion, but fewer (60%) have a specific business case for ethnicity[footnote 103]. In terms of leadership and accountability, employers are more likely to make senior leaders accountable for delivering gender diversity, equality and inclusion strategies than for ethnicity strategies. Only 57% of organisations have a race champion at board or equivalent level, yet 67% have a race champion at senior manager or HR professional level.
The Runnymede Trust notes that the business case for greater ethnic diversity should not focus on the ethical value of diversity and inclusion, nor be simply ‘the right thing to do’, but rather should be linked to business outcomes such as profitability, productivity or legal compliance[footnote 104]. In this way, equality and diversity promoters are more likely to get the issue onto boardroom agendas. Added to this, research by BIS on the Business Case for Equality and Diversity suggests that the case for change will vary for individual businesses, depending on the economic and organisational context within which it is operating[footnote 105].
What is the business case for change?
From the literature, some of the key business and economic performance-based arguments for improving BME representation throughout the workforce include:
Widening the talent pool:
BME individuals are the future UK workforce, making up 14% of the working age population[footnote 106]. 1 in 4 primary school pupils has a minority ethnic background.
If a business does not encourage BME professionals entering the organisation or progressing, then their talent pool will get smaller over time, minimising their prospects of getting the best people for a given job. This is particularly important in the context of skills shortages in certain areas and increasing demand for individuals with backgrounds in areas such as science, technology and maths.
Retaining and growing the customer base:
The Runnymede Trust reports that BME representation at all levels within a business can lead to a better understanding of customer needs and greater insight into untapped markets[footnote 107]. This might be, for example, through improved market strategies or new products and services aimed at the particular demands of diverse communities.
For example, the Institute for Employment Studies’ Perspectives on HR report says that directors from diverse backgrounds are likely to operate in different networks, engage with a wider pool of stakeholders, and have understandings of different markets[footnote 108]. A combination of these factors is likely to open up a wider range of markets than for those businesses whose board members have similar experiences and thus operate within similar networks and markets. The Runnymede Trust suggests that some sectors, such as retail, benefit from having customer-facing staff that reflects their potential customers.
Reputation:
Strong equal opportunities policies to improve diversity can make an employer more attractive to potential employees[footnote 109]. Conversely, negative publicity with regard to diversity and inclusion can damage a business; Improved morale, leading to increased productivity, improved retention rates and lower recruitment costs: In a paper on the business case for equality and diversity[footnote 110], BIS report that a lack of equality policies can lead to greater staff turnover rates, with an associated loss of talent, as well as potential employment tribunals and associated bad press.
Innovation:
It has been suggested that increased diversity can improve innovation as a result of broader experience leading to a wider variety of ideas, and that diversity can improve problem solving as a result of increased challenge[footnote 111].
Evidence on the relationship between ethnic diversity and business performance
An academic study by Tatli and Özbilgin, based on survey evidence from 285 diversity and equality officers in the UK, draws together the benefits of ethnic diversity[footnote 112]. The survey found that 64% of respondents considered diversity to be important for recruiting and retaining talent, 48% to improve business performance, 43% to improve customer relations, 43% to improve creativity and innovation, 35% to enhance decision making and 32% to respond to competition in the market. An extensive study on the effect of diversity on business outcomes was conducted by McKinsey and Company in 2015; they found that[footnote 113]:
*companies in the top quartile for ethnic diversity are 35% more likely to have financial returns above their respective national industry medians * companies in the bottom quartile for both gender and ethnicity are statistically less likely to achieve above-average financial returns than the average companies in the dataset * unequal business performance within the same industry and country implies that diversity is a competitive differentiator, which is shifting market share toward more diverse companies over time * while correlation does not equal causation (greater gender and ethnic diversity in corporate leadership does not automatically translate into more profit), the correlation does indicate that when companies commit themselves to diverse leadership, they tend to be more successful
As demonstrated above, evidence exists supporting the link between an ethnically diverse workforce, including senior management teams, and better business performance. McKinsey provides a detailed summary of a large body of additional evidence supporting this link[footnote 114]. Some of the key pieces of evidence used by McKinsey include the study by Erhardt et al. who found that diversity at executive board or director level (measured by both ethnicity and gender) is positively correlated with return on investment and return on assets[footnote 115]. This was also backed up by research by Carter et al. who found that organisations with 2 or more ethnic minority board members performed better than those that had none[footnote 116]. Similarly, Herring reported that both gender and race diversity in the workforce were associated with increased sales revenue, more customers, greater market share, and greater relative profits in a sample of for-profit businesses[footnote 117].
McKinsey is careful to point out that the findings of different studies vary, with some finding that diversity has a positive impact, and some pointing to a negative impact. McKinsey concludes that this demonstrates the complexity of the relationship between ethnic diversity and organisational performance. One of the studies it cites found that diversity amongst top management figures and business performance were related in a ‘U-shaped curve’, where productivity fell as racial diversity increased up to a point of around 25% of racial diversity, after which it began to increase[footnote 118]. This suggests that there might be some kind of ‘bedding’ period for increased diversity, where an initial increase in diversity reduces the performance, for instance through increased conflict or poorer communication, but as diversity becomes more normalised and incorporated into top-level management, the benefits of more diverse points of view and greater access to networks result in better performance.
Identifying the obstacles faced by Black and Minority Ethnic people in the labour market
There are a range of barriers identified in the literature which limit both participation and progression of BME individuals in the labour market. These broadly cover aspirations, skills and language skills, geography and geographical mobility, social capital and networks, cultural preferences and discrimination. The relative impact of each of these obstacles varies by ethnic group.
What are the barriers faced by BME individuals in work?
There are a number of studies that point out the barriers that BME individuals face in the labour market[footnote 119],[footnote 120],[footnote 121],[footnote 122]. These factors range from availability of social and financial capital to cultural influences and experiences with discrimination. The main barriers cited in the literature include:
- individual expectations and aspirations
- human capital such as training, education and skills relevant to job performance
- lack of language skills
- geography (many ethnic minorities live in areas with high unemployment and lack of mobility)
- financial capital for setting up a business
- social capital such as social relations and network
- lack of access to professions and integration policies
- cultural preferences and other cultural barriers
- direct discrimination (positive or negative) by employers, banks or co-workers
- indirect discrimination
Aspirations
A number of studies indicate that BME individuals are as ambitious as, if not more so, than their White counterparts. These studies found that minority ethnic students were more likely to aspire to conventional, social, and enterprising careers than majority ethnic peers, showing that preferences for different types of careers can vary by ethnicity[footnote 123],[footnote 124]. However, Abrahmasen and Drange found that Asian students had lower expectations of attaining a management position than European students[footnote 125]. In this context, the evidence on poorer career progression and performance by BME individuals is concerning. As noted previously JRF, reported unequal access to opportunities for development for BME groups[footnote 126]. Studies also suggest that where there is a lack of aspiration, this is often linked to lack of BME role models or mentors to provide a positive example and influence the goals of young people.
People tend to use role models who ‘match’ themselves in terms of ethnicity, and role models can be a source of self-efficacy, performance standards and inspiration by demonstrating their possible future selves[footnote 127],[footnote 128]. This means that a lack of visible BME role models could negatively influence career aspirations and outcomes.
In addition to role models, stereotypes may influence aspirations, especially if there is a negative stereotype around academic achievement. Negative stereotypes can affect aspirations through ‘stereotype threat’, in which a negative stereotype negatively affects performance or attitudes as people are concerned about fulfilling the stereotype. For instance, a study by Woodcock et al. found an influence of stereotype threat on aspirations of BME individuals, in that being exposed to a negative stereotype around academic achievement throughout scientific training was related to lower intentions to pursue a scientific career[footnote 129]. In addition, Aronson and Inzlicht found that African-American students who are more vulnerable to stereotypes are more likely to underestimate how well they do academically[footnote 130].
BITC reports a high level of interest amongst BME groups in taking part in management fast track programmes[footnote 131]. However, whilst interest in fast track programmes is significantly higher amongst BME employees, at 40% compared with 18% of White employees this higher interest is not reflected in greater access to fast track management programmes for all ethnic minority groups.
BITC also reports that BME employees appear to show more ambition than those from a White background with 64% of BME employees agreeing that it is important that they progress compared with 41% of White employees. Ambition to progress in their careers is particularly high for employees from a Black background (72%), followed by Asian (63%) and mixed race (61%) ethnic minority groups. Furthermore, BME employees are less likely to report that their current job makes good use of their skills and abilities (54% compared with 57% of White employees). Half or more of Black African (50%), Black Caribbean (52%), Pakistani (58%) and Chinese (52%) employees do not believe that their skills are put to good use, with 43% of Bangladeshi employees in agreement with this statement.
What part does discrimination play?
The Runnymede Trust draws attention to the issue of how prejudice, discrimination and exclusionary practices in the workplace can limit people’s professional opportunities and the contribution they make to their organisation[footnote 132]. They bring together a number of studies focusing on discrimination:
- in 2007, the business-led National Employment Panel reported that at least 25% of the ‘ethnic minority employment gap’ (the difference between how many BME people are employed compared with the general population) is caused by discrimination in employment practices[footnote 133]
- one-third of Asian and 20% of Black managers surveyed by Hooker et al. said that racial discrimination had been a barrier to succession[footnote 134]
- subjected to CV testing, private sector employers showed a discrimination rate of 35% compared with 4% for the public sector[footnote 135]
- ethnic minorities, particularly first generation individuals, often face a linguistic penalty in job interviews; this is not due to bad command of English, but rather the fact that there are hidden demands to talk in institutionally credible ways and there is often a mismatch of cultural expectations[footnote 136] • ethnic minorities are themselves aware of unconscious bias against them, which constrains their job search[footnote 137]
Based on this evidence, the Runnymede Trust draws out 3 basic conclusions:
- everyone has biases and prejudices which influences their behaviour, whether consciously or unconsciously, and this behaviour impacts on day-to-day business
- both formal and informal practices exist in workplaces which have the effect of unfairly disadvantaging people, some of which stem from racism, bias and prejudice
- where people perceive that they are being discriminated against, or unfairly excluded from participation and recognition, this should be taken seriously as an issue
BITC identified widespread self-reporting of racial harassment and bullying in the workplace[footnote 138]. As Graph 10 shows, over a quarter (28%) of all BME employees reported witnessing or experiencing racial harassment or bullying from managers in the last 5 years. 1 in 5 White employees (17%) reported the same. Similar proportions of employees from a mixed race (25%), Asian (29%) or Black (30%) background reported experiencing or witnessing racial harassment or bullying from managers in the last 5 years. Furthermore, 32% of BME employees have witnessed or experienced racial harassment or bullying from colleagues in the last 5 years, with the proportion rising to around 2 in 5 for those from a Pakistani or Other Asian background.
The NHS reports that a much higher percentage of staff from BME backgrounds have experienced harassment, bullying or abuse as well as discrimination from managers or colleagues[footnote 139]. BME employees are also much less likely to believe that they have equal opportunities for progression within the NHS.
Research by Heath and Li found that that all ethnic minority groups except for Chinese and other Whites report substantially higher job refusal rates than White people[footnote 140]. In the case of Black African, Black Caribbean and Pakistani and Bangladeshi groups, they were 20% higher. Refusals were also much higher for Muslims than for other religious groups. The authors estimate that while discrimination, using a proxy of job refusals, does not play a large role in explaining the employment gap for the Pakistani and Bangladeshi group, it explains 12% of the gap for Black Caribbean men and 25% for Black African men.
BIS research highlights that a potential source of discrimination might be that employers overestimate the cost of hiring a worker from a different minority group[footnote 141]. Within this economic framework of discrimination, the case for diversity can be made if there are business benefits from diversity that outweigh both the perceived cost, and the benefits associated with hiring a majority group worker.
Research from the Resolution Foundation suggests that government should work with employers to end ethnicity related discrimination, and to ensure that employment and skills services work effectively for BME groups[footnote 142]. Given that BME participation appears to be the least responsive to improving labour market conditions, the report finds that BME groups have a greater need for policy intervention to achieve good labour market outcomes.
Graph 10: Proportion of employees who have personally experienced harassment or bullying from their manager or colleagues in the last 5 years, by ethnic group. Source: Business in the Community, 2015[footnote 143]
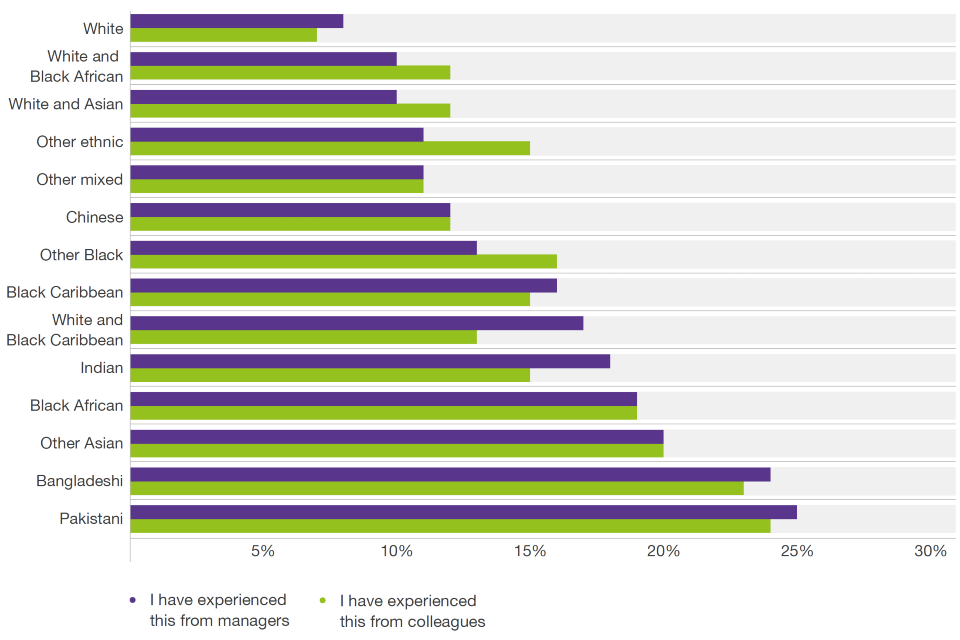
""
| Ethnic group | I have experienced this from managers in the last 5 years (%) | I have experienced this from colleagues in the last 5 years (%) |
|---|---|---|
| White | 8% | 7% |
| White and Black African | 10% | 12% |
| White and Asian | 10% | 12% |
| Other ethnic | 11% | 15% |
| Other mixed | 11% | 11% |
| Chinese | 12% | 12% |
| Other Black | 13% | 16% |
| Black Caribbean | 16% | 15% |
| White and Black Caribbean | 17% | 13% |
| Indian | 18% | 15% |
| Black African | 19% | 19% |
| Other Asian | 20% | 20% |
| Bangladeshi | 24% | 23% |
| Pakistani | 25% | 24% |
International comparisons
There is limited research on international comparisons of BME performance in the labour market. It is difficult to make comparisons due to the wide variation in how countries conceptualise, define and measure ethnicity. The existing evidence which compares the UK and US concludes that in both countries there are significant differences in the earnings of BME males and that BME individuals are disadvantaged in accessing professional and managerial positions[footnote 144],[footnote 145].
International comparisons of ethnicity are difficult to produce, not least because of the wide variations in how countries conceptualise, define and measure ethnicity. Different countries measure some or all of: race, ancestry, ethnicity, migrant status and country of birth. In almost all countries that do collect official statistics on ethnicity, the answers are based on an individual’s self-definition and their response will depend on the specific socio-cultural context in which they are responding.
Countries that do collect data on ethnicity are liable to use breakdowns that reflect the patterns of migration and population change in those specific countries and this further complicates international comparisons. For example, many countries will collect data on aboriginal or indigenous populations that will differ from country to country. In addition the individual ethnicity breakdowns will reflect the largest ethnic minority groups within that country that are usually as a result of historical migration patterns. For example, the UK generally breaks down the Asian ethnicity category into Bangladeshi, Pakistani and Indian – reflecting their status as some of the largest ethnic groups in the UK. This is in contrast to other countries in Europe and elsewhere that do not have significant numbers of individuals from those ethnic groups.
In many countries, for example Germany and Italy, most data and analysis focuses on whether residents are born in that country or abroad, rather than ethnicity itself. Notably, France has legislation that prevents it collecting statistics that define citizens by ethnicity or race. The UK is one of only a few countries that has official statistics on the labour market for different ethnicities.
Nevertheless, there exist some studies of comparisons between the UK labour market and others. A study by Li compares earnings of BME individuals in the UK and the US between 1990 and 2000[footnote 146]. In both countries, minority ethnic men earned significantly less than White women. While women generally had a poorer socio-economic position than men, there were no significant differences in earnings between minority ethnic and White women. A further study confirmed that in both the US and the UK BME individuals are severely disadvantaged both with regard to employment and access to professional-managerial positions[footnote 147]. While signs of improvement over time are apparent, persistent inequalities are the defining feature of both countries.
Studies also confirm that ethnic minority disadvantage in the labour market exists in many major economies. In Belgium, a study showed that parents’ socio-economic positions have a significant impact on the social capital of their children[footnote 148]. Labour market entrants whose family members have had access to higher education or are employed have a much higher chance of successful labour market entry. Ethnic minorities, notably Turks, Moroccans and those from the Balkans, have much less access to job-finding resources through their family, which negatively impacts their probability of successful labour market entry.
Highlighting and promoting best practice – academic research and evidence on what works
There is limited academic evidence on what employer practices and policies work best in improving progression of BME individuals at work. A number of studies both internationally and in the UK have found that job applications using a name associated with a minority ethnic group are less likely to be successful in getting to the sift stage of recruitment, suggesting that name-blind recruitment could improve the recruitment process[footnote 149],[footnote 150],[footnote 151]. Evidence also suggests that a lack of positive role models may act to discourage BME individuals from progressing at work[footnote 152].
Further examples of what employers can do and best practice are explored in the Call for Evidence and Roundtable discussions as part of this review.
Name-blind recruitment
A number of recent studies suggest that BME applicants perform better in the sift stage of an application process where name-blind recruitment practices are used. Research by Oreopoulos sent thousands of randomly manipulated resumes in response to online job postings in Toronto[footnote 153]. The study found substantial discrimination across a variety of occupations towards applicants with foreign experience or those with Indian, Pakistani, Chinese and Greek names compared with English names. Listing language fluency, multinational firm experience, education from highly selective schools or active extracurricular activities had no diminishing effect. Whilst recruiters justify this behaviour based on language skill concerns, they fail to fully account for these offsetting features when listed. A similar experiment conducted by Bertrand and Mullainathan in the US confirmed these results[footnote 154]. They sent approximately 5,000 CVs in response to employment advertisements in sales, administrative support, clerical and customer services roles. Their study found that resumes with ‘White sounding names’ receive 50% more call-backs for interview, and that higher quality CVs increase call-backs by 30%, an increase that is much smaller than for African Americans.
A study by the Department for Work and Pensions in the UK resulted in similar conclusions[footnote 155]. This involved sending applications to almost 1,000 advertised job vacancies. The researchers sent practically identical applications out towards different vacancies, with 2 out of 3 containing names typically associated with a certain ethnic group. Eleven percent of the applications with a White sounding name received a positive response, compared with only 6% of ethnic minority applicants. In other words, 74% more applications needed to be sent from ethnic minority applicants in order to generate the same success rate.
Diverse interview panels
Given the increasing recognition of the impact of unconscious bias, diversity in interview panels might be one way of ensuring that BME individuals are not unfairly disadvantaged. BITC’s Gender and Race Benchmark survey of over 100 organisations found that the number of organisations ensuring ethnically diverse interview panels (where possible) has nearly doubled in 3 years (2012 to 2014), but this still represents fewer than 50% of organisations[footnote 156].
Equality and diversity management systems
HR practices were also the focus of Armstrong et al., who found that organisations with high performance work systems (generous HR practices and policies) and equality and diversity management systems benefited from higher labour productivity, lower voluntary turnover and increased rates of innovation[footnote 157]. The benefits were greater when there were equality and diversity management systems in place in conjunction with high performance work systems, which again supports the argument for embedding equality and diversity into organisations in order to benefit from it.
Role models and mentoring
A study by the Institute of Education found that a lack of positive role models discourages minority ethnic graduates from successfully securing graduate employment[footnote 158]. Black and other minority individuals in senior managerial positions are often missing in large organisations. In addition, there is also a lack of role models in senior positions at work within individuals’ ethnic communities or families. The Institute recommends positive marketing and branding, pre-university access work in schools to instil confidence and specifically aiming recruitment efforts at minority students as helpful measures in this context.
BITC’s research found that role models were particularly important to Black British employees[footnote 159]. Further research by BITC found that there was a lack of role models at work particularly for Black Caribbean and other Black Group employees[footnote 160]. When asked whether role models should be from the same background as themselves, employees had a mixed response with approximately one-third agreeing, one-third disagreeing and one-third neither agreeing nor disagreeing. Black African and Asian employees were the most likely to feel that role models should be from the same background as themselves.
Conclusion
Obstacles faced by BME individuals in the labour market
This literature review has laid out the current situation of BME individuals in the UK labour market. BME individuals face substantial obstacles to both participation and progression in the labour market, as evidenced by their significantly worse labour market outcomes compared with their White counterparts, ranging from relatively high unemployment rates to disproportionately low representation in senior roles.
The business case for change
There is a strong business case for encouraging the participation and progression of BME individuals in the labour market, as shown by the research cited in this literature review. In particular, more diverse companies are more likely to have higher financial returns, have an opportunity to widen their talent pool and grow their customer base, and are more likely to develop more innovative business solutions.
Academic evidence of best practice
A variety of factors contribute to the position of BME individuals in the labour market. These range from human, social and financial capital to the lack of role models, differences in individual aspirations and also indirect as well as direct discrimination. Businesses need to take active steps to break down the barriers facing BME individuals in the labour market. This paper has identified a number of possible measures, including but not limited to:
- name- and CV- blind recruitment practices
- diverse interview panels
- systems to manage equality and diversity
- developing role models for BME individuals
Further examples of what employers can do and what has worked best are explored in the Call for Evidence and Roundtable discussions as part of this review.
Further data
Graph 11: Inactivity rates, by ethnic group, ages 16 to 64, 2002 to 2015. Source: DWP, 2016[footnote 161]
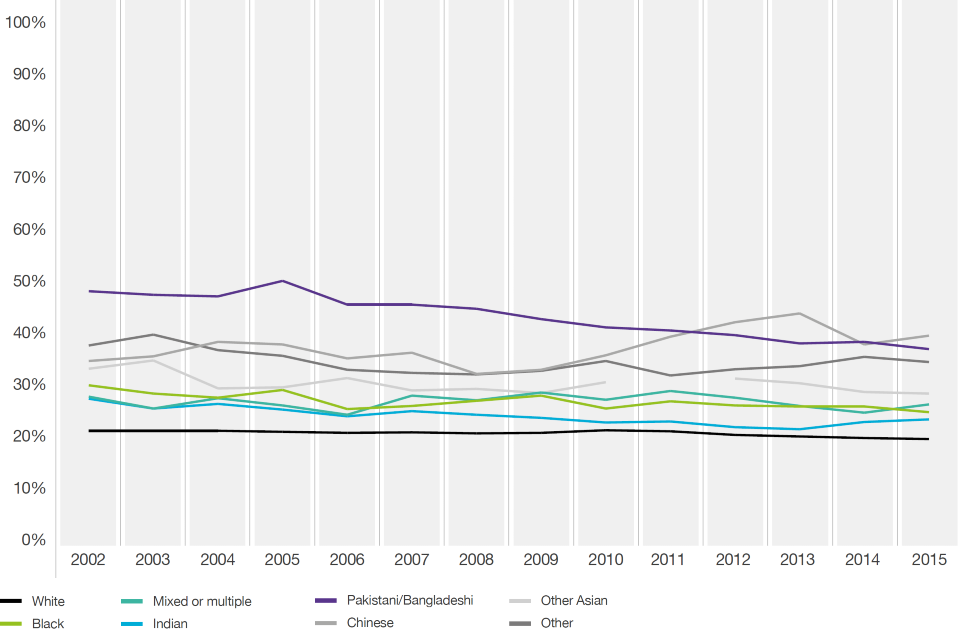
""
| Inactivity rates, ages 16-64 | 2002 | 2003 | 2004 | 2005 | 2006 | 2007 | 2008 | 2009 | 2010 | 2011 | 2012 | 2013 | 2014 | 2015 |
|---|---|---|---|---|---|---|---|---|---|---|---|---|---|---|
| White | 22.1% | 22.1% | 22.1% | 21.9% | 21.7% | 21.8% | 21.6% | 21.7% | 22.2% | 22.0% | 21.3% | 21.0% | 20.7% | 20.5% |
| Black | 30.9% | 29.3% | 28.5% | 30.0% | 26.3% | 26.9% | 27.9% | 28.9% | 26.4% | 27.8% | 27.0% | 26.8% | 26.8% | 25.7% |
| Mixed or multiple | 28.7% | 26.4% | 28.4% | 27.0% | 25.2% | 28.9% | 28.0% | 29.5% | 28.1% | 29.8% | 28.5% | 26.9% | 25.6% | 27.2% |
| Indian | 28.3% | 26.4% | 27.3% | 26.2% | 24.9% | 25.9% | 25.2% | 24.6% | 23.7% | 23.9% | 22.8% | 22.4% | 23.8% | 24.3% |
| Pakistani/Bangladeshi | 49.1% | 48.4% | 48.1% | 51.1% | 46.5% | 46.5% | 45.7% | 43.7% | 42.1% | 41.5% | 40.6% | 39.0% | 39.3% | 37.9% |
| Chinese | 35.6% | 36.5% | 39.3% | 38.8% | 36.1% | 37.2% | 33.1% | 33.9% | 36.7% | 40.3% | 43.1% | 44.8% | 38.8% | 40.5% |
| Other Asian | 34.1% | 35.7% | 30.3% | 30.5% | 32.3% | 29.9% | 30.2% | 29.4% | 31.5% | - | 32.2% | 31.3% | 29.6% | 29.3% |
| Other | 38.6% | 40.7% | 37.7% | 36.6% | 33.9% | 33.3% | 33.0% | 33.7% | 35.6% | 32.8% | 34.0% | 34.6% | 36.4% | 35.4% |
Graph 12: Female inactivity rates, by ethnic group, ages 16 to 64, 2002 to 2015. Source: DWP, 2016[footnote 162]
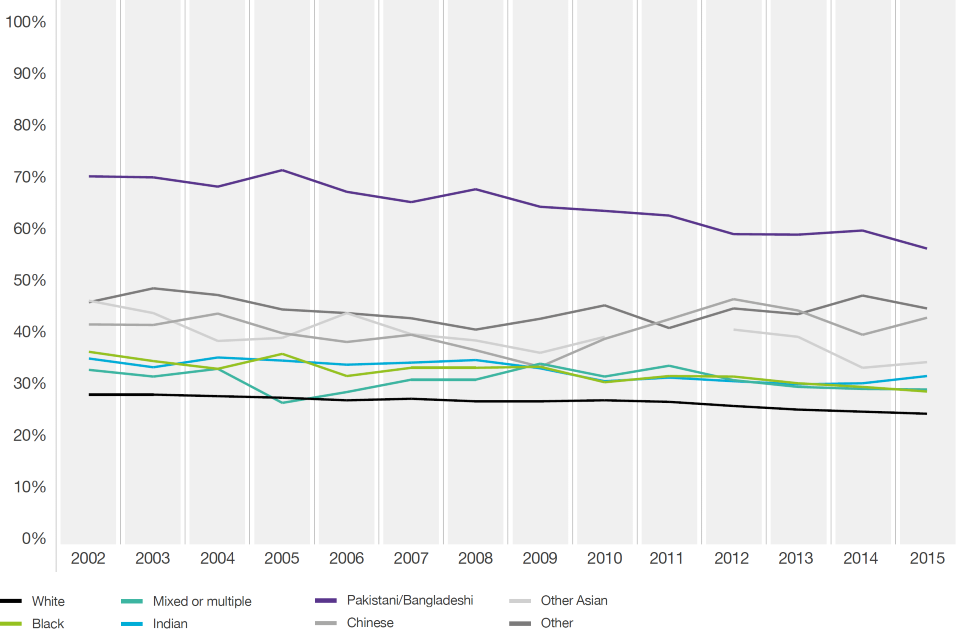
""
| Female inactivity rates, ages 16-64 | 2002 | 2003 | 2004 | 2005 | 2006 | 2007 | 2008 | 2009 | 2010 | 2011 | 2012 | 2013 | 2014 | 2015 |
|---|---|---|---|---|---|---|---|---|---|---|---|---|---|---|
| White | 28.9% | 28.9% | 28.6% | 28.3% | 27.8% | 28.1% | 27.6% | 27.6% | 27.8% | 27.5% | 26.7% | 26.0% | 25.6% | 25.2% |
| Black | 37.2% | 35.4% | 33.9% | 36.8% | 32.5% | 34.1% | 34.1% | 34.3% | 31.3% | 32.5% | 32.4% | 31.1% | 30.4% | 29.5% |
| Mixed or multiple | 33.7% | 32.4% | 33.9% | 27.3% | 29.4% | 31.8% | 31.8% | 34.9% | 32.4% | 34.5% | 31.7% | 30.4% | 30.0% | 29.9% |
| Indian | 35.9% | 34.2% | 36.1% | 35.5% | 34.7% | 35.1% | 35.6% | 34.0% | 31.5% | 32.2% | 31.5% | 30.9% | 31.1% | 32.5% |
| Pakistani/Bangladeshi | 71.2% | 71.0% | 69.2% | 72.4% | 68.2% | 66.2% | 68.7% | 65.3% | 64.5% | 63.6% | 60.0% | 59.9% | 60.7% | 57.2% |
| Chinese | 42.5% | 42.4% | 44.6% | 40.8% | 39.1% | 40.5% | 37.5% | 34.3% | 39.7% | 43.5% | 47.4% | 45.2% | 40.5% | 43.8% |
| Other Asian | 47.1% | 44.7% | 39.3% | 39.9% | 44.7% | 40.6% | 39.4% | 37.0% | 40.1% | - | 41.5% | 40.1% | 34.1% | 35.2% |
| Other | 46.8% | 49.5% | 48.2% | 45.4% | 44.7% | 43.7% | 41.5% | 43.6% | 46.2% | 41.8% | 45.6% | 44.5% | 48.1% | 45.6% |
Graph 13: Male inactivity rates, by ethnic group, ages 16 to 64, 2002 to 2015. Source: DWP, 2016[footnote 163]
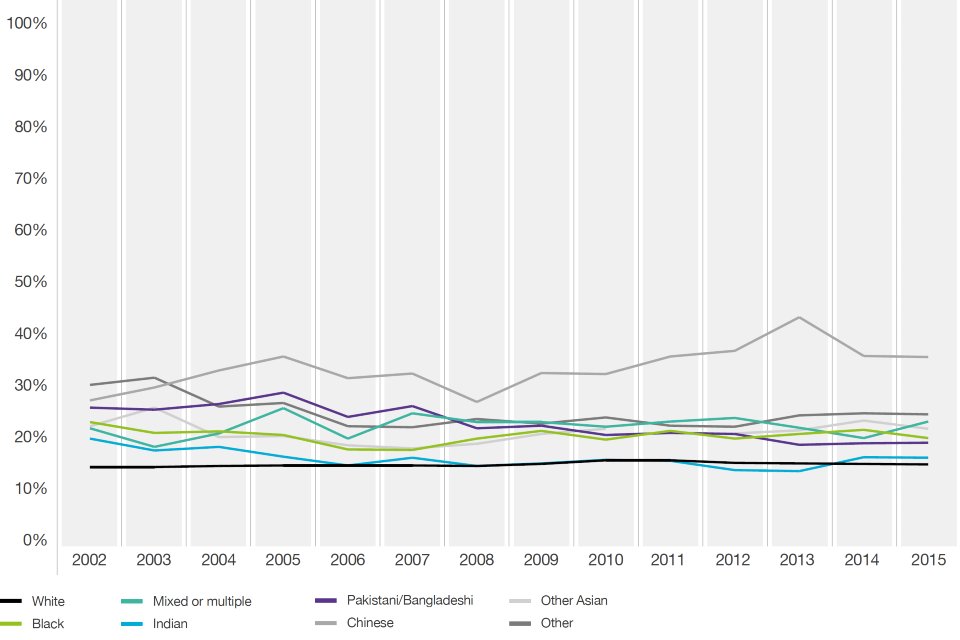
""
| Male inactivity rates, ages 16-64 | 2002 | 2003 | 2004 | 2005 | 2006 | 2007 | 2008 | 2009 | 2010 | 2011 | 2012 | 2013 | 2014 | 2015 |
|---|---|---|---|---|---|---|---|---|---|---|---|---|---|---|
| White | 15.2% | 15.2% | 15.4% | 15.5% | 15.5% | 15.5% | 15.4% | 15.8% | 16.5% | 16.5% | 16.0% | 15.9% | 15.8% | 15.7% |
| Black | 23.9% | 21.8% | 22.1% | 21.4% | 18.6% | 18.5% | 20.7% | 22.2% | 20.5% | 22.2% | 20.7% | 21.6% | 22.4% | 20.8% |
| Mixed or multiple | 22.7% | 19.1% | 21.7% | 26.6% | 20.7% | 25.6% | 23.9% | 23.9% | 23.0% | 24.0% | 24.7% | 22.8% | 20.8% | 24.0% |
| Indian | 20.7% | 18.4% | 19.1% | 17.2% | 15.5% | 17.0% | 15.4% | 15.9% | 16.6% | 16.4% | 14.6% | 14.4% | 17.1% | 17.0% |
| Pakistani/Bangladeshi | 26.7% | 26.3% | 27.4% | 29.6% | 24.9% | 27.0% | 22.7% | 23.2% | 21.4% | 21.8% | 21.6% | 19.5% | 19.8% | 19.9% |
| Chinese | 28.1% | 30.6% | 33.9% | 36.6% | 32.4% | 33.3% | 27.8% | 33.4% | 33.2% | 36.6% | 37.7% | 44.2% | 36.7% | 36.5% |
| Other Asian | 23.1% | 26.7% | 21.0% | 21.2% | 19.4% | 18.8% | 19.7% | 21.6% | 22.6% | - | 21.7% | 22.3% | 24.2% | 22.6% |
| Other | 31.1% | 32.5% | 26.9% | 27.6% | 23.1% | 22.9% | 24.5% | 23.6% | 24.8% | 23.2% | 23.0% | 25.2% | 25.6% | 25.4% |
Graph 14: Employment rates for White and BME workers by age, Quarter 1 2016. Source: ONS Labour Force Survey, 2016[footnote 164]
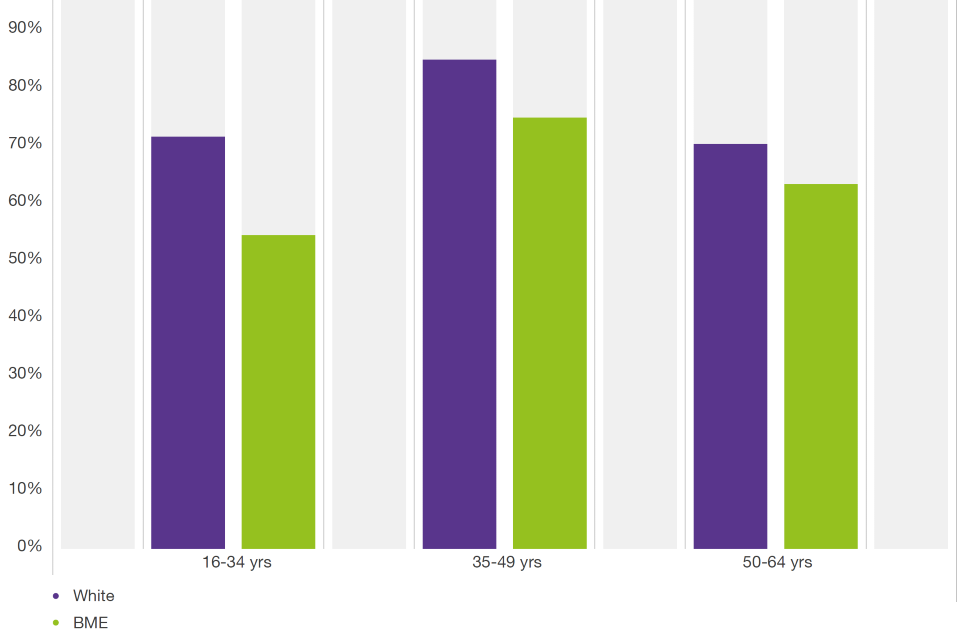
""
| Employment rates for White and BME workers, Q1 2016 | White | BME |
|---|---|---|
| 16-34 yrs | 71.90% | 54.70% |
| 35-49 yrs | 85.30% | 75.20% |
| 50-64 yrs | 70.60% | 63.60% |
Graph 15: Employment rates for White and BME workers by region, Quarter 1 2016. Source: ONS Labour Force Survey, 2016[footnote 165]
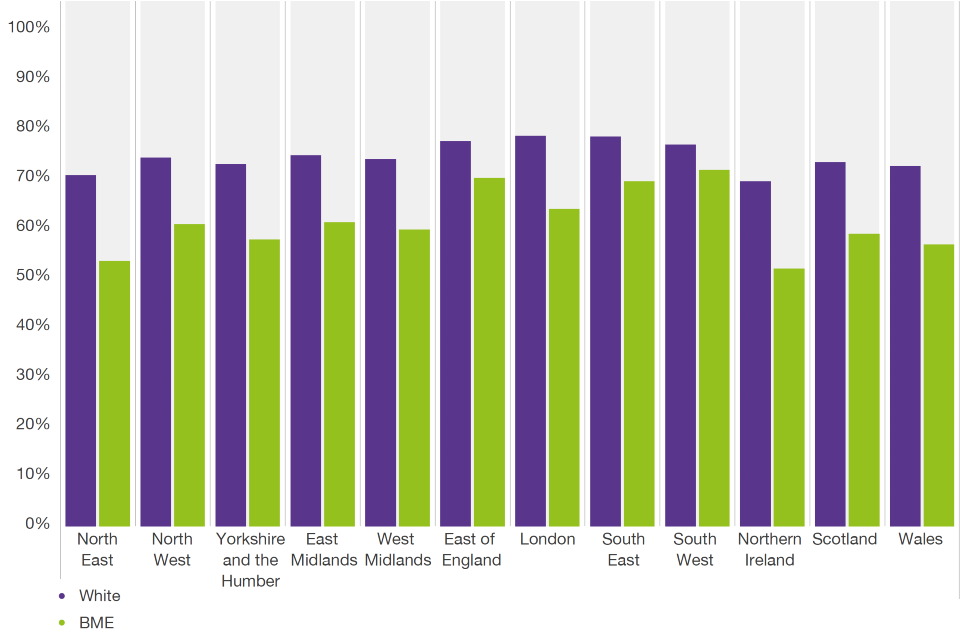
""
| Employment rates for White and BME workers | White | BME |
|---|---|---|
| North East | 71.0% | 53.7% |
| North West | 74.6% | 61.1% |
| Yorkshire and The Humber | 73.3% | 58.0% |
| East Midlands | 75.1% | 61.5% |
| West Midlands | 74.3% | 60.0% |
| East of England | 77.9% | 70.5% |
| London | 79.0% | 64.2% |
| South East | 78.9% | 69.8% |
| South West | 77.2% | 72.1% |
| Northern Ireland | 69.8% | 52.1% |
| Scotland | 73.7% | 59.2% |
| Wales | 72.9% | 57.0% |
Graph 16: Proportion of those in employment who are self-employed by ethnic group and gender, Quarter 1 2016. Source: ONS Labour Force Survey, 2016[footnote 166]
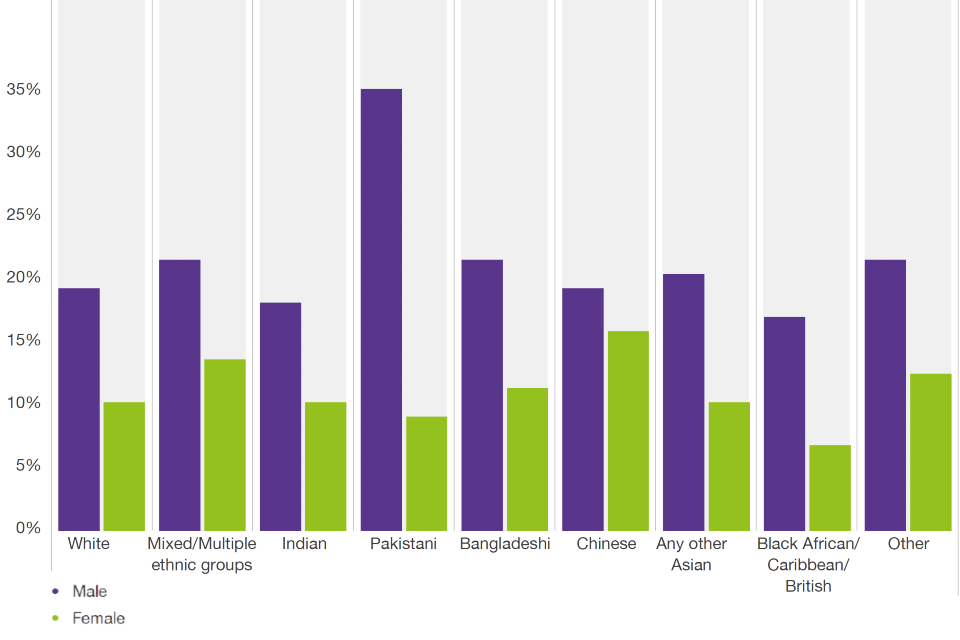
""
| Proportion of those in employment who are self-employed | Male | Female |
|---|---|---|
| White | 17% | 9% |
| Mixed/Multiple Ethnic Groups | 19% | 12% |
| Indian | 16% | 9% |
| Pakistani | 31% | 8% |
| Bangladeshi | 19% | 10% |
| Chinese | 17% | 14% |
| Any other Asian | 18% | 9% |
| Black African/Caribbean/British | 15% | 6% |
| Other | 19% | 11% |
Graph 17: Proportion of temporary workers within White and BME groups, Quarter 1 2016. Source: ONS Labour Force Survey, 2016[footnote 167]
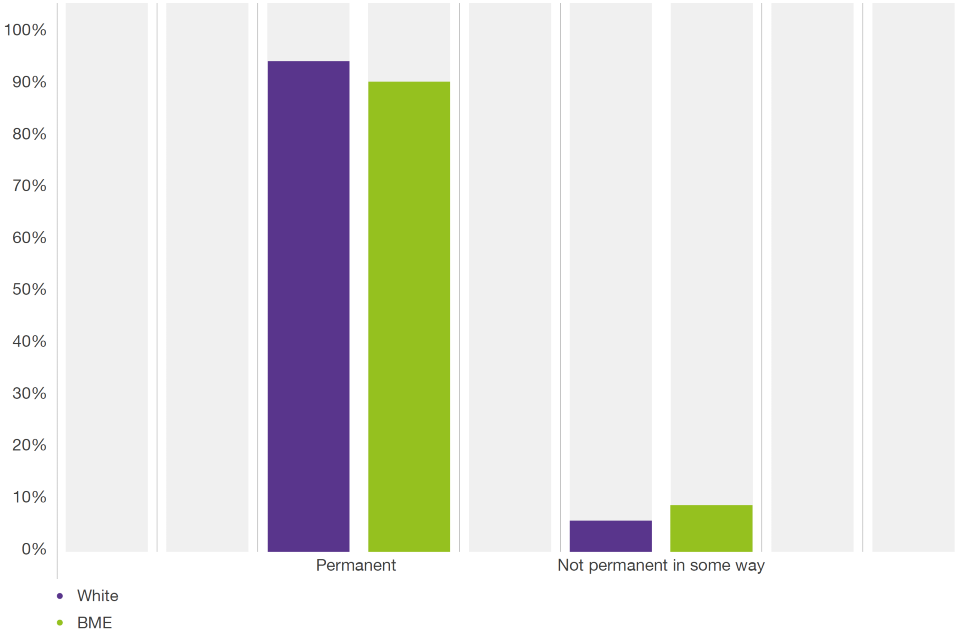
""
| Proportion of temporary workers within White and BME groups | Permanent | Not permanent in some way |
|---|---|---|
| White | 95% | 6% |
| BME | 91% | 9% |
Graph 18: Wage distribution of hourly earnings for Chinese individuals, 2011 to 2015. Source: ONS Labour Force Survey, 2011 to 2015[footnote 168]
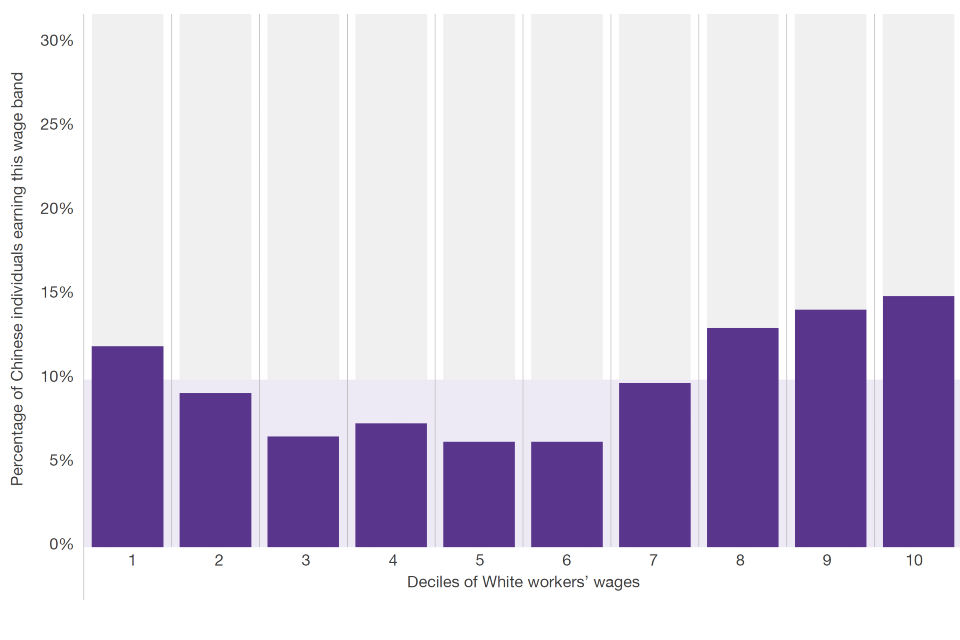
""
| Deciles of White workers wages | Wage distribution of hourly earnings for Chinese individuals ethic groups, 2011-2015 |
|---|---|
| 1 | 12.0% |
| 2 | 9.2% |
| 3 | 6.6% |
| 4 | 7.4% |
| 5 | 6.3% |
| 6 | 6.3% |
| 7 | 9.8% |
| 8 | 13.1% |
| 9 | 14.2% |
| 10 | 15.0% |
Graph 19: Wage distribution of hourly earnings for Other Asian individuals, 2011 to 2015. Source: ONS Labour Force Survey, 2011 to 2015[footnote 169]
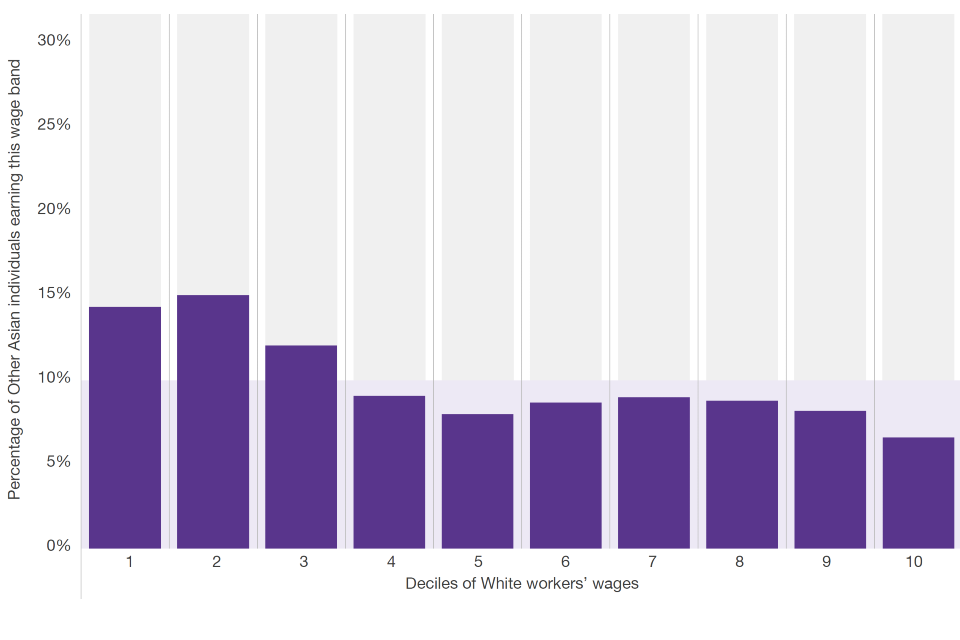
""
| Deciles of White workers wages | Wage distribution of hourly earnings for Other Asian individuals, 2011 to 2015 |
|---|---|
| 1 | 14.4% |
| 2 | 15.1% |
| 3 | 12.1% |
| 4 | 9.1% |
| 5 | 8.0% |
| 6 | 8.7% |
| 7 | 9.0% |
| 8 | 8.8% |
| 9 | 8.2% |
| 10 | 6.6% |
Graph 20: Wage distribution of hourly earnings for Mixed/Multiple ethnic groups individuals, 2011 to 2015. Source: ONS Labour Force Survey, 2011 to 2015[footnote 170]
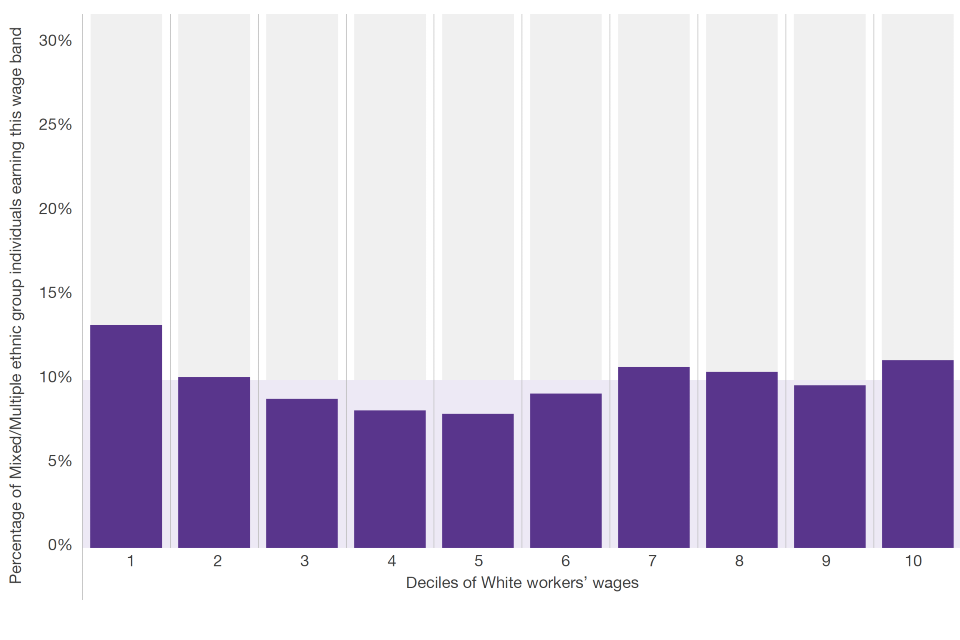
""
| Deciles of White workers wages | Wage distribution of hourly earnings for Mixed/Multiple ethic groups individuals, 2011-2015 |
|---|---|
| 1 | 13.3% |
| 2 | 10.2% |
| 3 | 8.9% |
| 4 | 8.2% |
| 5 | 8.0% |
| 6 | 9.2% |
| 7 | 10.8% |
| 8 | 10.5% |
| 9 | 9.7% |
| 10 | 11.2% |
Table 2: Sector as proportion of ethnic group employment. Source: DWP, 2016[footnote 171]
| Employment sector | White | Black | Mixed | Indian | Pakistani | Bangladeshi | Chinese | Other Asian | Other | Unknown | All ethnic minorities |
|---|---|---|---|---|---|---|---|---|---|---|---|
| Agriculture, forestry and fishing | 1.2% | ** | ** | ** | ** | ** | ** | ** | ** | ** | 0.2%* |
| Mining and quarrying | 0.5% | ** | ** | ** | ** | ** | ** | ** | 1.0%* | ** | 0.3% |
| Manufacturing | 10.0% | 4.0% | 4.6%* | 9.8%* | 6.0%* | 3.4%* | 8.8%* | 4.1%* | 5.9%* | ** | 6.1% |
| Electricity, gas, steam and air conditioning | 0.6% | ** | ** | ** | ** | ** | ** | ** | ** | ** | 0.3% |
| Water supply, sewerage, waste | 0.7% | ** | ** | ** | ** | ** | ** | ** | ** | ** | 0.3% |
| Construction | 7.6% | 3.2% | 4.8%* | 4.6%* | 2.4%* | ** | ** | 1.0%* | 3.5% | ** | 3.3% |
| Wholesale and retail trade; repair of motor | 12.8% | 12.1% | 13.2% | 16.6% | 20.4% | 17.2% | 17.2% | 18.0% | 13.2% | ** | 15.5% |
| Transportation and storage | 4.8% | 6.6% | 3.6% | 5.1% | 14.6% | 7.3% | ** | 6.6% | 5.7% | ** | 6.7% |
| Accommodation and food service activities | 5.0% | 4.2% | 7.2% | 4.0% | 5.3% | 24.7% | 15.6% | 12.0% | 12.0% | ** | 7.7% |
| Information and communication | 3.9% | 3.2% | 5.6% | 7.8% | 5.0% | ** | 7.3% | 2.8% | 6.1% | ** | 5.2% |
| Financial and insurance activities | 3.9% | 3.9% | 4.5% | 7.2% | 4.2% | 6.1% | 7.4% | 2.3% | 3.1% | ** | 4.7% |
| Real estate activities | 1.1% | 1.5% | 1.4%* | 0.8%* | 1.7%* | ** | ** | ** | ** | ** | 1.1% |
| Professional, scientific and technical | 7.1% | 4.5% | 8.2% | 7.8% | 5.6% | 4.5%* | 10.4% | 5.4% | 6.1% | ** | 6.3% |
| Administrative and support service | 4.7% | 8.6% | 7.4% | 3.1% | 6.3% | ** | ** | 5.6% | 6.1% | ** | 5.7% |
| Public administration and defence | 6.0% | 6.9% | 5.1% | 4.4% | 3.0% | 4.2% | ** | 4.3% | 3.8% | ** | 4.7% |
| Education | 10.8% | 8.2% | 11.8% | 7.4% | 8.9% | 10.8% | 10.0% | 6.0% | 7.7% | ** | 8.3% |
| Human health and social work activities | 12.6% | 26.3% | 14.0% | 15.8% | 10.9% | 11.2% | 8.9% | 24.5% | 17.5% | 17.4%* | 18.2% |
| Arts, entertainment and recreation | 2.9% | 2.2% | 2.9% | 1.4% | 0.9%* | ** | ** | 1.4%* | 1.8% | ** | 1.7% |
| Other service activities | 2.8% | 2.5% | 2.9% | 2.0% | 2.5% | ** | ** | 3.4% | 3.7% | ** | 2.6% |
| Activities of households as employers | 0.2% | ** | ** | ** | ** | ** | ** | ** | ** | ** | 0.2%* |
| Activities of extraterritorial organisations | 0.1% | ** | ** | ** | ** | ** | ** | ** | ** | ** | 0.2% |
| Unknown | 0.6% | 1.0% | 1.2%* | 0.6%* | 1.3%* | ** | ** | ** | ** | ** | 0.8% |
*Excluding households as employers, activities of extra-territorial organisations and unknown
**Denotes sectors where sample sizes were too small to derive definite numbers
c. Impact methodology
Summary
The potential benefit to the UK economy from full representation of BME individuals across the labour market through improved participation and progression is estimated to be £24 billion per annum, which represents 1.3% of GDP in the year to June 2016. This is the estimate of the direct economic benefit if BME individuals were immediately fully represented across the workforce in the same proportions as White individuals. This assumes no displacement effects, meaning if the employment levels and progression of BME individuals increases then this would not impact upon the employment levels and pay of the White population. It does not capture the second order impacts (for example, impacts on pay and hours worked, reduction in benefit payments), the additional benefits of diversity in the workplace and wider social impacts.
Methodology
This section sets out the methodology and assumptions to monetise the potential benefits if BME individuals were fully represented across the workforce, for the working age population (aged 16 to 64). The figure is made up of 2 elements, participation and progression, which together represent the economic value to the economy:
Participation
If BME individuals were fully represented across the workforce, each ethnic group would have the same employment rate as White individuals. Taking the total working age population in each BME group and the employment rate for the White group gives an estimate of the total number of people in employment if the employment rates were the same across all ethnic groups. Using the total working age population (aged 16 to 64), multiplied by the proportion of the working age population in each ethnic group, multiplied by the employment rate for each ethnic group gives an estimate of the current number of individuals in employment for each ethnic group.
The difference between the estimate for the current number of individuals in employment and the estimate if BME individuals were fully represented in employment gives the lost potential in terms of numbers of people in employment. This number is multiplied by the median salary for all employees (this includes both full time and part time, for ages 16 to 64) to calculate the monetary benefit. The total benefit through closing the employment rate gap for ethnic minorities is £16.8 billion per annum.
Progression
Progression is defined using standard occupational classification codes and comparing the proportions of different ethnic groups across the standard occupation groupings. Overall, BME individuals are less likely to be in jobs in the higher occupation groupings, even after controlling for education. Controlling for differences in education, we construct a scenario in which BME individuals have the same distribution in occupation groups as White individuals and compare this scenario with the actual distribution for BME individuals.
We have a breakdown of the composition of education levels for White and BME groups. These are categorised by: degree or equivalent, higher education[footnote 172], A-level, GCSE, other qualifications, no qualifications. The composition of education levels varies between BME and White groups. A higher proportion of BME individuals have degrees than White individuals, though a higher proportion of BME individuals also have no qualifications. Using this breakdown we can estimate the number of BME people within each level of education.
For each education level, there is a breakdown of the proportions of people in employment for each occupation code for both White and BME groups – for example, the distribution of employed people by occupation group for White individuals with degrees and BME individuals with degrees. Overall, there tend to be higher proportions of White individuals in more senior occupations and lower proportions in lower skilled occupations compared with BME individuals after controlling for differences in education.
Multiplying the number of BME people in each education level by the proportion in each occupation groups gives an estimate of the number of BME people in employment for each occupation group. This number is multiplied by the median salary (for ages 16 to 64, including full time and part time) for employees for the relevant occupation group to calculate the total salaries. This gives an estimate of the current total salaries for BME individuals.
If BME individuals were fully represented across the workforce, it is assumed that the proportions in each occupation group would be the same as for White individuals. Applying the occupation distribution of White individuals to the BME population, controlling for the differences in composition of education levels, gives an estimate of the number of BME individuals in each occupation. Median salary data for each occupation is used to estimate the total salaries. In this scenario the total salaries of BME individuals are higher as there are generally more people in higher occupation groups who earn more, and fewer people in the lower skilled occupation groups who earn less.
The difference between the current estimate of salaries of BME individuals and the scenario in which BME individuals are fully represented gives the total monetary potential benefit. The total benefit if BME individuals had equal progression to White individuals in the labour market is £7.1 billion per annum.
Caveats and limitations
This methodology has the following assumptions and caveats.
It assumes no displacement, meaning if the employment levels and progression of BME individuals increases then this will not impact upon the employment levels and pay of the White population.
The number measures the potential benefits using salaries as a proxy for economic value. This could therefore be considered to underestimate the full economic value of BME individuals.
We control only for education, as controlling for any more variables (such as age – a commonly used proxy for experience – gender, industry or other common wage equation variables) would make the sample sizes in the analysis too small to be robust.
The employment rate and occupation composition of the White individuals is assumed to be the scenario if BME individuals were fully represented across the workforce. This is not necessarily the full potential of these individuals, as there are many programmes underway to boost the participation and progression of all individuals in the UK above current levels.
It does not include the second order effects (for example impacts on pay, hours worked, reduction in benefit payments), wider social impacts and potential multiplier impacts on the economy. It also does not capture any effects on productivity beyond the marginal increase from higher skilled work which is reflected in higher salaries.
It has not included the opportunity cost for those moving into work. This includes the activities that these individuals would have been doing otherwise, for example unpaid household work or child care. Additionally, we do not make any assumptions about preferences or wellbeing.
It does not capture benefits of diversity in the workplace.
Those aged 65 and above are not included in the analysis, as the size of the over 65 population will adversely affect the employment rates used in the analysis. However, there will be BME individuals aged over 65 who have the ability and skills to participate in, or progress through, the labour market.
Those moving into work through increased participation are assumed to earn the current median salary and the progression uplift is not applied to these additional workers.
The number is likely to be a slight underestimate as the median salary is based on the total population including BME individuals. If BME progression in the labour market increased then the median salary for all those of working age would increase, leading to an increase in the benefits estimated from the increase in participation.
d. Call for evidence summary
As part of the review, we issued a call for evidence to seek views from a wider group. The call for evidence was open to all, from May to August 2016. It covered individuals’, employers’ and organisations’ thoughts on the impacts of having a more ethnically diverse workforce, their experiences of which obstacles BME individuals face in the labour market, data disclosure mechanisms for employers and practices which support progression for BME individuals. Finally, it called on respondents to give their view on what the role of business and government is in supporting the labour market progression of BME individuals. We thank all respondents for taking the time to take part in the call for evidence and for their insightful responses.
Selected case studies from the call for evidence of employer practices and policies which support BME individuals’ progression in work can be found in the main report of the review.
Summary of responses and respondents’ characteristics
There were a total of 479 respondents to the call for evidence. Of these, 416 responded as an individual, 26 responded as an employer and 37 responded as an organisation.
Characteristics of individual respondents
Graph 21: Age range of individual respondents
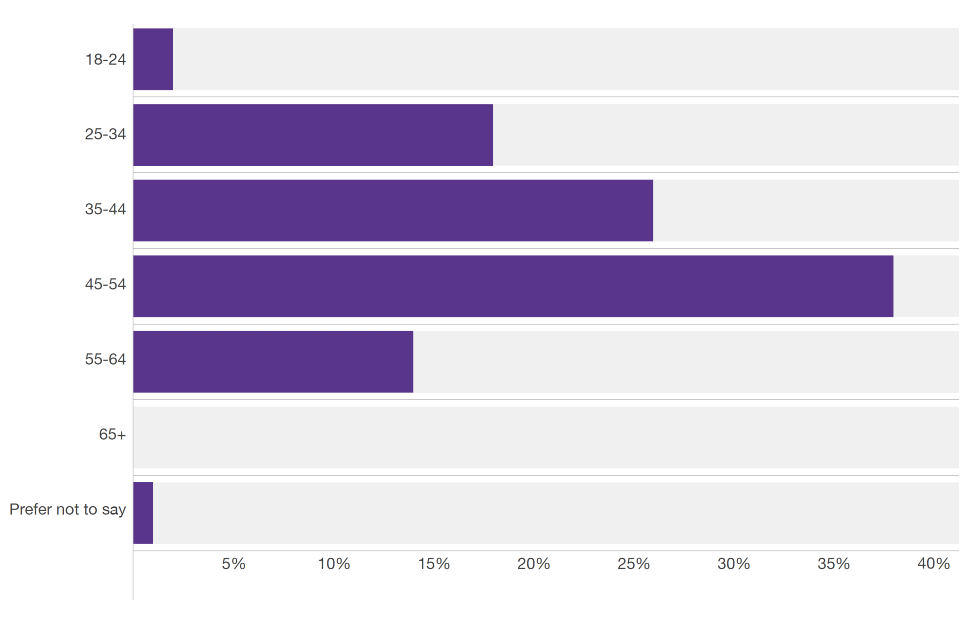
""
| Age range | Proportion of individual respondents |
|---|---|
| 18-24 | 2% |
| 25-34 | 18% |
| 35-44 | 26% |
| 45-54 | 38% |
| 55-64 | 14% |
| 65+ | 0% |
| Prefer not to say | 1% |
As Graph 21 shows, individuals were most commonly in the 45 to 54 age range, followed by the 35 to 44 age range. 61% of individual respondents were female, while 39% were male.
Graph 22: Ethnicity of individual respondents
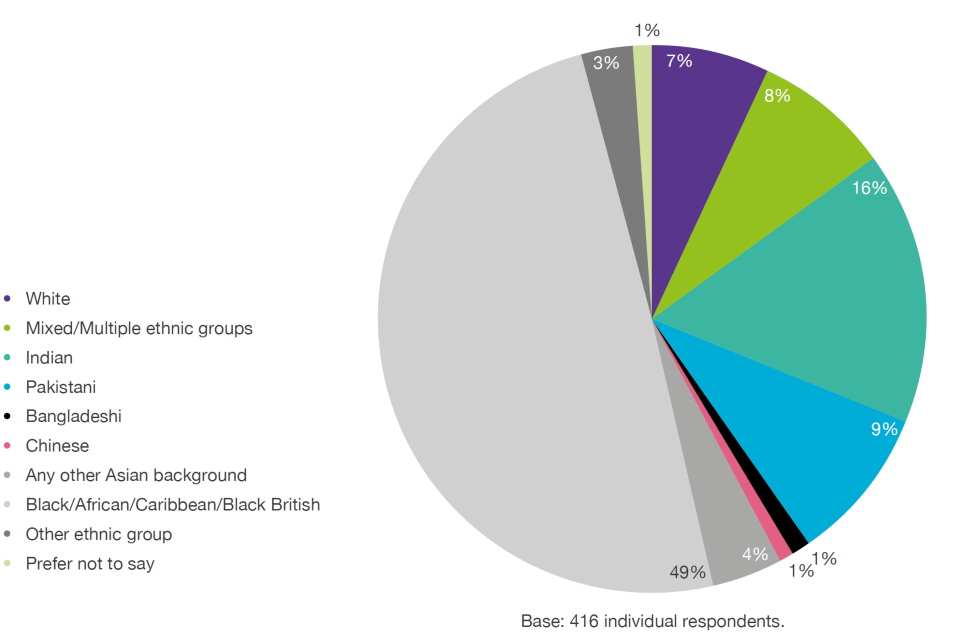
""
| Ethnicity | Proportion of individual respondents |
|---|---|
| White | 7% |
| Mixed/Multiple ethnic groups | 8% |
| Indian | 16% |
| Pakistani | 9% |
| Bangladeshi | 1% |
| Chinese | 1% |
| Any other Asian background | 4% |
| Black/African/Caribbean/Black British | 49% |
| Other ethnic group | 3% |
| Prefer not to say | 1% |
Individuals who identified with a range of ethnic groups responded to the call for evidence. Graph 22 shows that almost half of respondents identified as Black African/Caribbean/Black British. 16% of respondents identified as Indian, 9% identified as Pakistani, 8% identified as belonging to mixed/ multiple ethnic groups and 7% identified as White. With respect to the remaining ethnic groups, less than 5% identified with each of these.
Respondents were most commonly concentrated in London (41%), the West Midlands (14%) and the South East (12%), with a spread of responses throughout the UK regions. 38% of respondents stated that they had a formal responsibility for supervising the work of others employees at work, while 59% stated that they did not (2% preferred not to say).
Three-quarters of respondents had qualifications at degree level or above, whilst 11% had A-levels or equivalent and 6% had GCSEs (grades A*-C) or equivalent.
Characteristics of those responding as employers and organisations
Of the 26 who responded as employers, 16 were in the private sector, 8 were in the public sector and 2 were in the charity/ voluntary sector. The majority were large employers with over 500 employees. These employers were based in a range of regions throughout the UK.
Of the 37 who responded as organisations, there was a wide variety in the types of organisations that responded. These include trade unions, industry and employer associations, charities, universities and local councils. Whether respondents answered to the call for evidence as employers or organisations was self-defined.
The case for change
The call for evidence examined whether individuals and employers consider BME individuals to be fairly represented within the workforce, relative to the 14% of the working age population that identify as BME. Over half of the individuals reported BME individuals are underrepresented where they work, less than 1 in 10 people thought that BME individuals were broadly represented and one-fifth reported that BME individuals were overrepresented in their workplace relative to the working age population – the rest did not know. 87% of individuals reported that the proportion of BME senior managers in their workplace was less than 14%.
In comparison, when employers were asked what proportion of their employees are BME, nearly half reported that BME employees are underrepresented, almost one-fifth reported that BME employees are broadly represented and one-third reported that BME employees are overrepresented in their workforce. Three-quarters of employers reported that less than 14% of the senior managers in their organisation are BME.
Graph 23: Individual respondents, “What do you see as the impacts of having an ethnically diverse workforce?”
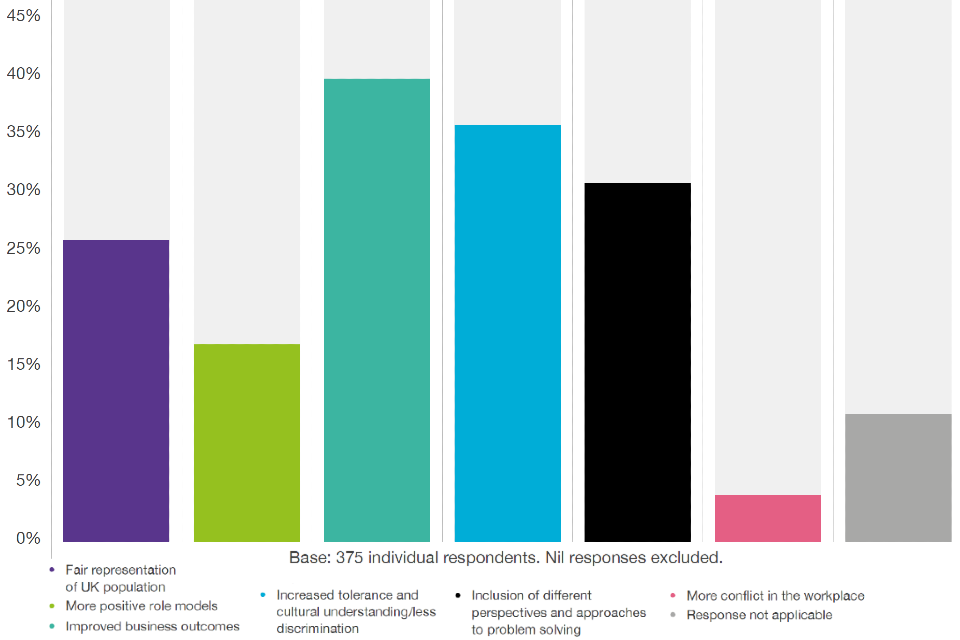
""
| “What do you see as the impacts of having an ethnically diverse workforce?” | Proportion of individual respondents |
|---|---|
| Fair representation of UK population | 26% |
| More positive role models | 17% |
| Improved business outcomes | 40% |
| Increased tolerance and cultural understanding/less discrimination | 36% |
| Inclusion of different perspectives and approaches to problem solving | 31% |
| More conflict in the workplace | 4% |
| Response not applicable | 11% |
As Graph 23 shows, the overwhelming majority of individual respondents identified diversity in the workforce as having positive outcomes, including improved business outcomes (40%) and increased tolerance and cultural awareness (36%). A small proportion of respondents (4%) felt ethnic diversity in the workforce could cause increased conflict within the workforce.
Almost half of employers who responded said they had evidence from their business that ethnic diversity had changed business outcomes. Common business impacts reported by employers and organisations were:
- attracting staff from a wider talent pool and increased staff retention
- improved employee engagement, motivation and more effective teams
- better reflecting the diversity of the customer base resulting in improved understanding of clients’ needs, better service and higher customer satisfaction
- diversity of languages spoken and cultural awareness leading to new market opportunities
- strengthening connections to the local community
- better problem solving, increased quality of decision making and increased innovation
Obstacles to progression
Experiences of obstacles to progression
Graph 24: Individual respondents, “Which of the following factors do you think may have impacted upon your progression at work?”
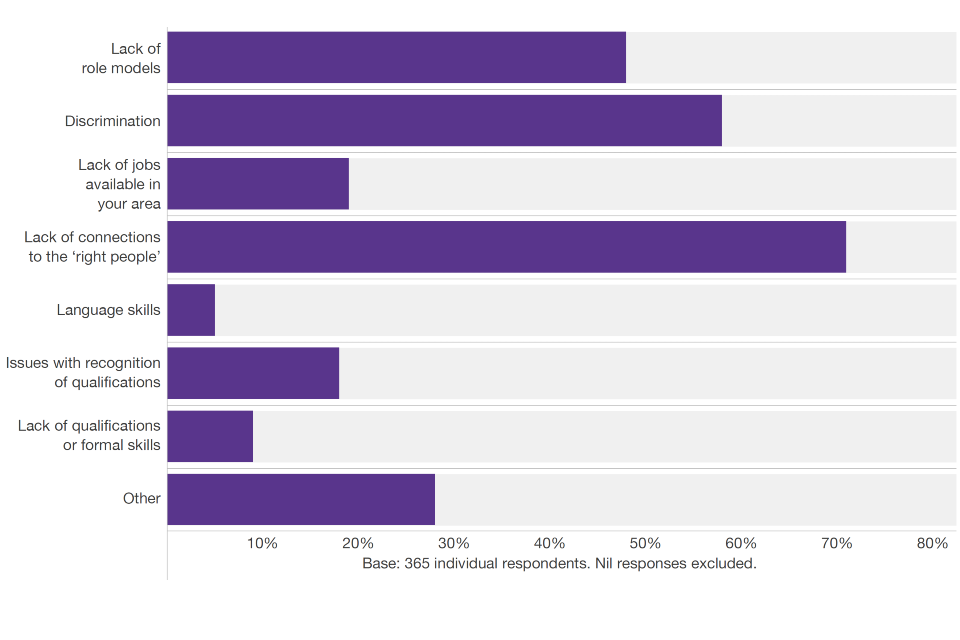
""
| “Which of the following factors do you think may have impacted upon your progression at work?” | Proportion of individual respondents |
|---|---|
| Lack of role models | 48% |
| Discrimination | 58% |
| Lack of jobs available in your area | 19% |
| Lack of connections to the ‘right people’ | 71% |
| Language skills | 5% |
| Issues with recognition of qualifications | 18% |
| Lack of qualifications or formal skills | 9% |
| Other | 28% |
74% of individual respondents reported that they were not satisfied with how their career had progressed to date, as opposed to 22% who stated that they were satisfied. 79% of BME individuals reported that they were not satisfied with their career progression, compared with only 26% of White individuals. 88% of BME individuals said they perceived there to be difficulties which have limited their chances to progress in work, compared with only 52% of White respondents. Graph 24 shows the obstacles individuals thought they have encountered in their career which impacted upon their progression at work.
Overall, the responses seem to indicate that individuals felt they did not struggle due to a lack of qualifications or competency, but rather factors that they felt unfairly limited their career progression, as shown in Graph 24. Most notably, these were lack of connection to the ‘right people’ (71%), discrimination (58%) and lack of role models (48%). Additionally, individuals noted that lack of training, lack of opportunities, inability to work flexibly, nontransparent processes and lack of cultural awareness, including during social activities had affected their progression.
Graph 25: Employer and organisation respondents, “Evidence suggests that BME individuals have difficulty in accessing jobs that match their skills and are not progressing as far as their White counterparts in their careers. What factors do you think might be causing this?”
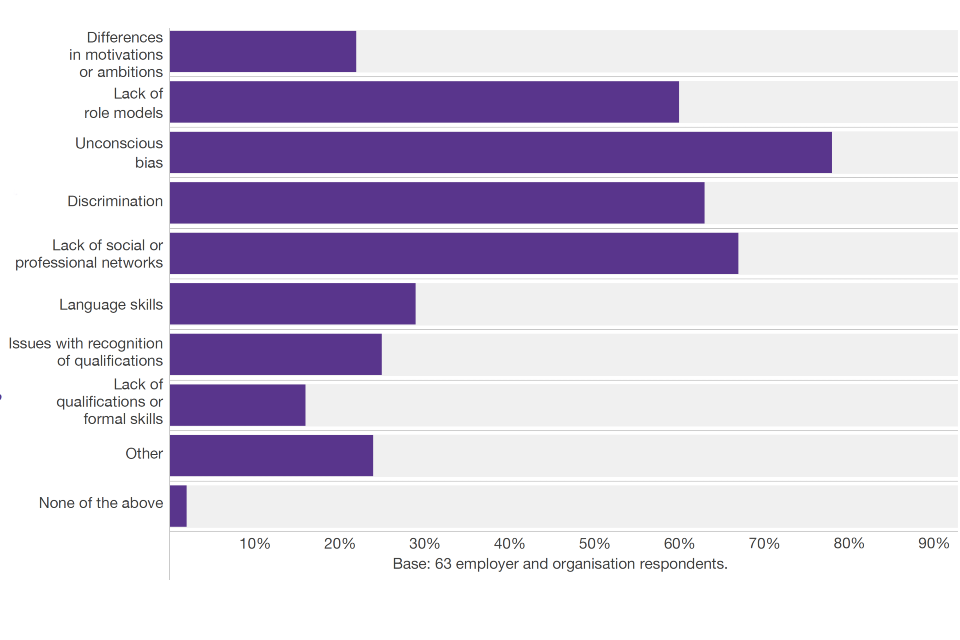
""
| “Evidence suggests that BME individuals have difficulty in accessing jobs that match their skills and are not progressing as far as their White counterparts in their careers. Which factors do you think might be causing this?” | Proportion of employer and organisation respondents |
|---|---|
| Differences in motivations or ambitions | 22% |
| Lack of role models | 60% |
| Unconscious bias | 78% |
| Discrimination | 63% |
| Lack of social or professional networks | 67% |
| Language skills | 29% |
| Issues with recognition of qualifications | 25% |
| Lack of qualifications or formal skills | 16% |
| Other | 24% |
| None of the above | 2% |
Similarly, Graph 25 shows that employers and organisations thought that the most common factors that limited progression of BME individuals were unconscious bias, discrimination, lack of networks and lack of role models.
Differences among ethnic groups were apparent with regard to discrimination. Two-thirds of BME individuals reported that they had experienced racial harassment or bullying in the workplace in the last 5 years.
The call for evidence also explored how individuals come to find out about job opportunities. Generally, respondents used several methods to find out about jobs (see Table 3 below). Among the most common were online adverts (64%), internal adverts (55%) and professional networks (41%). This highlights the importance of both professional and social networks in providing new job opportunities to progress.
Table 3: Individual respondents, “How do you find out about job opportunities?”
| “How do you find out about job opportunities?” | Proportion of individual respondents |
|---|---|
| Through professional networks | 41% |
| Through social networks | 27% |
| Through a recruitment agency | 30% |
| Online adverts | 64% |
| Adverts in newspapers/magazines | 27% |
| Job fairs | 7% |
| Job Centre Plus | 5% |
| Internal adverts (within your existing employer) | 55% |
| Through a headhunter | 12% |
| Donʼt know | 2% |
Base: 413 individual respondents. Multiple responses allowed and nil responses excluded.
Impacts of obstacles on progression
Graph 26: Individual respondents, “Can you provide more detail on how your ethnicity has impacted on your opportunities to progress?”
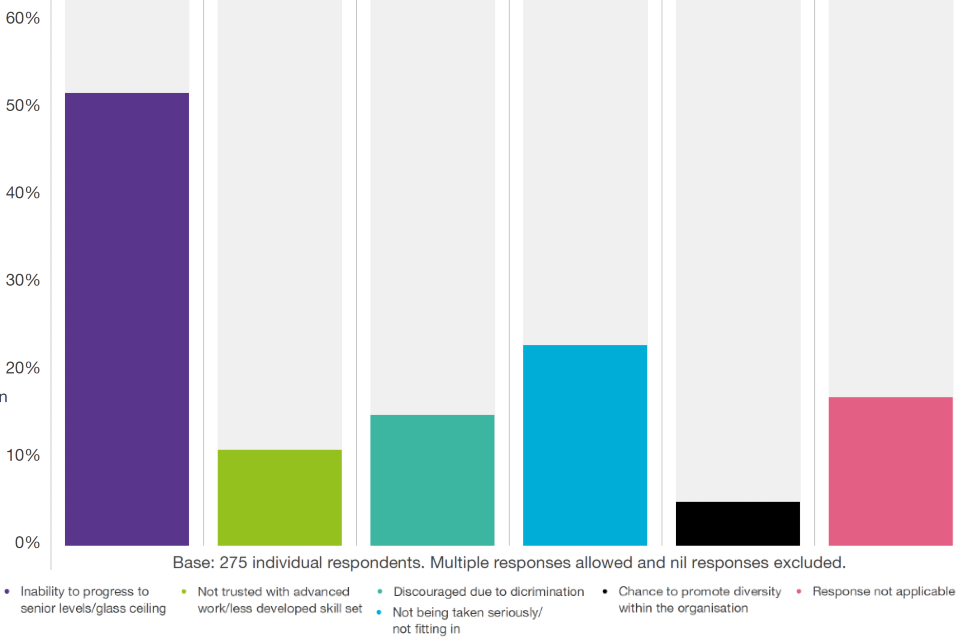
""
| “Can you provide more detail on how your ethnicity has impacted on your opportunities to progress?” | Proportion of individual respondents |
|---|---|
| Inability to progress to senior levels / glass ceiling | 52% |
| Not trusted with advanced work / less developed skill set | 11% |
| Discouraged due to dicrimination | 15% |
| Not being taken seriously / not fitting in | 23% |
| Chance to promote diversity within the organisation | 5% |
| Response not applicable | 17% |
72% of BME respondents believed that their ethnicity had had an impact on their opportunities to progress in their career, whilst only 27% of White respondents believed this to be true. Graph 26 shows how individuals felt their ethnicity had impacted on their opportunities to progress. Of those who said their ethnicity had impacted on their opportunities to progress, 52% felt there was an inability to progress to senior levels, whilst 23% felt they were not taken seriously nor did not fit in.
Data
The call for evidence sought to identify whether individuals choose to disclose their data on their ethnicity, and if not why they would choose not to do this. Of all the individual respondents, 89% stated that they disclose their data, with only 8% stating that they choose not to do this. Disclosure rates were very high among both White and BME individuals. Of the individuals who choose not to disclose their ethnicity data, the most commonly cited reason was that information would be used against the respondent (54%). Other reasons mentioned were that respondents did not see value in disclosing information (13%) or thought it was too time consuming (11%).
All but one of the employer respondents said their organisation collects data on employee ethnicity (see Table 4 below). Most commonly, employers collected the number of employees by ethnicity, followed by the position within the business. Some employers also collected data on ethnicity in relation to recruitment, appraisals and for staff engagement scores. Nondisclosure of ethnicity by employees was cited as an issue by the majority of employers, whilst limitation of the HR system was cited by others as a barrier to data collection on ethnicity. Trade unions, industry and employer bodies also noted similar experiences on ethnicity data collection.
Table 4: Employer respondents, “Which of the following does your business collect data on?”
| “Which of the following does your business collect data on?” | Proportion of individual respondents |
|---|---|
| Number of employees by ethnicity | 96% |
| Average pay by ethnicity | 56% |
| Salary bands by ethnicity | 64% |
| Position within the business by ethnicity | 80% |
| Gender by ethnicity | 72% |
| Age by ethnicity | 60% |
| Other | 28% |
| Don’t know | 4% |
Base: 25 employer respondents. Multiple responses allowed and nil responses excluded.
64% of the employers said they had initiatives to encourage the disclosure of ethnicity information. Of these, three-quarters felt these initiatives had been effective in increasing disclosure rates. Examples of effective initiatives included:
- collecting the data at interview stage for all candidates
- including diversity data collection within the on-boarding process for all new staff
- carrying out an annual diversity data audit or including it as part of an engagement survey
- having a diversity data month
- information leaflets or intranet page with detail on what the information is used for and confidentiality of the data
- sponsorship from senior leaders
- reminders which can be cascaded to all staff
Employer practices and policies
The call for evidence aimed to identify practices currently in place in organisations which support BME progression, whether individuals are making use of these and what works.
Graph 27: Individual and employer respondents, policies and practices to support BME progression in work
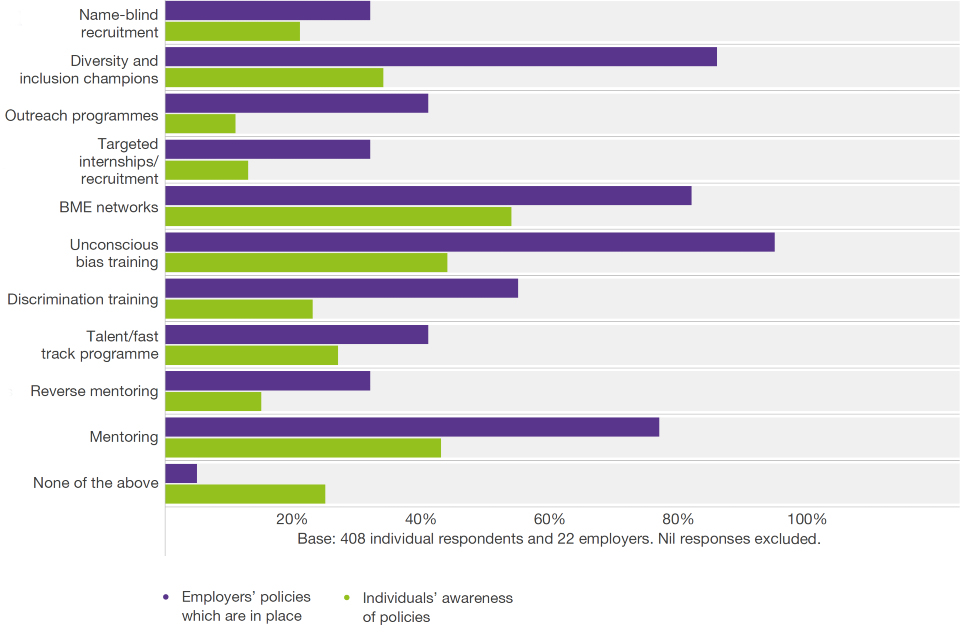
""
| Policies and practices to support BME progression in work | Proportion of individual respondents | Proportion of employer and organisation respondents |
|---|---|---|
| None of the above | 25% | 5% |
| Mentoring | 43% | 77% |
| Reverse mentoring | 15% | 32% |
| Talent/fast track programme | 27% | 41% |
| Discrimination training | 23% | 55% |
| Unconscious bias training | 44% | 95% |
| BME networks | 54% | 82% |
| Targeted internships/recruitment | 13% | 32% |
| Outreach programmes | 11% | 41% |
| Diversity and inclusion champions | 34% | 86% |
| Name-blind recruitment | 21% | 32% |
Individuals were asked whether they were aware of a number of policies or practices that support BME progression. As Graph 27 shows, the initiatives individuals were most commonly aware of were BME networks (54%), unconscious bias training (44%), mentoring (43%), and diversity and inclusion champions (34%).
However, when asked about the support that was available to them personally, 50% stated that they had no support to help them progress other than their direct line manager. One-third said that there were training courses available to them and 23% stated that they had a mentor. Half of the respondents said they had access to support which is aimed at improving BME career progression but had not used it. 70% of individuals said their employer could provide more support to help with their career progression. Relatively small proportions of both White (30%) and BME (31%) individuals reported having career role models within or outside of their workplace.
The vast majority (91%) of employer respondents had policies or practices in place that actively support BME progression. Similarly to individual respondents, unconscious bias training, diversity and inclusion champions, BME networks and mentoring were the most common policies and practices which employers said they had in place. There is a clear disparity between the proportion of individuals who are aware of these policies and the proportion of employers who report that these policies are in place.
There was a large range in the proportion of BME employees who had completed these schemes. Most employers said they did not know the proportion of BME employees who had completed these schemes, whereas other employers’ responses ranged from 10% to 100%.
Graph 28: Individual respondents, “What were the most beneficial aspects of schemes or programmes available in your workplace?”
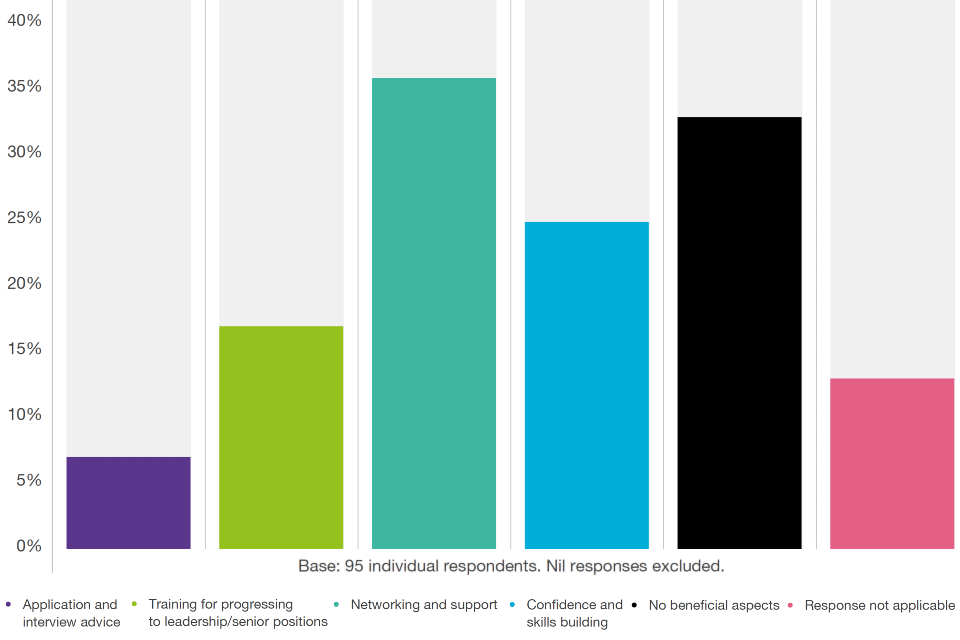
""
| “What were the most beneficial aspects of schemes or programmes available in your workplace?” | Proportion of individual respondents |
|---|---|
| Application and interview advice | 7% |
| Training for progressing to leadership/senior positions | 17% |
| Networking and support | 36% |
| Confidence and skills building | 25% |
| No beneficial aspects | 33% |
| Response not applicable | 13% |
As shown in Graph 28, while many applicants identified positive aspects of programmes targeted towards BME progression in their workplace, such as networking and support (36%) and confidence and skills building (25%), one-third stated that there had not been any beneficial aspects to the programmes. The lack of ongoing support and continued lack of opportunities to progress after training were found to be the least beneficial aspects (see Graph 29).
Graph 29: Individual respondents, “What were the least beneficial aspects of schemes or programmes available in your workplace?”
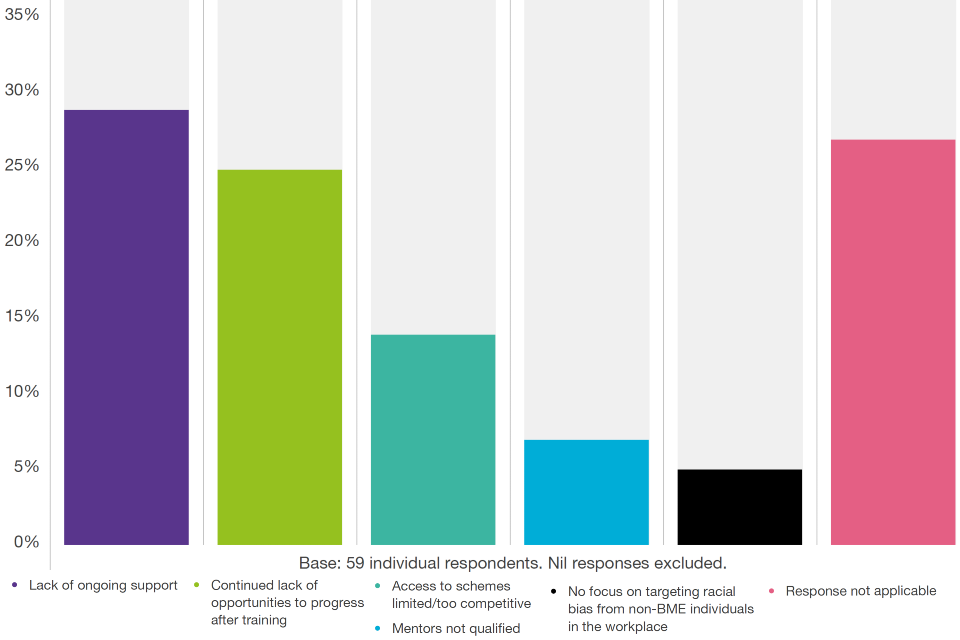
""
| “What were the least beneficial aspects of schemes or programmes available in your workplace?” | Proportion of individual respondents |
|---|---|
| Lack of on-going support | 29% |
| Continued lack of opportunities to progress after training | 25% |
| Access to schemes limited/too competitive | 14% |
| Mentors not qualified | 7% |
| No focus on targeting racial bias from non-BME individuals in the workplace | 5% |
| Response not applicable | 27% |
For individuals who had access to support but had not used it (see Graph 30), the main reasons reported for this were limited access and a competitive process (38%) or they did not see the benefit of taking part (24%).
Graph 30: Individual respondents, “Why have you not made use of any of the schemes available?”
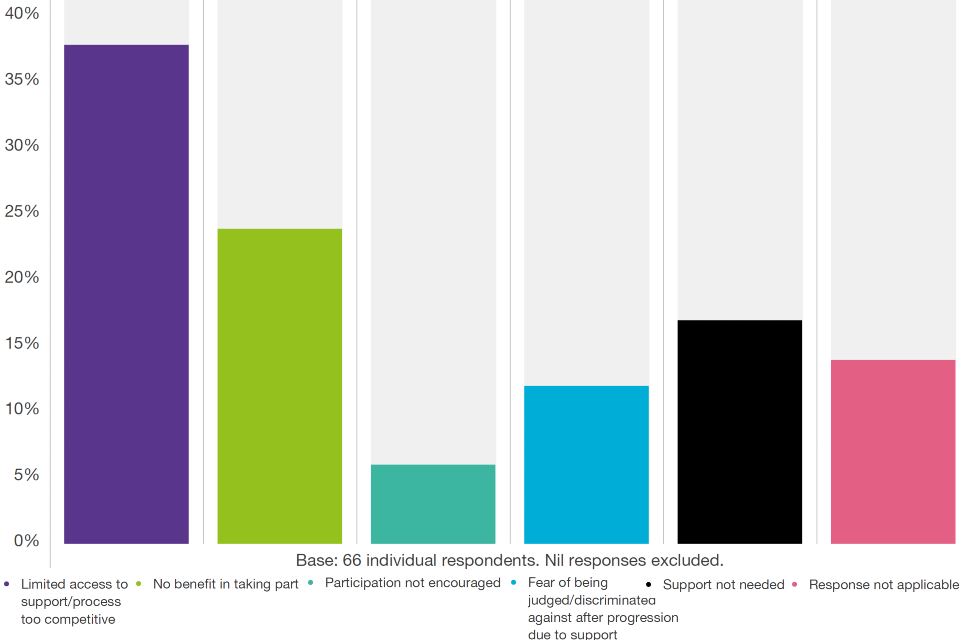
""
| “Why have you not made use of any of the schemes available?” | Proportion of individual respondents |
|---|---|
| Limited access to support/process too competitive | 38% |
| No benefit to taking part | 24% |
| Participation not encouraged | 6% |
| Fear of being judged/discriminated against after progression due to support | 12% |
| Support not needed | 17% |
| Response not applicable | 14% |
Employers and organisations had a range of views on which initiatives they felt worked best to improve the progression of BME employees, including:
- transparency in the routes to progression
- unconscious bias training which is particularly important for recruitment, assessing performance and for promotions
- transparency and objectivity at each stage of recruitment
- advertising to a wider audience and by different methods of advertising
- outreach programmes, including to universities
- internships
- targeted development programmes
- mentoring
- reverse mentoring
- targets
- using situational strengths tests in recruitment
- encouraging staff to feel more comfortable talking about race
Additionally, a number of ways to best deliver these initiatives were identified including consulting with staff beforehand to design the initiative, having visible senior leadership champions and collecting data to understand the issues, monitor progress and design measurable outcomes. Some employers also noted they had several initiatives which were interconnected and together contributed to cultural change.
Employers and organisations were asked which policies and practices they judge to have been less effective in improving BME progression at work. Consistent themes were initiatives which lacked resources, were not connected to the organisation or were not clear in their objectives. It was also mentioned that unconscious bias training which is not targeted to a particular activity (for example recruitment) is less effective. Additionally, respondents highlighted the significance of accountability, disseminating information on why the initiatives are important and ensuring that people are recognised as individuals.
Table 5 shows that over half of employers with policies in place assessed the success of these using regular data collection on staff progression and by surveying participants. Almost one-fifth of employers said they did not assess the effectiveness of these policies.
Table 5: Employer respondents “How do you assess the success of policies and practices aimed at BME individuals in your organisation?”
| “How do you assess the success of policies and practices aimed at BME individuals in your organisation?” | Proportion of employer and organisation respondents |
|---|---|
| We do not assess the effectiveness of these policies | 17% |
| Survey of participants | 54% |
| Tracking staff performance after undertaking these initiatives | 33% |
| Data collection on reduced staff turnover | 29% |
| Regular data collection on staff progression in the company | 54% |
| Other | 13% |
Base: 24 employer respondents. Multiple responses allowed and nil responses excluded.
The role for government and business
Respondents were also asked about what they thought the roles of business and government should be to support progression of BME individuals at work. Many individual respondents were of the opinion that businesses should discourage racial bias and discrimination, create equal opportunities (43%) and provide mentoring and training opportunities to individuals (31%) (see Graph 31).
Graph 31: Individual respondents, “What is the role of business in supporting the progression of BME employees in work?”
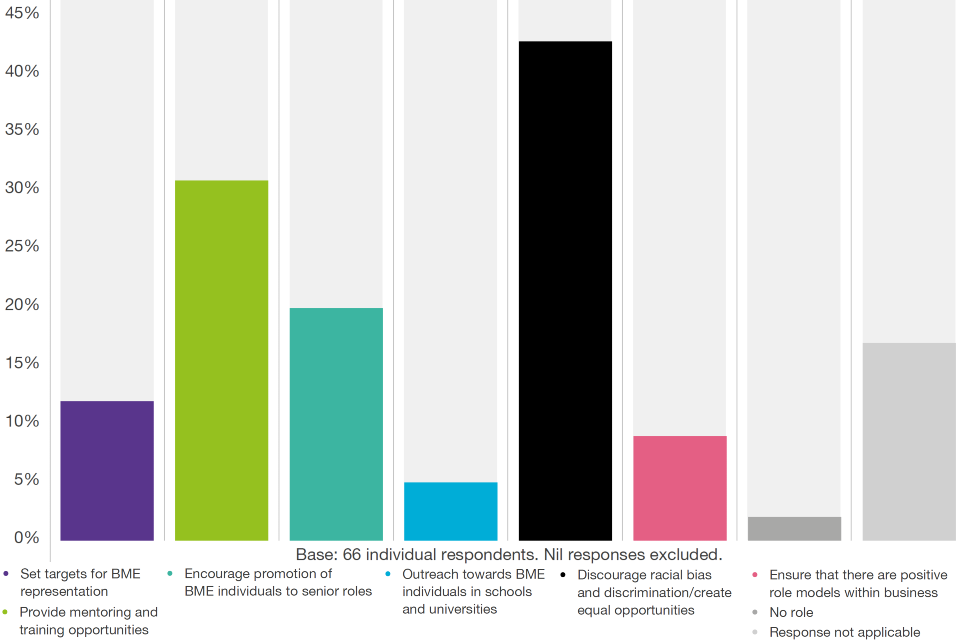
""
| “What is the role of business in supporting the progression of BME employees in work?” | Proportion of individual respondents |
|---|---|
| Set targets for BME representation | 12% |
| Provide mentoring and training opportunities | 31% |
| Encourage promotion of BME individuals to senior roles | 20% |
| Outreach towards BME individuals in schools and universities | 5% |
| Discourage racial bias and discrimination/create equal opportunities | 43% |
| Ensure that there are positive role models within business | 9% |
| No role | 2% |
| Response not applicable | 17% |
Graph 32: Employer and organisation respondents, “What is the role of business in supporting the progression of BME employees in work?”
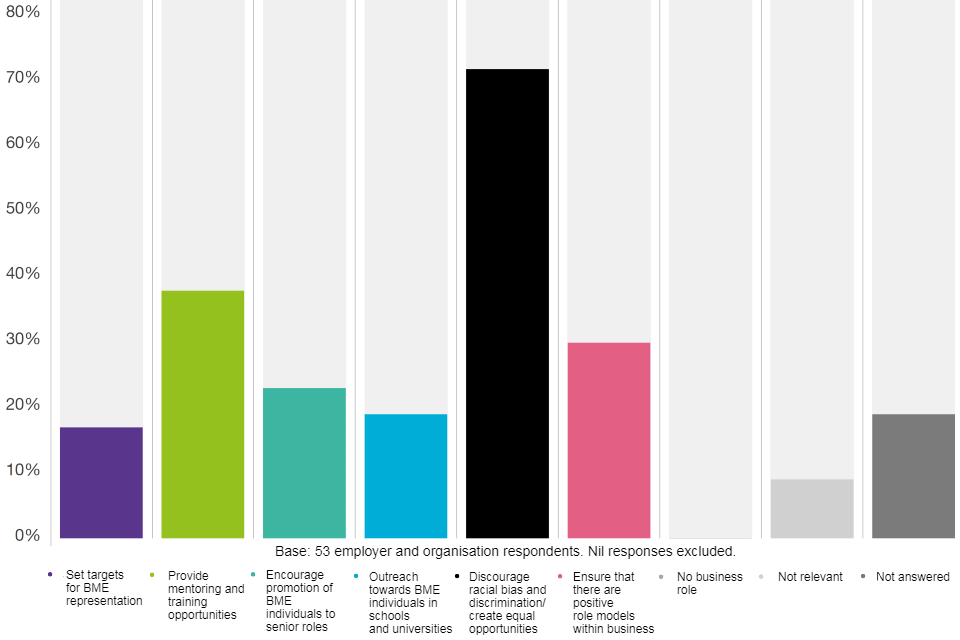
""
| “What is the role of business in supporting the progression of BME employees in work?” | Proportion of employer and organisation respondents |
|---|---|
| Set targets for BME representation | 17% |
| Provide mentoring and training opportunities | 38% |
| Encourage promotion of BME individuals to senior roles | 23% |
| Outreach towards BME individuals in schools and universities | 19% |
| Discourage racial bias and discrimination/create equal opportunities | 72% |
| Ensure that there are positive role models within business | 30% |
| No business role | 0% |
| Not relevant | 9% |
| Not answered | 19% |
There was a similar pattern of responses among employers and organisations on the role of business (see Graph 32), though the trends were more prominent with 72% of the opinion that business should discourage racial bias and discrimination, and create equal opportunities. Many also mentioned that the role of business was to provide a range of initiatives (as described in the previous section) to support BME progression at work. Additionally, some employer and organisations felt business should take responsibility for these issues and make this a priority. Several organisations noted it would be useful to share good practice on what works, ensure there is commitment and that businesses should take accountability.
Graph 33: Individual respondents, “What is the role of government in supporting the progression of BME employees in work?”
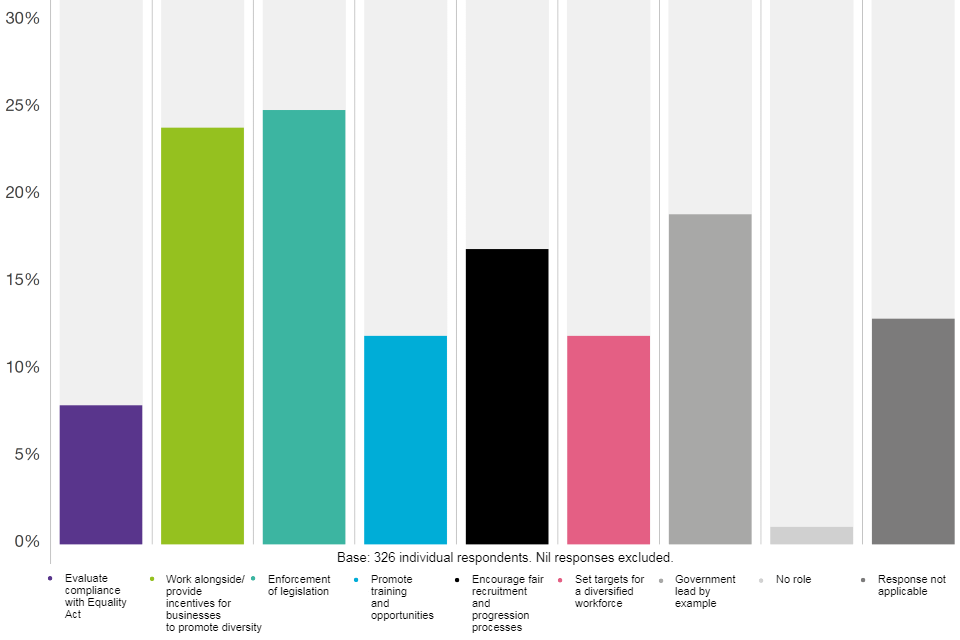
""
| “What is the role of government in supporting the progression of BME employees in work?” | Proportion of individual respondents |
|---|---|
| Evaluate compliance with Equality Act | 8% |
| Work alongside/provide incentives for businesses to promote diversity | 24% |
| Enforcement of legislation | 25% |
| Promote training and opportunities | 12% |
| Encourage fair recruitment and progression processes | 17% |
| Set targets for a diversified workforce | 12% |
| Government lead by example | 19% |
| No role | 1% |
| Response not applicable | 13% |
As Graph 33 shows when asked about the role of government to support progression of BME employees, individual respondents most commonly felt the government’s role was to ensure enforcement of the legislation (25%) and to work alongside businesses to promote diversity (24%). 19% of individual respondents thought the government should lead by example to support progression of BME employees in work.
Graph 34: Employer and organisation respondents, “What is the role of government in supporting the progression of BME employees in work?”
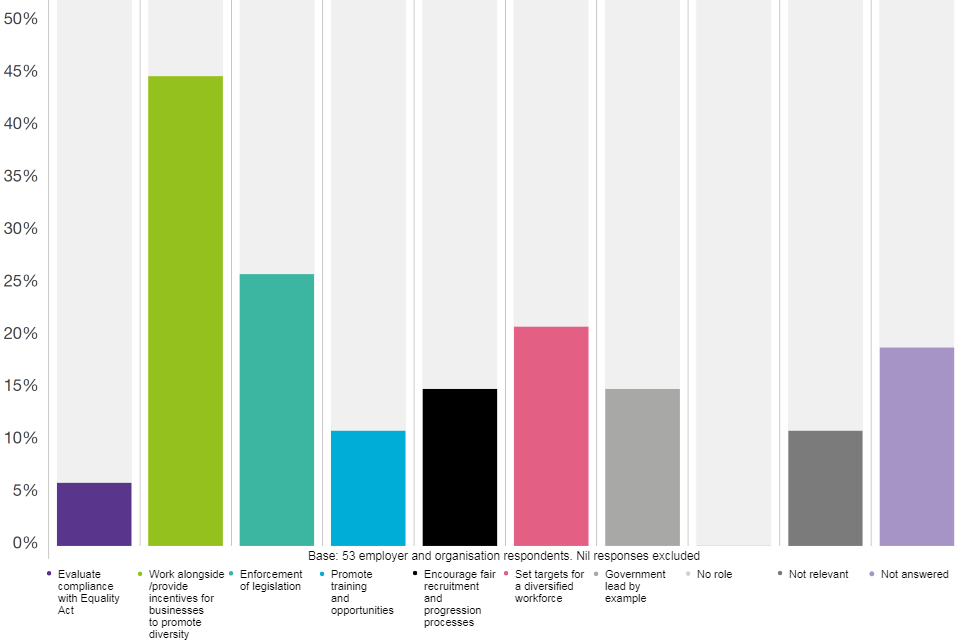
""
| “What is the role of government in supporting the progression of BME employees in work?” | Proportion of employer and organisation respondents |
|---|---|
| Evaluate compliance with Equality Act | 6% |
| Work alongside/provide incentives for businesses to promote diversity | 45% |
| Enforcement of legislation | 26% |
| Promote training and opportunities | 11% |
| Encourage fair recruitment and progression processes | 15% |
| Set targets for a diversified workforce | 21% |
| Government lead by example | 15% |
| No role | 0% |
| Not relevant | 11% |
| Not answered | 19% |
Similarly, as shown in Graph 34, 45% of employers and organisation respondents thought that the government should word alongside businesses to promote diversity, 26% felt the government’s role should be enforcement of the legislation and 21% thought there should be targets set for a diversified workforce.
Additionally, employers and organisations highlighted other areas where they considered the government could play a role. Common suggestions from employers and organisations were:
- monitoring progress over time by sector
- getting large employers to report their ethnicity data
- providing guidance to employers and sharing best practice
- developing a race equality strategy;
- taking an active role in promoting race equality and showing commitment to this in a similar way to the increased awareness of gender equality
- actively work with businesses, trade unions and professional bodies
- promoting transparency in recruitment and promotion processes
- considering locally based solutions and engaging with local partners
- setting targets to increase diversity and monitoring progress on these
- considering the role of education and the importance of provision of quality careers advice
- using public procurement contracts to promote race equality
e. Roundtable summary and acknowledgements
As part of this review, I chaired a number of roundtable discussions with over 100 employers, organisations and individuals across the UK. I would like to thank all those who attended, many of whom had significant experience of the issues I was examining. At each of these we engaged in really constructive debates covering a number of important themes. Many of these themes and examples of best practice have already fed through to my recommendations. However, below is some additional context on some of those discussions.
Barriers faced by BME individuals
Some of the key issues identified during the roundtable discussions were:
- racial discrimination
- unconscious and conscious bias
- lack of role models, mentors and sponsors in very senior roles at board level
- lack of social or professional networks
- language (nuances and office banter)
- stereotypical perceptions of BME groups
- lack of transparency of pathways into employment
- lack of understanding of cultural differences in various ethnic groups
Obstacles to progression
There was general agreement that the whole recruitment process tended to act as a barrier for certain groups. This included the wording of the job adverts, selection and search criteria, lack of diverse shortlists, lack of diversity on interview panels and the placement of job adverts in routes that may not be visible to some BME groups. It was clear that many companies were still using legacy systems and processes that inadvertently acted as a barrier to some groups. This could include entry requirements that are of less relevance today – such as particular classes of degree from specific institutions. Some attendees suggested using a name-blind recruitment process. However, this received mixed responses and some felt the process could never be truly name-blind, leading to issues during the interview process. A number of attendees also cited concerns with those industries that relied on informal contacts and unpaid internships to open doors.
Issues were also identified in the wider performance management system with ethnic minorities more likely to be judged to have poor performance. Likewise, those from BME background were generally felt to be on the wrong end of disciplinary proceedings more often. In combination with the barriers faced during the recruitment and promotion stages of an individual’s career, this could be a major driver in why many of these inequalities persist.
Data and aspirational targets
Attendees discussed the role of quotas and aspirational targets. Many felt uncomfortable with quotas as these could be resented – everyone should feel they have been recruited based on their abilities and not to meet a pre agreed quota. However, they were more open to the idea of aspirational targets that employers could work towards. The massive variation between the life experiences of different ethnic groups means it is essential that employers should collect and publish data on the ethnic breakdown of their workforce to ensure that meaningful targets can be set, and more importantly, measured. It was agreed that targets should reflect local demographics and could be set locally by those parts of the company expected to deliver them.
2 main issues were raised on capturing data. The first related to legacy HR systems that either were not able to capture the relevant information or had not done so in the past. The second was non-disclosure by employees which was an issue for many companies. Some believe this was because of suspicions about how the information would be used, although it was noted that some organisations had had more success through proactive encouragement and persistence. Age was also a factor with young people more likely to report their race. Attendees also discussed the benefits of capturing details of worker qualifications to see whether there were opportunities for the company from underutilised talent.
It was generally agreed that employers should be more open with their data. Many employers suggested the government should consider what reporting requirements currently existed with a view to streamlining them so that ethnicity data could be added without additional net burden. It was acknowledged that the current picture was not great, but as a starting point employers should have a baseline against which progress was possible and measurable.
Employer practices and policies
Where networks had been given a meaningful role within an organisation, with senior level buy in, they had generally been more successful in creating more inclusive and diverse workforces. When combined with an effective mentoring and/or sponsorship programme, BME employers had seen a huge benefit.
It was clear that a lot of great work was going on but that there was no single repository to share this good practice. If senior executives could see some of this success, they might be encouraged to focus more on intervention – rather than focusing on gender, where meaningful improvements were being seen. A central portal where employers and individuals can share successful, positive action stories about what works well, would be helpful.
Although not within the remit of the review, it was agreed that boards should reflect the make-up of their workforce – dealing with the issues faced by many companies in addressing the ‘classic BME pyramid’ where BME representation tends to gravitate towards the bottom end of the workforce. Race and ethnicity issues should sit on the boards’ agenda. One of the main barriers for executive buy-in was the preference for the status quo; if everyone in an organisation takes diversity seriously, it will naturally become a priority for the board. However, for many, they are focused on delivering for their stakeholders and investors, who rarely challenged levels of diversity. It was agreed that organisations should have diversity champions, and trade unions could play a greater role as an investor in holding company directors to account on diversity issues.
Attendees felt that a number of initiatives and policy changes had improved outcomes for BME groups. A number of large employers had removed the UCAS point requirement in their recruitment processes, ensuring more than just academic attainment was judged. A number of employers had also benefited from the new Higher Apprenticeship which attracted certain ethnic groups to their organisation.
Acknowledgements
During the course of this review I have been able to discuss these issues with a range of very knowledgeable individuals and organisations. I would like to specifically thank Frances O’Grady of the TUC, Carolyn Fairbairn of the CBI, Sir John Parker, Yvonne Coghill and Sandra Kerr for their time as well as all the Peers who spoke during the debate in the House of Lords. I would also like to thank the CBI, the REC, the ICAEW, the Mayor of Bristol and officials of the Scotland Office for helping to organise some of these roundtables with interested individuals. I would like to extend my thanks to Damian Walters, Regional Director North West and Deborah Waddell, Regional Director South West of CBI Manchester. I would also like to extend a huge thanks to Suzanne Baxter, Erica Lockhart, Tori Ainsworth and the secretariat at the Department for Business, Energy and Industrial Strategy who were instrumental in helping conduct this review.
Roundtable attendees
Business:
- BAE Systems: Dr Deborah Allen, Managing Director Corporate Responsibility
- EDF: Fiona Jackson, Head of Strategic Inclusion
- Lloyds Bank: Dianne Keith, Head of Inclusion & Diversity
- National Grid: Ed Syson, co-Chair of UK ONE network
- Sky: Jo Lewis, Director of People Experience
- Vodafone: Tom Marks, Head of HR Business Partnering
- RSA: Amanda Birkett, Head of Talent and Capability
- Shell: Bhavesh Ganesh, Senior HR manager
Third Sector:
- African Caribbean Diversity: Brenda King
- Joseph Rowntree Foundation: Emma Stone, Director of Policy and Research. Supported by Debbie Weekes-Bernard
- Operation Black Vote: Simon Wooley
- Runnymede Trust: Farah Elahi
- The Wellcome Trust: Lauren Couch, Head of Diversity and Inclusion
- University of Bradford: Nelarine Cornelius
- London Business School: Dr Raina Brands, Assistant Professor
- Social Enterprise UK: James Butler
- Black Training and Enterprise Group (BTEG): Jeremy Crook
- Association for Black Engineers UK: Nike Folayan
Trade Bodies Roundtable:
- Trades Union Congress: Alice Hood, Head of Equality and Strategy
- Confederation of British Industry: Neil Carberry, Director,
- Employment, Skills & Public Services
- Chartered Institute of Personnel Development: Laura Harrison, Strategy Director
- Advisory, Conciliation and Advisory Service: Steve Williams, Head of Equality
- Institute of Directors: Andy Silvester, Head of Campaigns
- Recruitment and Employment Confederation: Tom Hadley, Director of Policy and Professional Services
- Association of Chief Executives of Voluntary Organisations: Asheem Singh, CEO
Scotland:
- Brodies: Tony Hadden, Partner and Head of our Employment Team
- Standard Life: Heather Inglis, Diversity & Inclusion Manager
- Scottish Chambers of Commerce: Charandeep Singh, Head of External Relations
- CBI Scotland: Sam Fernando, Keela
- RBS: Talia Alexander, RBS Inclusion
Millennial BME Group:
- Mitie: Paras Bhamra, Apprentice
- Mitie: Gerisio Diaz De Oliveira, Apprentice
- Mitie: Jadene Maher, Apprentice
- Mitie: Abrar Hussain, Apprentice & also part of the Mitie
- Foundation R2W Scheme
- Mitie: Courtney Maher, Apprentice
- Mitie: Modupe Adefala, IFM Manager of Religious Affairs & recent finalist for the Excellence in Diversity Awards.
- Mitie: Jadesola Somoye, MiHomecare
- Mitie: Nash Bimfugila, Comms
- Mitie: Anwaar Bent
- Mitie: Hollie Williams-Hill
- Youth programmes Officer Hackney CVS: Deji Adeoshun
- Diversity Adviser, Business in the community: Maria Petnga-Wallace
Bristol Mayor’s Roundtable BME2020:
- West of England: Adam Powell
- Bristol City Council: Alison Comley
- Bristol City Council: Adfzal Shah
- Ann Marie Consulting: Annmarie Dixon-Barrow
- EE: Anton Richardson
- Bristol City Council: Asher Craig
- Professional Advisor: Christine Bamford
- Bristol City Council: Cherene Whitfield
- KPMG: Claire Warnes
- City of Bristol College: Cliff Shaw
- Bristol City Council: Carole Johnson
- Avon & Somerset Police: Esther Wride
- Bristol City Council: James Brereton
- Business West: James Durie
- Local Enterprise Partnership: Kalpna Woolf
- Engine Shed: Karen Shed
- Department for Work & Pensions: Karen Richards
- University of the West of England: Marie-Annich Gournet
- Gregg Latham Solicitors: Martino Burgess
- Bristol Mayor: Marvin Rees
- Well Spring Healthy Living Centre: Monira Chowdhury
- Antal: Naush Akram
- Bristol Energy: Peter Haigh
- Bristol University: Nishan Canagarajah
- Moon Consulting: Peaches Golding
- Babassa Youth Empowerment: Poku Pipim Osei
- Avon & Somerset Police: Rebecca Hehir
- Graduate: Reuben AyoEko
- South Western Ambulance Service: Sam Fraser
- Bristol City Council: Simon Nelson
- University of the West of England: Steven Neill
- NHS: Tracie Jolliff
- Stand Aaginst Racist Incidents: Veron Dowdy
- Bristol City Council: Tanya Edwards
- Bristol City Council: Kurt James
- Bristol City Council: Anne James
- Bristol City Council: Darren Perkins
- Bristol & Bath Regional Capital CIC: Edward Rowberry
- Avon & Somerset Police: Jenny Farman
- Mitie, Group Finance Director: Suzanne Baxter
- University of the West of England: Ann De Graffjohnson
- Bristol City Council: Shahzia Daya
- Avon & Somerset Police: Catherine Dodsworth
- Student: Delano Gournet-Moore
- Bristol Learning City: Sian Rees
- University of the West of England: Ahmd Emara
- Business West: Amie Vaughan
- Bristol City Council: Gillian Douglas
Recruitment & Employment Confederation Roundtable:
- Hopkins Longworth: Sarah Hopkins, Director
- Diversity Market Place: Gamiel Yafai, Diversity & Inclusion Strategist
- Equal Approach: Pamela Brown, Head of Business Development
- STR Limited: Kwabena Amaning, Recruitment Manager
- Morgan Spencer: Margaret George, Managing Director
- Randsted: Chrissi Evans, Legal Director
- PRM Diversity Consultants: Harish Bhayani, senior Partner
- ICS UK: Gary Taylor, Strategic Partnership Director
- Clear Company: Sarah Sanders, Head of Client Services
- Diversity Jobs: Neermal Doolub, Senior Manager
- Taylor Bennett: Heather McGregor, Managing Director
- Prospect Us: Stella Pederson, Head of Research
- Thewlis Graham: Sarah Thewlis, Managing Director
- BD Consult: Rahul Gupta, Director
- Fidelio Partners: Luke Main, Research Associate
- Green Park: Amir Kabel, Head of Diversity & Inclusion
ICAEW Roundtable:
- ICAEW: Hilary Lindsey, President
- ICAEW: Harpreet Panesar, Business Manager
- National Black Women’s Network: Sonia Brown MBE, Founder and Director
- RBS: James Gardiner, Head of SME External Affairs
- Entrepreneur & Business Angel: Helen C Stevens
- EY: Tim Revett, Mentoring Manager
- BBA: Tina Mason, Associate Director, Diversity and Inclusiveness
- ICAEW: Stephen Ibbotson, Director Business and Commercial
- RBS: Heather Melville, Director of Strategic Partnerships
- Barclays: Jagdeep Rai, Director, Head of Business and Corporate Banking
- KPMG: Melanie Richards, Vice Chair
- Policy Exchange: Richard Norrie
- University of Essex: Shamit Saggar, Director of the Understanding Society Policy Unit and Professor of Public Policy
- ICAEW: Sharron Gunn, Executive Director, Commercial, Members & Shared Services
- ActionAid: Margaret Casely-Hayford, Chair
- PHD Student, London School of Economics & Political Science: Jonathan Ashong Lamptey
- Advanced Track Outsourcing: Vipul Sheth, Managing Director
- Rolls-Royce: George Acquah, Internal Audit Manager
- ICAEW: Nick Parker, Deputy President
- Royal Institution of Chartered Surveyors: Lucile Kamar, Equalities Manager
BME Media:
- African Voice: Mike Abiola
- African Voice: Gold John
- African Voice: Peter Olorunnisomo
- Redhotcurry: Lopa Patel
- Buzzfeed: Elizabeth Pears
- Eastern Eye: Rithika Siddhartha
- Londra Gazete: Onur Uz
f. BME working age population by city
| Major town and city | Total population | % BME |
|---|---|---|
| Barnsley | 59,800 | 4.0% |
| Basildon | 62,700 | 14.8% |
| Basingstoke | 71,500 | 20.8% |
| Bath | 66,400 | 8.3% |
| Bedford | 48,600 | 21.2% |
| Birkenhead | 54,900 | 2.6% |
| Birmingham | 718,100 | 40.0% |
| Blackburn | 73,600 | 37.5% |
| Blackpool | 90,400 | 1.4% |
| Bolton | 102,500 | 22.9% |
| Bournemouth | 129,800 | 7.4% |
| Bracknell | 54,500 | 9.7% |
| Bradford | 207,400 | 38.2% |
| Brighton and Hove | 170,900 | 10.9% |
| Bristol | 369,700 | 11.5% |
| Burnley | 52,800 | 8.1% |
| Burton upon Trent | 47,300 | 4.7% |
| Bury | 45,000 | 19.6% |
| Cambridge | 108,500 | 17.5% |
| Cardiff | 229,200 | 15.2% |
| Carlisle | 45,900 | 3.5% |
| Chatham | 58,100 | 12.0% |
| Chelmsford | 75,600 | 13.9% |
| Cheltenham | 71,400 | 9.4% |
| Chester | 57,400 | 1.7% |
| Chesterfield | 54,400 | 5.1% |
| Colchester | 75,400 | 11.7% |
| Coventry | 228,100 | 27.4% |
| Crawley | 72,200 | 14.0% |
| Darlington | 57,400 | 5.1% |
| Derby | 161,500 | 18.3% |
| Doncaster | 67,000 | 5.1% |
| Dudley | 45,900 | 26.4% |
| Eastbourne | 65,000 | 4.6% |
| Exeter | 81,000 | 7.7% |
| Gateshead | 73,100 | 6.0% |
| Gillingham | 67,500 | 8.9% |
| Gloucester | 89,100 | 11.9% |
| Grimsby | 53,200 | 2.6% |
| Guildford | 53,700 | 17.5% |
| Halifax | 51,300 | 18.3% |
| Harlow | 54,400 | 14.0% |
| Harrogate | 42,800 | 3.7% |
| Hartlepool | 56,000 | 2.9% |
| Hastings | 57,600 | 2.3% |
| Hemel Hempstead | 63,500 | 14.0% |
| High Wycombe | 65,800 | 31.6% |
| Huddersfield | 116,200 | 26.1% |
| Ipswich | 88,200 | 13.4% |
| Kingston upon Hull | 184,700 | 6.7% |
| Leeds | 320,000 | 21.4% |
| Leicester | 260,200 | 45.2% |
| Lincoln | 70,600 | 3.3% |
| Liverpool | 372,000 | 11.9% |
| London | 5,842,800 | 40.6% |
| Luton | 143,600 | 43.0% |
| Maidstone | 79,700 | 11.9% |
| Manchester | 371,500 | 35.0% |
| Mansfield | 54,500 | 5.0% |
| Middlesbrough | 108,900 | 11.2% |
| Milton Keynes | 117,400 | 23.6% |
| Newcastle upon Tyne | 191,600 | 15.1% |
| Newcastle-under-Lyme | 49,300 | 6.3% |
| Newport | 76,100 | 12.1% |
| Northampton | 144,100 | 9.8% |
| Norwich | 121,300 | 7.1% |
| Nottingham | 202,200 | 24.1% |
| Nuneaton | 57,600 | 8.5% |
| Oldham | 64,600 | 42.0% |
| Oxford | 120,700 | 20.5% |
| Peterborough | 108,400 | 16.9% |
| Plymouth | 171,100 | 5.4% |
| Poole | 95,600 | 3.1% |
| Portsmouth | 144,300 | 9.9% |
| Preston | 87,200 | 19.0% |
| Reading | 170,600 | 20.5% |
| Redditch | 54,400 | 11.0% |
| Rochdale | 72,500 | 35.6% |
| Rotherham | 67,400 | 13.9% |
| Salford | 60,600 | 23.9% |
| Scunthorpe | 50,100 | 4.4% |
| Sheffield | 335,900 | 16.1% |
| Shrewsbury | 45,400 | 2.6% |
| Slough | 97,900 | 50.3% |
| Solihull | 64,900 | 18.2% |
| South Shields | 46,700 | 6.4% |
| Southampton | 176,400 | 9.9% |
| Southend-on-Sea | 114,200 | 6.2% |
| Southport | 51,200 | 2.9% |
| St Albans | 55,100 | 8.9% |
| St Helens | 61,600 | 1.6% |
| Stevenage | 61,800 | 8.7% |
| Stockport | 67,300 | 7.1% |
| Stockton-on-Tees | 51,700 | 6.6% |
| Stoke-on-Trent | 168,400 | 16.2% |
| Sunderland | 111,800 | 7.2% |
| Sutton Coldfield | 57,900 | 10.9% |
| Swansea | 114,700 | 9.2% |
| Swindon | 122,300 | 15.6% |
| Telford | 91,000 | 8.6% |
| Wakefield | 67,200 | 16.8% |
| Walsall | 42,100 | 53.9% |
| Warrington | 112,100 | 6.7% |
| Watford | 96,100 | 23.8% |
| West Bromwich | 43,700 | 39.4% |
| Weston-Super-Mare | 42,700 | 4.0% |
| Wigan | 52,100 | 6.9% |
| Woking | 65,700 | 8.8% |
| Wolverhampton | 150,700 | 28.6% |
| Worcester | 67,300 | 3.0% |
| Worthing | 64,300 | 5.4% |
| York | 108,800 | 8.1% |
| Column total | 17,757,600 | 25.2% |
Data has been reweighted in line with the July 2016 ONS population estimates.
The major towns and cities geography has been released as ‘experimental’. This mechanism allows time for ONS to assess the response from the user community, both about its usefulness for analysis and its definitional accuracy.
g. References
-
BEIS Analysis (2016): ‘BME individuals in the labour market: analysis of full representation’ ↩
-
Business in the Community (2015): ‘Race at Work 2015’ ↩
-
Department for Work and Pensions (2015): ‘Labour Market Status by Ethnic Group’ ↩
-
TUC (2016): ‘BAME Workers a Third More Likely to be Underemployed’ ↩
-
Joseph Rowntree Foundation (2015): ‘Supporting Ethnic Minority Young People from Education into Work’ ↩
-
McKinsey (2015): ‘Why Diversity Matters’ ↩
-
ONS (2016): Annual Population Survey ↩
-
Wohland et al. (2010): ‘Ethnic Population Projections for the UK and Local Areas, 2001-2051’ ↩
-
Joseph Rowntree Foundation (2015): ‘Entry to, and Progression in, Work’ ↩
-
Joseph Rowntree Foundation (2015): ‘Ethnic Minority Disadvantage in the Labour Market’ ↩
-
BEIS analysis (2016) see literature review ↩
-
Business in the Community (2015): ‘Race at Work 2015’ ↩
-
Business in the Community (2014): ’Benchmarking 2014 Analysis and Top Ten Analysis’ ↩
-
Joseph Rowntree Foundation (2015): ‘Entry to, and Progression in, Work’ ↩
-
Levels were self-reported through a YouGov panel survey of over 6,000 respondents and a public open survey of over 18,000 respondents. ↩
-
BEIS Analysis (2016): ‘BME individuals in the labour market: analysis of full representation’ ↩
-
More information on the US approach can be found on the US Equal Employment Opportunity Commission website ↩
-
Positive action: when an employer takes steps to help or encourage groups of people with different needs or who are in some way disadvantaged. ↩
-
Business in the Community (2014): ’Benchmarking 2014 Analysis and Top Ten Analysis’ ↩
-
ONS (2012): ‘Ethnicity and National Identity in England and Wales: 2011’ ↩
-
Wohland et al. (2010): ‘Ethnic Population Projections for the UK and Local Areas, 2001-2051’ ↩
-
ONS (2012): ‘Ethnicity and National Identity in England and Wales: 2011’ ↩
-
Joseph Rowntree Foundation (2013): ‘What makes Ethnic Group Populations Grow? Age Structures and Immigration’ ↩
-
Wohland et al. (2010): ‘Ethnic Population Projections for the UK and Local Areas, 2001-2051’ ↩
-
Department for Work and Pensions (2016): ‘Labour Market Status by Ethnic Group Statistics’ ↩
-
Joseph Rowntree Foundation (2015): ‘Entry to, and Progression in, Work’ ↩
-
BEIS analysis of ONS Labour Force Survey, 2016 Quarter 1 ↩
-
Department for Work and Pensions (2016): ‘Labour Market Status by Ethnic Group Statistics’ ↩
-
Department for Work and Pensions (2016): ‘Labour Market Status by Ethnic Group Statistics’ ↩
-
Department for Work and Pensions (2016): ‘Labour Market Status by Ethnic Group Statistics’ ↩
-
Joseph Rowntree Foundation (2015): ‘Ethnic Minority Disadvantage in the Labour Market’ ↩
-
Joseph Rowntree Foundation (2015): ‘Projecting Employment by Ethnic Group to 2022’. ↩
-
Department for Work and Pensions (2016): ‘Labour Market Status by Ethnic Group Statistics’ ↩
-
Department for Work and Pensions (2016): ‘Labour Market Status by Ethnic Group Statistics’ ↩
-
Department for Work and Pensions (2016): ‘Labour Market Status by Ethnic Group Statistics’ ↩
-
BEIS analysis of ONS Labour Force Survey, 2016 Quarter 1 ↩
-
Khoudja et al. (2016): ‘Labour Market Exits and Entries of Women from different Origin Countries in the UK’ ↩
-
BEIS analysis of ONS Labour Force Survey, 2016 Quarter 1 ↩
-
Joseph Rowntree Foundation (2015): ‘Entry to, and Progression in, Work’ ↩
-
Joseph Rowntree Foundation (2015): ‘The Effect of Occupation on Poverty among Ethnic Minority Groups’ ↩
-
BEIS analysis of ONS Labour Force Survey, 2016 Quarter 1 ↩
-
BEIS analysis of ONS Labour Force Survey, 2016 Quarter 1 ↩
-
Joseph Rowntree Foundation (2015): ‘Ethnic Minority Disadvantage in the Labour Market’ ↩
-
Brynin and Gueveli (2016): ‘Understanding the Ethnic Pay Gap in Britain’, Work, Employment and Society, 26(4). ↩
-
Joseph Rowntree Foundation (2015): ‘Ethnic Minority Disadvantage in the Labour Market’ ↩
-
BEIS analysis of ONS Labour Force Survey, 2016 Quarter 1 ↩
-
Joseph Rowntree Foundation (2015): ‘Projecting Employment by Ethnic Group to 2022’. ↩
-
Based on work by Ken Clark, University of Manchester. The x-axis gives the cut-off wages that result from decomposing the wage distribution of the White population into 10 equal parts, meaning 10% of White workers earn wages in the first decile. The y-axis denotes the percentages of an ethnic group located in those same wage percentiles. If the wage distributions of ethnic minority and White workers were exactly equal, then 10% of minority workers would be located in each wage percentile, and the purple bars would match the mauve box. ↩
-
BEIS analysis of ONS Labour Force Survey, all quarters 2011-2015 ↩
-
BEIS analysis of ONS Labour Force Survey, all quarters 2011-2015 ↩
-
BEIS analysis of ONS Labour Force Survey, all quarters 2011-2015 ↩
-
BEIS analysis of ONS Labour Force Survey, all quarters 2011-2015 ↩
-
The category for ‘higher education’ in this graph is based on the ONS definition. It includes qualifications above A-level standard or equivalent, and qualifications below degree level. ↩
-
BEIS analysis of ONS Labour Force Survey, 2016 Quarter 1 ↩
-
Joseph Rowntree Foundation (2015): ‘Entry to, and Progression in, Work’ ↩
-
Joseph Rowntree Foundation (2015): ‘Supporting Ethnic Minority Young People from Education into Work’ ↩
-
Business in the Community (2015): ‘Race at Work 2015’ ↩
-
Joseph Rowntree Foundation (2015): ‘Entry to, and Progression in, Work’ ↩
-
Business in the Community (2014): ’Benchmarking 2014 Analysis and Top Ten Organisations’ ↩
-
Business in the Community (2014): ’Benchmarking 2014 Analysis and Top Ten Organisations’ ↩
-
Levels were self-reported through a YouGov panel survey of over 6,000 respondents and a public open survey of over 18,000 respondents. ↩
-
Business in the Community (2014): ’Benchmarking 2014 Analysis and Top Ten Organisations’ ↩
-
Joseph Rowntree Foundation (2015): ‘Entry to, and Progression in, Work’ ↩
-
Business in the Community (2014): ‘Race at the Top: A review of BAME Leadership in the UK’ ↩
-
House of Commons Library (2016): ‘Ethnic Minorities in Politics and Public Life ↩
-
General Medical Council (2016): ‘Independent research for the GMC shows ethnicity still a factor in future doctors’ prospects’ ↩
-
Green Park (2015): ‘The Green Park Leadership 10,000’ ↩
-
Third sector (2014): ‘Diversity: The Deficit at the Top of the Biggest Charities’ ↩
-
UCAS (2016): ‘Data and Analysis’ ↩
-
BIS (2014): ‘National Strategy for Access and Student Success in Higher Education’ ↩
-
HEFCE (2015): ‘Differences in Employment Outcomes: Equality and Diversity Characteristics’ ↩
-
TUC (2016): ‘Black, Qualified and Unemployed’ ↩
-
Crawford and Greaves (2015): ‘Ethnic Minorities Substantially More Likely to go to University than their White British Peers’ ↩
-
UCAS 2015: ‘Analysis Note 2015/05’ ↩
-
UCAS (2016): ‘Data and Analysis’ ↩
-
UCAS (2016): ‘Data and Analysis’ ↩
-
BIS (2014): ‘National Strategy for Access and Student Success in Higher Education’ ↩
-
HEFCE (2016): ‘Non-continuation Rates: Trends and Profiles’ ↩
-
HEFCE (2015): ‘Differences in Degree Outcomes: The Effect of Subject and Student Characteristics ↩
-
The proportion of qualifiers employed in professional and managerial roles. ↩
-
HEFCE (2015): ‘Differences in Employment Outcomes: Equality and Diversity Characteristics ↩
-
Business in the Community (2014): ’Benchmarking 2014 Analysis and Top Ten Analysis’ ↩
-
Zwysen and Longhi (2016): ‘Labour Market Disadvantage of Ethnic Minority British Graduates: University Choice, Parental Background or Neighbourhood?’ ↩
-
TUC (2016): ‘Black Workers with Degrees Earn a Quarter Less than White Counterparts, Finds TUC’ ↩
-
TUC (2016): ‘BAME Workers with Degrees Two and a Half Times More Likely to be Unemployed, Finds TUC’ ↩
-
TUC (2016): ‘Black, Qualified and Unemployed’ ↩
-
Centre on Dynamics of Ethnicity (2013): ‘Addressing Ethnic Inequalities in Social Mobility’ ↩
-
Longhi et al. (2013): ‘Explained and Unexplained Wage Gaps across the Main Ethno-religious Groups in Great Britain’ ↩
-
Centre on Dynamics of Ethnicity (2013): ‘Addressing Ethnic Inequalities in Social Mobility’ ↩
-
Longhi et al. (2013): ‘Explained and Unexplained Wage Gaps across the Main Ethno-religious Groups in Great Britain’ ↩
-
Heath and Li (2008): ‘Period, Life-cycle and Generational Effects on Ethnic Minority Success in the British Labour Market’ ↩
-
OECD (2007): ‘Human Capital: How What You Know Shapes Your Life’ ↩
-
Joseph Rowntree Foundation (2015): ‘Reducing Poverty by Promoting More Diverse Social Networks for Disadvantaged People from Ethnic Minority Groups’ ↩
-
Knies et al. (2016): ‘Life Satisfaction, Ethnicity and Neighbourhoods: Is There an Effect of Neighbourhood Ethnic Composition on Life Satisfaction?’ ↩
-
Joseph Rowntree Foundation (2015): ‘How are Poverty, Ethnicity and Social Networks Related?’ ↩
-
Kanter (1977): ‘Men and Women of the Corporation’. USA: Basic Books ↩
-
Baldi and McBrier (1997): ‘Do the Determinants of Promotion Differ for Blacks and Whites?’. Work and Occupations, volume 24, pages 478-497 ↩
-
Froy, F. and L. Pyne (2011), ‘Ensuring Labour Market Success for Ethnic Minority and Immigrant Youth’, OECD, Local Economic and Employment Development (LEED) Working Papers, 2011/09, OECD Publishing. ↩
-
Patacchini et al. (2008): ‘Ethnic Networks and Employment Outcomes’ ↩
-
BEIS Analysis (2017) – ‘BME individuals in the labour market: analysis of full representation’ ↩
-
Business in the Community (2015): ‘Benchmark Survey 2014 Trends Analysis – Strategy and Business Case’ ↩
-
Joseph Rowntree Foundation (2015): ‘Entry to, and Progression in, Work’ ↩
-
Business in the Community (2015): ‘Benchmark Survey 2014 Trends Analysis – Strategy and Business Case’ ↩
-
Runnymede Trust (2010): ‘Snowy Peaks:– Ethnic Diversity at the Top’ ↩
-
BIS (2013): ‘The Business Case for Equality and Diversity ↩
-
ONS (2016): Annual Population Survey ↩
-
Runnymede Trust (2010): ‘Snowy Peaks:– Ethnic Diversity at the Top’ ↩
-
Institute for Employment Studies (2014): ‘Diversity at Senior Team and Board Level ↩
-
Kandola (2009): ‘The Value of Difference: Eliminating Bias in Organisations’. Oxford: Pearn Kandola Publishing ↩
-
BIS (2013): ‘The Business Case for Equality and Diversity ↩
-
Carter et al. (2003): ‘Corporate Governance, Board Diversity and Firm Value’. Financial Review, volume 38, issue 1, pages 33-35 ↩
-
Tatli and Özbilgin (2007): ‘Diversity Management as Calling: Sorry, it’s the Wrong Number!’, in Koall, Bruchhagen, and Höher (Eds.). Diversity Outlooks, LIT-Verlag, Münster ↩
-
McKinsey (2015): ‘Why Diversity Matters ↩
-
McKinsey (2015): ‘Why Diversity Matters ↩
-
Erhardt et al. (2003): ‘Board of Director Diversity and Firm Financial Performance’. Corporate Governance: An International Review, volume 11, pages 102-111 ↩
-
Carter et al. (2003): ‘Corporate Governance, Board Diversity, and Firm Value’. The Financial Review, volume 38, pages 33-53. ↩
-
Herring (2009): ‘Does Diversity Pay? Race, Gender and the Business Case for Diversity’ ↩
-
Roberson and Park (2006): ‘Examining the Link between Diversity and Firm Performance’ ↩
-
Heath and Li (2007): ‘Measuring the Size of the Employer Contribution to the Ethnic Minority Employment Gap’ ↩
-
Berritella (2012): ‘Modelling the Labour Market of Ethnic Minority Groups’ ↩
-
European Commission (2007): ‘Ethnic Minorities in the Labour Market’ ↩
-
Joseph Rowntree Foundation (2015): ‘Ethnicity, Poverty and Youth Employment: Improving Outcomes for Young People’ ↩
-
Abrahamsen and Drange (2015): ‘Ethnic Minority Students’ Career Expectations in Prospective Professions: Navigating between Ambitions and Discrimination’. Sociology, volume 49, pages 252-269 ↩
-
Metz, Fouad, and Ihle-Helledy (2009): ‘Career Aspirations and Expectations of College Students: Demographic and Labour Market Comparisons’. Journal of Career Assessment, volume 17, pages 155-171 ↩
-
Abrahamsen and Drange (2015): ‘Ethnic Minority Students’ Career Expectations in Prospective Professions: Navigating between Ambitions and Discrimination’. Sociology, volume 49, pages 252-269 ↩
-
Joseph Rowntree Foundation (2015): ‘Entry to, and Progression in, Work’ ↩
-
Karunanayaka and Nauta (2004): ‘The Relationship betwee Race and Students’ Identified Career Role Models and Perceived Role Model Influence’. The Career Development Quarterly, volume 52, pages 225-234 ↩
-
Gibson (2004): ‘Role Models in Career Development: New Directions for Theory and Research’. Journal of Vocational Behaviour, volume 65, pages 134-156 ↩
-
Woodcock et al. (2012): ‘The Consequences of Chronic Stereotype Threat: Domain Disidentification and Abandonment’. Journal of Personality and Social Psychology, volume 103, pages 635-646 ↩
-
Aronson and Inzlicht (2004): ‘The Ups and Downs of Attributional Ambiguity: Stereotype Vulnerability and the Academic Self-knowledge of African American College Students ↩
-
Business in the Community (2015): ‘Race at Work 2015’ ↩
-
Runnymede Trust (2010): ‘Snowy Peaks:– Ethnic Diversity at the Top’ ↩
-
National Employment Panel (2007): ‘The Business Commission on Race Equality in the Workplace ↩
-
Hooker et al. (2008): ‘Recruitment of Under-represented Groups into the Senior Civil Service’. Department for Work and Pensions Research Report No 512 ↩
-
Wood et al. (2009): ‘A Test for Racial Discrimination in Recruitment Practice in British Cities’. Research Report No 607 ↩
-
Department for Work and Pensions (2006): ‘Talk on Trial – Job interviews, language and ethnicity’ ↩
-
Modood and Wrench (2001): ‘The Effectiveness of Racial Equality Employment Policies in the UK’ ↩
-
Business in the Community (2015): ‘Race at Work 2015’ ↩
-
NHS (2016): ‘NHS Workforce Race Equality Standard’ ↩
-
Heath and Li (2007): ‘Measuring the Size of the Employer Contribution to the Ethnic Minority Employment Gap’ ↩
-
BIS (2013): ‘The Business Case for Equality and Diversity ↩
-
Resolution Foundation (2016): ‘Road to Full Employment’ ↩
-
Business in the Community (2015): ‘Race at Work 2015’ ↩
-
Li (2000): ‘The Labour Market Earnings of Minority Ethnic Groups in Great Britain and the USA (1990 – 2000) ↩
-
Li (2010): ‘The Labour Market Situation of Minority Ethnic Groups in Britain and the US’. Euramerica Vol. 40, No. 2 (June 2010), 259-309. ↩
-
Li (2000): ‘The Labour Market Earnings of Minority Ethnic Groups in Great Britain and the USA (1990 – 2000) ↩
-
Li (2010): ‘The Labour Market Situation of Minority Ethnic Groups in Britain and the US’. Euramerica Vol. 40, No. 2 (June 2010), 259-309. ↩
-
Verhaeghe et al. (2013): ‘Socio-economic and Ethnic Inequalities in Social Capital from the Family among Labour Market Entrants’ ↩
-
Oreopoulos (2011): ‘Why Do Skilled Immigrants Struggle in the Labor Market? A Field Experiment with Thirteen Thousand Resumes ↩
-
Bertrand and Mullainathan (2003): ‘Are Emily and Greg More Employable than Lakisha and Jamal? A Field Experiment on Labor Market Discrimination ↩
-
Department for Work and Pensions (2009): ‘A Test for Racial Discrimination in Recruitment Practice in British Cities ↩
-
Institute of Education (2016): ‘Why the Difference? Issues Facing Minority Ethnic Graduates’ ↩
-
Oreopoulos (2011): ‘Why Do Skilled Immigrants Struggle in the Labor Market? A Field Experiment with Thirteen Thousand Resumes ↩
-
Bertrand and Mullainathan (2003): ‘Are Emily and Greg More Employable than Lakisha and Jamal? A Field Experiment on Labor Market Discrimination’ ↩
-
Department for Work and Pensions (2009): ‘A Test for Racial Discrimination in Recruitment Practice in British Cities ↩
-
Business in the Community (2014): ’Benchmarking 2014 Analysis and Top Ten Analysis’ ↩
-
Armstrong et al. (2010): ‘The Impact of Diversity and Equality Management on Firm Performance: Beyond High Performance Work Systems’. Human Resource Management, volume 49, pages 977–998 ↩
-
Institute of Education (2016): ‘Why the Difference? Issues Facing Minority Ethnic Graduates’ ↩
-
Business in the Community (2011): ‘Race to Progress’ ↩
-
Business in the Community (2015): ‘Race at Work 2015’ ↩
-
Department for Work and Pensions (2016): ‘Labour Market Status by Ethnic Group Statistics’ ↩
-
Department for Work and Pensions (2016): ‘Labour Market Status by Ethnic Group Statistics’ ↩
-
Department for Work and Pensions (2016): ‘Labour Market Status by Ethnic Group Statistics’ ↩
-
BEIS analysis of ONS Labour Force Survey, 2016 Quarter 1 ↩
-
BEIS analysis of ONS Labour Force Survey, 2016 Quarter 1 ↩
-
BEIS analysis of ONS Labour Force Survey, 2016 Quarter 1 ↩
-
BEIS analysis of ONS Labour Force Survey, 2016 Quarter 1 ↩
-
BEIS analysis of ONS Labour Force Survey, all quarters 2011-2015 ↩
-
BEIS analysis of ONS Labour Force Survey, all quarters 2011-2015 ↩
-
BEIS analysis of ONS Labour Force Survey, all quarters 2011-2015 ↩
-
Department for Work and Pensions (2016): ‘Labour Market Status by Ethnic Group Statistics’ ↩
-
‘Higher education’ is defined by the ONS. It includes qualifications above A level standard or equivalent, and qualifications below degree level. ↩