Public spending statistics: February 2020
Published 28 February 2020

© Crown copyright 2020
This publication is licensed under the terms of the Open Government Licence v3.0 except where otherwise stated. To view this licence, visit nationalarchives.gov.uk/doc/open-government-licence/version/3 or write to the Information Policy Team, The National Archives, Kew, London TW9 4DU, or email: psi@nationalarchives.gov.uk.
Where we have identified any third party copyright information you will need to obtain permission from the copyright holders concerned.
This publication is available at https://www.gov.uk/government/statistics/public-spending-statistics-release-february-2020/public-spending-statistics-february-2020
1. About this release
This release presents updated public spending data for the years 2014-15 to 2018-19. All data in this release are National Statistics and are on an outturn basis. All data and further background detail can be found in the accompanying tables published alongside this release. We welcome any feedback at statistics-enquiries@hmtreasury.gov.uk
2. Total expenditure (£billions)
| Expenditure | 2017-18 | 2018-19 |
|---|---|---|
| Total Managed Expenditure (TME) | 834.9 | 851.3 |
| Total expenditure on services (TES) | 750.6 | 773.1 |
- TME was £851.3 billion in 2018 to 2019, an increase of 2.0% on the previous year.
- TES was £773.1 billion in 2018 to 2019, an increase of 3.0% on the previous year.
| Expenditure | 2017-18 | 2018-19 |
|---|---|---|
| Total DEL expenditure | 358.8 | 371.3 |
| Resource departmental AME | 432.9 | 244.6 |
| Total departmental expenditure | 812.8 | 628.4 |
2.1 Budgeting statistics
- Total DEL expenditure (resource DEL excluding depreciation plus capital DEL) was £371.3 billion in 2018 to 2019, an increase of £12.6 billion or 3.5% on the previous year in nominal terms.
- Total departmental expenditure (Total DEL plus resource and capital departmental AME) was £628.4 billion in 2018 to 2019, a decrease of £184.4 billion or 22.7% on the previous year. This is mainly due to a larger than normal figure for resource departmental AME in 2017 to 2018, which reflected a significant change in the accounting valuation of provisions following a change in the long-term Treasury discount rate.
- Resource departmental AME was £244.6 billion in 2018 to 2019, a decrease from £432.9 billion in 2017 to 2018. The increased resource departmental AME expenditure in 2017 to 2018 reflected a significant change in the accounting valuation of provisions as a result of changes in the long-term Treasury discount rate which inflated the present value of expected future long-term costs. The largest decrease in 2018 to 2019 was for Business, Energy and Industrial Strategy (£181 billion) which mainly reflected lower provisions for the Nuclear Decommissioning Authority (NDA). This was a non-cash charge.
3. Real terms public expenditure (£billions)
| Functions | 2017-18 | 2018-19 |
|---|---|---|
| General public services | 86.9 | 81.0 |
| Defence | 39.5 | 40.2 |
| Public order and safety | 32.1 | 32.4 |
| Economic affairs | 54.3 | 61.1 |
| Environment protection | 12.0 | 11.1 |
| Housing and community amenities | 11.6 | 12.1 |
| Health | 150.4 | 152.9 |
| Recreation, culture and religion | 11.7 | 11.4 |
| Education | 87.8 | 87.9 |
| Social protection | 274.3 | 275.1 |
3.1 Trends in functional expenditure (Tables 10, 10a and 10b)
Compared with the previous year;
- In real terms, spending on 7 of the 10 functions (not including EU transactions) increased during 2018 to 2019, whilst the remaining 3 showed a decrease.
- The largest real terms growth in expenditure in percentage terms was on economic affairs which increased by 12.4%. This was followed by housing and community amenities which grew by 4.6% and defence and health which grew by 2.0% and 1.7% on 2017 to 2018, respectively.
- The largest real terms fall in spending was in environment protection which went down by 7.8%. General public services, and recreation, culture and religion fell by 6.8% and 3.0%, respectively.
4. National Statistics
The United Kingdom Statistics Authority has designated these statistics as National Statistics, in accordance with the Statistics and Registration Service Act 2007 and signifying compliance with the Code of Practice for Official Statistics. Designation can be broadly interpreted to mean that the statistics:
- meet identified user needs
- are well explained and readily accessible
- are produced according to sound methods
- are managed impartially and objectively in the public interest
Once statistics have been designated as National Statistics it is a statutory requirement that the Code of Practice shall continue to be observed.
5. Spending frameworks used in HM Treasury spending publications
| Budgeting | Expenditure on services (TES) |
|---|---|
| This framework provides information on central government departmental budgets, which are the aggregates used by the government to plan and control expenditure. It covers departmental own spending as well as support to local government and public corporations. | This framework is used in HM Treasury publications for statistical analysis. It is based on National Accounts definitions and covers spending by the whole of the public sector. It therefore has wider coverage than the budgeting framework and is also more stable over time. |
6. Trends in public spending
6.1 Chart 1: Trends in public spending since 1997 to 1998
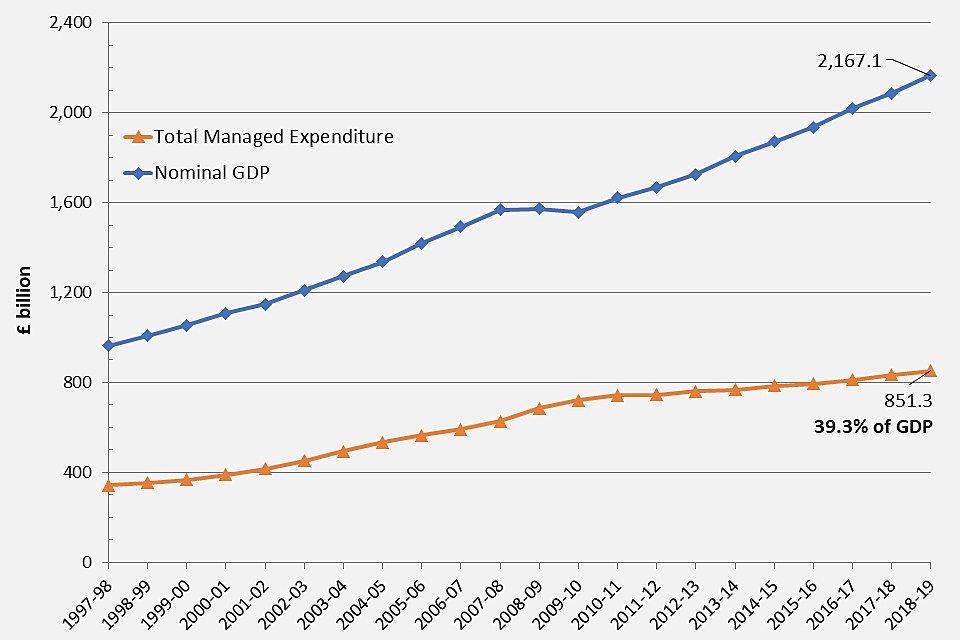
A line graph showing trends in overall spending compared with overall nominal GDP.
- During the recession, as GDP shrank but spending increased, TME took an increasingly large share of national income. As a result, TME as a percentage of GDP peaked at 46.3% in 2009 to 2010. In the subsequent years, TME as a percentage of GDP has been decreasing. In 2018 to 2019 it stood at 39.3%t of GDP (Table 10b).
- In 2018 to 2019 public expenditure on health was equal to 7.1% of GDP, compared to 4.6% in 1997 to 1998. Education spending stood at 4.0% in 1997 to 1998 compared to 4.1% of GDP in 2018 to 2019. These changes reflect a mix of demographics and the policy priorities of successive governments.
- The share of GDP taken by public sector debt interest payments was 2.6% in 2018 to 2019. This compares with a peak of 3.7% last seen in 1997 to 1998, when interest rates were significantly higher than now.
6.2 Chart 2: Real terms trends in public spending
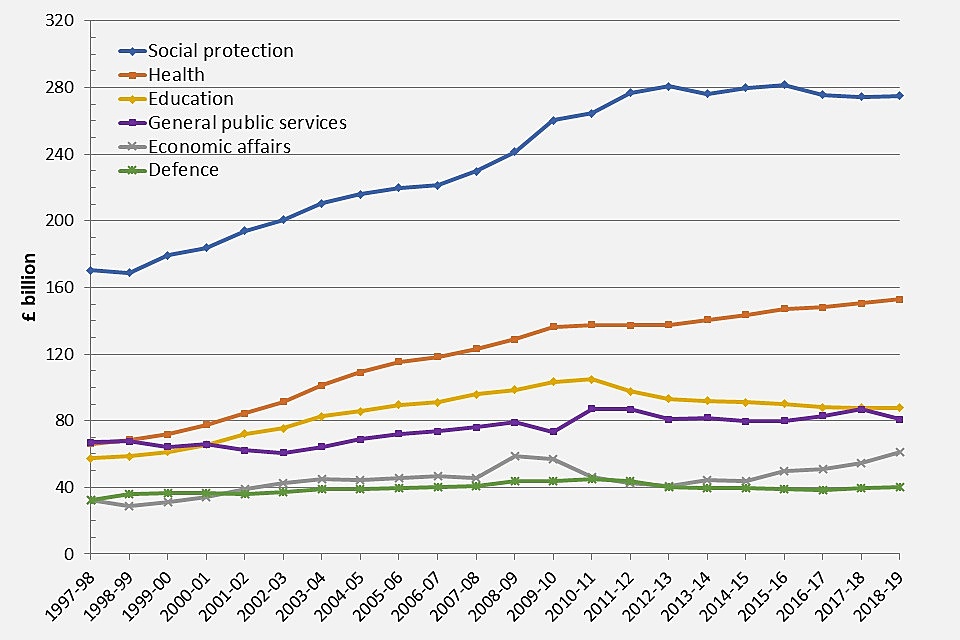
Line graph showing trends in public spending in real terms according to the UN-defined Classification of the Functions of Government (COFOG) framework.
From 2011 to 2012 onward the ‘grant-equivalent element of student loans’ is no longer part of the TES framework and has therefore been removed from the education function. Therefore figures are not directly comparable between 2010 to 2011 and 2011 to 2012. A full explanation of this decision can be found in PESA 2019 Annex E.
In real terms (that is, after adjusting for the effect of inflation):
- spending on social protection was £275.1 billion in 2018 to 2019, up from £274.3 billion in the previous year
- health spending (including spending by central government departments and devolved administrations) was £152.9 billion in 2018 to 2019, compared to £150.4 billion spent in 2017 to 2018.
7. Revisions in this release (since Nov 2019 publication)
| Expenditure | Amount (£millions) | Comments |
|---|---|---|
| Total DEL expenditure | +£230m | Resource and Capital DEL (excluding depreciation) has been revised up in 2018 to 2019 |
| Resource departmental AME | +£1,076m | Driven mainly by the devolved administrations (Scotland, Northern Ireland and Wales) and small and independent bodies. The changes reflect departments revising data in line with their 2018 to 2019 resource accounts. |
- Changes to total managed expenditure (TME) and public sector debt interest in all years are due to updated ONS data. More information about these changes is available in the monthly ONS public sector finances (PSF) release
8. Additional information about the PSS release
8.1 Accompanying tables
Tables 1 to 9 show central government departmental spending on a budgetary basis. These are the aggregates used by the government to plan and control expenditure. They cover departments’ own spending as well as support to local government and public corporations. They are consistent with “Estimates” voted by Parliament and broadly consistent with departmental resource accounts, which are based on commercial International financial reporting standards (IFRS) adapted for the public sector.
Budgets are divided into departmental expenditure limits (DEL), which are firm plans for 3 or 4 years, and annually managed expenditure (AME), covering spending which is demand-led, less predictable and more difficult to control. Table 1 shows the aggregate position for all departments and all types of spending, with some of the main types of spending shown separately. Table 8 shows in detail how the budgeting data is used to construct the total managed expenditure (TME) figures published by the Office for National Statistics. These are based on National Accounts concepts and are used in the aggregates which underlie the government’s fiscal policy.
Tables 10 to 11 present spending under the “expenditure on services” framework. This is based on National Accounts definitions and covers the whole of the public sector. It therefore has wider coverage than the budgeting framework and is also more stable over time.
Tables 10, 10a and 10b show public sector expenditure on services broken down by function over a longer number of years, allowing long-term trends to be identified. Table 11 presents data broken down by economic categories such as pay or grants.
8.2 Upcoming revisions and changes in forthcoming releases
The February PSS release has been updated to present the main publication text in an HTML format (previously available as a pdf). These changes have been made with the aim of improving the accessibility and presentation of the publication. The next HM Treasury PSS National Statistics release will be in May 2020. There are no expected changes to the spending frameworks for the next release.
8.3 PSS publication schedule for the coming year
| Date | Release |
|---|---|
| May 2020 | Contains update to the PSS series. May is the first publication in which full outturn data for the previous financial year is published, incorporating final data for all local authorities and devolved administrations |
| July 2020 | The July PSS release contains the first publication of departmental spending outturn for the 2019-20 financial year. Local authority data and much of the data from the devolved administrations are still provisional at this stage of the year. This is the main annual release. |
| Nov 2020 | As well as the PSS release, the Country and Regional Analysis (CRA) is also published in November each year. |