Annex A: COVID-19 vaccine allocation by occupation in those under than 50 years of age: considerations for prioritisation and allocation
Updated 13 April 2021

© Crown copyright 2021
This publication is licensed under the terms of the Open Government Licence v3.0 except where otherwise stated. To view this licence, visit nationalarchives.gov.uk/doc/open-government-licence/version/3 or write to the Information Policy Team, The National Archives, Kew, London TW9 4DU, or email: psi@nationalarchives.gov.uk.
Where we have identified any third party copyright information you will need to obtain permission from the copyright holders concerned.
This publication is available at https://www.gov.uk/government/publications/priority-groups-for-phase-2-of-the-coronavirus-covid-19-vaccination-programme-advice-from-the-jcvi/annex-a-covid-19-vaccine-allocation-by-occupation-in-those-under-than-50-years-of-age-considerations-for-prioritisation-and-allocation
Authors: Sharif Ismail, Gayatri Amirthalingam, Mary Ramsay (Public Health England (PHE))
Contributors: Andrew Earnshaw
Purpose
The purpose of this paper is to summarise available evidence regarding occupational exposure, risk of infection, hospitalisation and mortality from COVID-19 by occupational group. The paper focuses on remaining risk in the general population once the rollout of phase 1 of the vaccination programme has been completed – that is, among those under 50 years of age without specific underlying conditions. The paper also addresses evidence on transmission risks by occupation and occupational setting, partly with reference to emerging evidence on the effectiveness of available COVID-19 vaccines in stemming transmission, and implications this may have for use in specific occupational groups.
Background and scope
In December 2020, the JCVI set out its advice on prioritisation for phase 1, for which it recommended that the vaccine was prioritised based primarily on age given that this is the predominant risk factor for severe outcomes.
In addition, health and social care workers were prioritised in phase 1 for a number of reasons including (i) the evidence of high risk of exposure to, and infection by SARS CoV-2, (ii) the potential to transmit to vulnerable individuals and (iii) to minimise impact of staff absenteeism in the NHS. As the highest mortality rates in other occupational groups were in those aged 50 years and above who would therefore be eligible through the age-based programme, other specific occupational groups were not identified during phase 1. An accompanying annex to JCVI’s interim advice on prioritisation in phase 1 set out the anticipated implications for prioritisation on health inequalities including, to some extent, occupation, and explained the ethical approach underpinning the committee’s work.
This paper does not consider evidence on those who would already have been in priority groups under phase 1, namely frontline health and social care workers, and those aged 50 and over. It does, however, consider what is known about risks for occupational groups who have not been able, consistently, to work from home during the pandemic.
Structure of the workforce under the age of 50
What do we know about the workforce under 50 years of age? Analysis carried out by the Office for National Statistics (ONS) and published May 2020 provides a breakdown of the working age population under 50 across the UK to identify those who were keyworkers during wave 1, and within this, the number of people working in particular sectors – such as education and childcare, national and local government, or transport. Overall, just under 70% of the keyworker workforce is aged less than 50. Data on numbers of keyworkers by ethnicity and by age are limited. However, we do know that some keyworker occupations have higher proportions of workers from black, Asian and minority ethnic (BAME) groups compared with the general population.
Home working reduces the risk of occupational exposure to SARS-CoV-2, and it is clear that some workers are much less able to do this than others. Analysis of the Labour Market Survey (LMS) in April 2020 during the first lockdown, found that about 47% of working age adults surveyed in the UK did any work from home (defined as any work carried out from home in the week the survey was carried out), 86% of these as a result of COVID-19. Young people aged 16 to 24 were least likely to work from home among working age adults under 50 years old (30.2%). Occupations requiring higher qualifications and greater experience were more likely to offer opportunities for home working. Conversely, around 5% of process, plant or machine operatives reported any work from home during the survey period.
The ONS Business Insights and Impact on the UK Economy survey gives estimates of the proportion of workers (of all ages) attending their normal place of work, by sector during the pandemic. Survey results show that, from mid-June 2020 to the end of January 2021, a majority of workers in some sectors (including water supply and waste management, manufacturing, construction, and transportation and storage) continued to have to go into work, even taking into account national COVID-19 prevention measures during this time. However, these data include those staff on partial or full furlough and numbers in these categories vary across sectors: 47% in accommodation and food services in late January 2021, by comparison with 5% in manufacturing, for example.
Risk of being exposed to COVID-19 in the workplace
For those who cannot work from home, the likelihood of being exposed depends on a combination of factors including (i) the nature of the working environment, (ii) the level of contact workers have with other workers and with service users or clients, and (iii) the probability that those they come into contact with have the infection.
Across all age groups, the highest risks of COVID-19 transmission seem to occur in crowded and poorly ventilated indoor settings, especially where no face-coverings are worn. The types of workplaces in which these risks are likely to be increased include bars, nightclubs, indoor dining facilities, and gyms and exercise classes, but also include poorly ventilated office environments where social distancing cannot be properly observed. Large outbreaks have been observed in call centres, for example.[footnote 1] There is also evidence that process, plant and machine-work settings, and others where most workers are in elementary occupations account for a large proportion of workplace outbreaks.[footnote 2] Investigations from the UK and a number of other countries have identified meat-processing plants as sites of large-scale outbreaks probably due to a combination of low temperatures and poor airflow.[footnote 3], [footnote 4] However, it is difficult to say how many of the cases in these outbreaks occurred in workers aged under 50 because few reports give this information. It is also possible that in some cases, infection was acquired in either the household or community rather than the workplace.
The diversity in workplaces and working patterns means it is not possible to compare the risk of exposure to COVID-19 across occupations in an easy way. ONS analysis published in 2020 gives some insights, based on data from workers in different occupations on their proximity to others in the workplace, and how often they were exposed to disease. This analysis shows that for a number of occupations, inability to physically distance in workplace settings is comparable with some types of health and social care worker prioritised in phase 1 (table 1). A large majority of workers in the occupational groups that are least able to physically distance in the workplace are aged under 55. For some of these groups (for example security guards) a much higher proportion of the workforce is BAME and male, both of which are associated with poorer health outcomes. However, there are important limitations to this analysis, including that proximity and exposure estimates predate the pandemic, and workplace practices are likely to have changed significantly since then.
Data on absences also give an indication of risk across occupations. Results from the ONS Business Insights and Impact on the UK Economy survey, for example, show that absence rates from June 2020 to January 2021 were generally highest among health and social care, but wholesale and retail trades, manufacturing, and transportation and storage also had higher absence rates than other sectors over this period. However, differences in rates are mostly small, and these figures do not distinguish workers who have confirmed COVID-19 from those self-isolating as contacts of a COVID case.
Risk of infection with SARS-CoV-2 by occupation
PHE conducted four case-control studies between August and December 2020 in England to investigate risk of COVID-19 infection by occupation.[footnote 5] Each of these studies included 2,000 COVID-19 cases in adults over 18 who identified via NHS Test and Trace, and matched controls. Multivariable regression analysis was performed to calculate risk of infection after controlling for factors including age, ethnicity and deprivation. Pooled odds ratios (OR) showed that workers in construction and manufacturing (pooled OR 2.03, 95% CI 1.40–2.95), contact services (for example barbers, hairdressers and other services which require close contact) (1.93, 1.07–3.47), and hospitality (2.36, 1.77–3.14) had increased odds of infection in studies 1 to 3. Warehouse workers had markedly increased odds across all four studies (adjusted OR 1.06, 3.93, 14.19 and 4.30 respectively).
Most other sources of data on infection either do not report detailed findings for specific occupational groups or calculate risks for all workers rather than those under 50. One exception to this picture is in education where several sector-specific sources are available, although again none of these consider those under 50 specifically. Overall, these sources suggest that risk of infection among staff in educational settings is comparable with that seen in the general population. For example, an analysis of results from 2 September to 16 October 2020 through the ONS’ COVID Infection Survey to compare infection rates among workers in educational settings with those of other keyworkers, and other workers overall, found no significant differences in infection rates between these groups. Similarly, the first round of the School Infection Survey (SIS) in England, from 3 to 19 November 2020, found that 1.29% of school staff (95% confidence interval: 0.96–1.68%) tested positive for current infection, rising to 1.50% (1.08–2.02%) in areas of high prevalence at the time the survey was conducted. Nationally, the positivity rate in England at this time (8 to 14 November) was 1.22% (1.15–1.29%). Although infection rates among staff in secondary schools (1.47%, 1.08-1.97%) were higher than those in primary schools (0.75%, 0.32–1.47%) this difference was not statistically significant.
Risk of hospitalisation and mortality from COVID-19 by occupation
Data on occupation and hospitalisations for COVID-19 are limited. Neither routine surveillance systems nor key research platforms currently capture enough data on occupation to determine whether the risk of being hospitalised with COVID-19 differs significantly between groups.
We do, however, have a clearer picture for mortality from COVID-19. Mortality rates among those under 50 have been calculated by PHE using provisional ONS death registration data, and population data from ONS Annual Population Survey. Considering minor occupational groups, mortality rates for a small but consistent set of occupations exceed age and sex-specific rates for the population as a whole, and this effect is particularly pronounced in those aged 40 to 49 (figure 1). Overall, road transport drivers are the only group that show an age-specific mortality rate significantly in excess of the population rate irrespective of age, although when data are disaggregated by sex, this effect is retained only for male road transport drivers aged 40 to 49. Mortality rates among those in elementary security occupations are greater than the population rate for those aged 30 to 49, and especially among men. However, these age- and sex-specific rates do not account for other potentially important factors (for example deprivation and ethnicity) that have been shown to influence COVID-19 outcomes. The absence of denominator data means that we also cannot determine rates for different ethnic groups.
Other sources provide data on occupational groups at increased risk of mortality from COVID-19 but do not consider those under 50 specifically. For example, ONS data on deaths by occupation from March to December 2020 show significantly higher mortality rates across all major occupational groups among men than for women. Considering major occupational groups, the highest, age-standardised mortality rates among men during this period were seen for those working in elementary occupations (66.3 per 100,000, 95% CI 61.3–71.2). For women, the highest rates were seen among those working as process, plant and machine operates (33.7 per 100,000, 95% CI 25.1–44.2).
Summary
This paper summarises available evidence on occupational risk and COVID-19 outcomes. Assessment of occupational risk of COVID-19 specifically among those aged under 50 is limited by the fact that data on occupation are not consistently recorded in routine systems, and by the small volume of research literature on this topic.
However, there is some consistency in evidence suggesting that risk of exposure and of poor health outcomes is higher for some occupations and in some workplace settings (including manufacturing, security, road transport and other elementary occupations) than for others. Risk of mortality in these groups appears to be highest in the 40 to 49 age group and particularly among men.
Acknowledgements
We are grateful to colleagues in Population Health Analysis in the Health Improvement Directorate, the Blood Borne Virus Department and the Immunisation and Countermeasures Division, and others in the National Infection Service at PHE for providing data and publications on which this paper draws.
Table 1: top 40 occupations in order of closest proximity to others in workplace settings
| Occupation title | % age of the workforce under 55 | Proximity to others | Exposure to disease | % age of the work force that are male | % age of the workforce that are BAME |
|---|---|---|---|---|---|
| Dental nurses | 95.1 | 99.5 | 98.0 | <5.0 | 6.1 |
| Actors, entertainers and presenters | 77.0 | 95.0 | 5.0 | 55.5 | 8.8 |
| Veterinarians | 92.0 | 91.0 | 89.0 | 38.0 | - |
| Veterinary nurses | 94.1 | 90.0 | 77.0 | 6.2 | - |
| Ophthalmic opticians | 79.2 | 90.0 | 75.0 | 46.1 | 27.2 |
| Beauticians and related occupations | 94.2 | 89.6 | 23.6 | 7.3 | 14.3 |
| Medical practitioners | 83.5 | 89.2 | 91.2 | 51.1 | 27.9 |
| Hairdressers and barbers | 87.8 | 89.0 | 32.8 | 13.7 | 8.9 |
| Medical and dental technicians | 78.7 | 88.8 | 89.8 | 40.9 | 14.8 |
| Houseparents and residential wardens | 65.0 | 88.1 | 90.6 | 24.4 | 10.3 |
| Nursery nurses and assistants | 89.8 | 88.0 | 36.0 | <5.0 | 10.1 |
| Chefs | 88.2 | 88.0 | 20.5 | 79.3 | 21.1 |
| Teaching assistants | 80.0 | 88.0 | 36.0 | 9.1 | 8.7 |
| Educational support assistants | 79.8 | 88.0 | 36.0 | 11.9 | 10.4 |
| Nurses | 78.7 | 86.0 | 91.5 | 11.5 | 19.4 |
| Air travel assistants | 86.6 | 85.0 | 40.0 | 36.4 | 9.5 |
| Health professionals n.e.c.[footnote 6] | 79.5 | 84.9 | 67.8 | 22.7 | 13.9 |
| Podiatrists | 60.6 | 84.9 | 67.8 | 24.1 | - |
| Care workers and home carers | 77.0 | 84.8 | 41.3 | 16.3 | 19.2 |
| Fitness instructors | 83.5 | 84.2 | 27.8 | 47.8 | 10.2 |
| Pharmaceutical technicians | 83.5 | 83.0 | 72.0 | 15.1 | 17 |
| Special needs education teaching professionals | 76.0 | 83.0 | 48.8 | 17.8 | 7.9 |
| Dispensing opticians | 71.1 | 83.0 | 40.0 | 37.9 | 14.8 |
| Bricklayers and masons | 77.4 | 81.5 | 12.5 | - | 1.8 |
| Carpenters and joiners | 81.9 | 80.0 | 9.0 | 98.7 | 3.2 |
| Playworkers | 87.5 | 79.8 | 30.0 | 10.9 | 13.4 |
| Childminders and related occupations | 82.8 | 79.8 | 30.0 | <5.0 | 10.5 |
| Rail travel assistants | 60.5 | 79.5 | 21.5 | 77.1 | 8.4 |
| Bar staff | 94.5 | 79.0 | 4.0 | 50.5 | 4.9 |
| Youth and community workers | 83.7 | 79.0 | 58.0 | 27.4 | 10.6 |
| Bank and post office clerks | 78.1 | 79.0 | 25.5 | 28.3 | 15.2 |
| Housing officers | 77.4 | 79.0 | 58.0 | 19.7 | 18.3 |
| Child and early years officers | 76.9 | 79.0 | 58.0 | 18.7 | 14.2 |
| Financial administrative occupations n.e.c.[footnote 6] | 76.9 | 79.0 | 25.5 | 29.2 | 14.8 |
| Welfare and housing associate professionals n.e.c.[footnote 6] | 74.3 | 79.0 | 58.0 | 23.8 | 13.3 |
| Fire service officers (watch manager and below) | 91.9 | 78.0 | 53.8 | 94.1 | 2.7 |
| Restaurant and catering establishment managers and proprietors | 85.3 | 78.0 | 10.0 | 52.8 | 16.2 |
| Catering and bar managers | 83.0 | 78.0 | 10.0 | 41.3 | 8.9 |
| Security guards and related occupations | 72.9 | 77.3 | 33.0 | 84.7 | 31.8 |
| Police officers (sergeant and below) | 95.7 | 77.0 | 62.8 | 67.3 | 3.6 |
| Telephone salespersons | 94.5 | 77.0 | 5.0 | 56.9 | 12.7 |
| Roofers, roof tilers and slaters | 86.1 | 77.0 | 4.0 | - | 2.2 |
| Animal care services occupations n.e.c.[footnote 6] | 85.9 | 77.0 | 41.8 | 15.1 | 0.6 |
| Police community support officers | 74.2 | 77.0 | 62.8 | 47.9 | 6.7 |
Table 1: the top 40 occupations (classified using 4-digit UK SOC 2010 classification) in order of closest proximity to others in workplace settings, based on ONS analysis using 2019 data. For illustration, a small selection of occupational groups that were covered by phase 1 vaccine prioritisation are also included (highlighted fields).
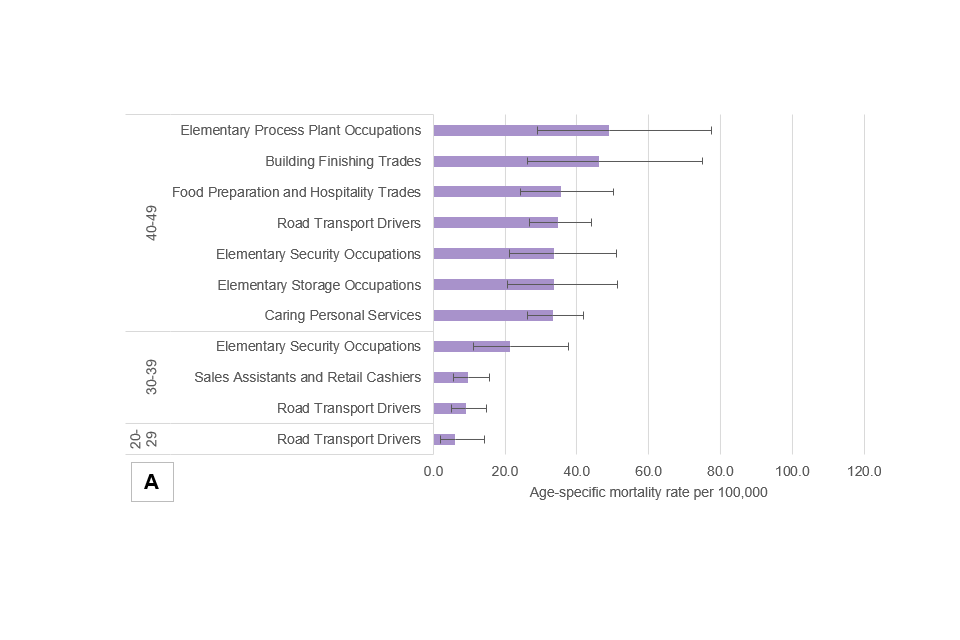
Figure 1a
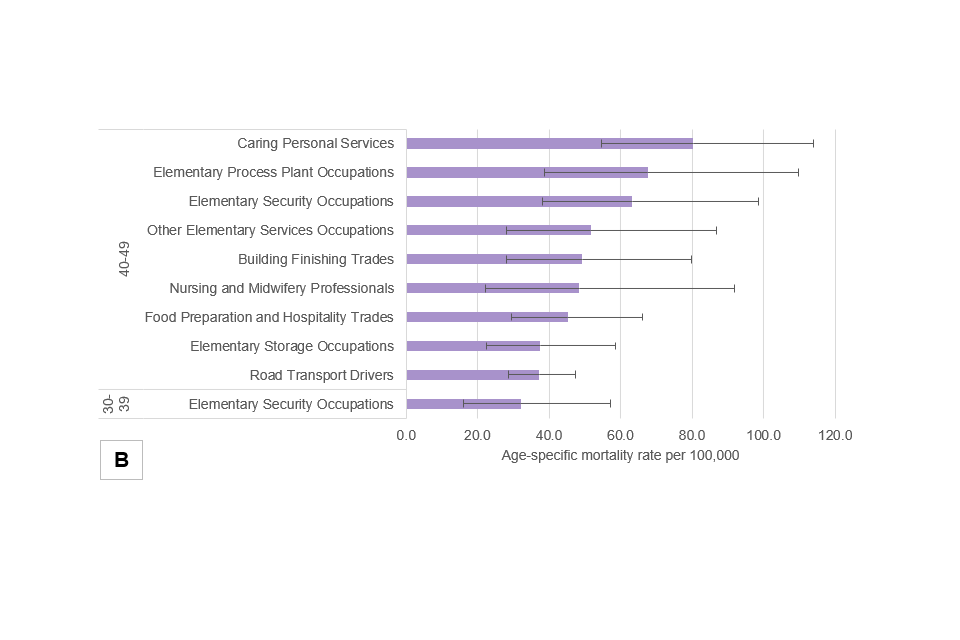
Figure 1b
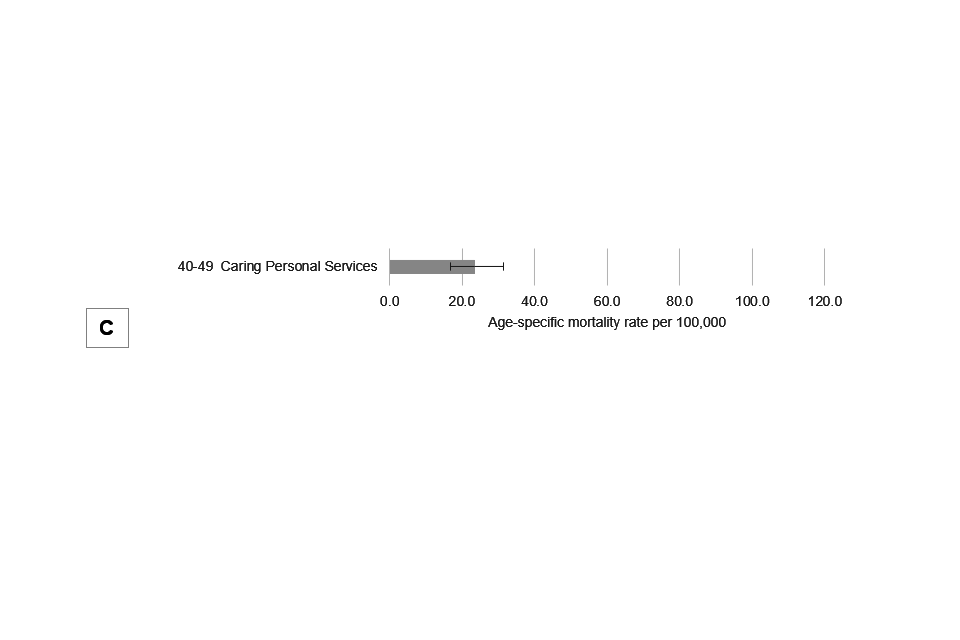
Figure 1c
Figure 1a to 1c: panel showing age-specific mortality rates for minor occupational groups in England in the period 21 March 2020 to 02 January 2021, for the population as a whole (1a), for males only (1b) and females only (1c). Whiskers indicate 95% confidence intervals for each age- and sex-specific mortality estimate. Only those occupations for which calculated age-specific rates were significantly higher than the equivalent population rate have been included in this diagram (source: PHE analysis of provisional ONS death registration data, and population data from ONS Annual Population Survey).
References
-
Park SY, Kim YM, Yi S, Lee S, Na BJ, Kim CB, Kim JI, Kim HS, Kim YB, Park Y, Huh IS. Coronavirus disease outbreak in call center, South Korea. Emerging Infectious Diseases. 2020 Aug;26(8):1666. ↩
-
Bui DP, McCaffrey K, Friedrichs M, LaCross N, Lewis NM, Sage K, Barbeau B, Vilven D, Rose C, Braby S, Willardson S. Racial and ethnic disparities among COVID-19 cases in workplace outbreaks by industry sector—Utah, March 6–June 5, 2020. Morbidity and Mortality Weekly Report. 2020 Aug 21;69(33):1133. ↩
-
Günther T, Czech‐Sioli M, Indenbirken D, Robitaille A, Tenhaken P, Exner M, Ottinger M, Fischer N, Grundhoff A, Brinkmann MM. SARS‐CoV‐2 outbreak investigation in a German meat processing plant. EMBO molecular medicine. 2020 Dec 7;12(12):e13296 ↩
-
National Outbreak Control Team (Ireland). Investigation into a Series of Outbreaks of COVID-19 in Meat Processing Plants in Ireland, 2020. July. ↩
-
SAGE Environmental and Modelling Group (EMG) – Transmission Group (2021). COVID-19 Risk by Occupation and Workplace. 11 February. ↩
-
‘n.e.c.’ means groups not captured by other, related occupational groups. ↩ ↩2 ↩3 ↩4