Police powers and procedures England and Wales year ending 31 March 2014
Published 16 April 2015
Applies to England and Wales

© Crown copyright 2015
This publication is licensed under the terms of the Open Government Licence v3.0 except where otherwise stated. To view this licence, visit nationalarchives.gov.uk/doc/open-government-licence/version/3 or write to the Information Policy Team, The National Archives, Kew, London TW9 4DU, or email: psi@nationalarchives.gov.uk.
Where we have identified any third party copyright information you will need to obtain permission from the copyright holders concerned.
This publication is available at https://www.gov.uk/government/statistics/police-powers-and-procedures-england-and-wales-year-ending-31-march-2014/police-powers-and-procedures-england-and-wales-year-ending-31-march-2014
1. Introduction
This release contains figures on arrests, detentions, road checks, intimate searches, stops and searches, breath tests and fixed penalty notices issued for motoring offences. Most of the data are provided directly to the Home Office by police forces in England and Wales. Data on fixed penalty notices (FPNs) issued for motoring offences are collected by the Home Office from a national fixed penalty processing system (PentiP). Further information on data collection can be found in the user guide.
2. Summary
In the year ending 31 March 2014:
- there were 1.04 million arrests made by police in England and Wales, this represents a fall of 3% compared with the previous year
- recorded crime (excluding fraud offences) fell by 1% compared with the previous year
- over 3,500 persons were detained for more than 24 hours under the Police and Criminal Evidence Act 1984 (PACE), down 7% on the previous year
- there were around 900,000 stops and searches carried out by police in England and Wales in the year ending 31 March 2014, a 12% fall compared with the previous year
- there were a total of 17 road checks conducted by police in England and Wales, 9 fewer than the previous year
- there were 73 intimate searches carried out under section 55 of PACE. Sixty-seven of these were carried out by a suitably qualified person
In 2013:
- there were 1.15 million FPNs issued for motoring offences, a fall of 13% compared with the previous year, 62% of these were issued for speed limit offences
- police carried out 680,000 breath tests in 2013, similar to the number in 2012; 10% of these were either positive or refused
3. Arrests
3.1 Introduction
Data presented here are on the police powers of arrest. In line with police recorded crime statistics, these data cover arrests for all notifiable offences carried out by police in England and Wales. They are presented on a financial-year basis (April to March) and are drawn from data provided directly to the Home Office by the 43 territorial police forces in England and Wales. The Home Office does not receive arrest data from the British Transport Police (BTP). This release includes trends over 11 years, from the year ending 31 March 2004 to the year ending 31 March 2014, and includes breakdowns by offence group, sex, age group and self-defined ethnicity.
Figures on arrests reported to the Home Office reflect police activity and should not be used to infer levels of crime committed by offenders. The Office for National Statistics (ONS) amended some categories of the police recorded crime series in the year ending 31 March 2013. These changes have not directly influenced the arrest data presented here, although some offences may have changed offence group. Further details of the amendments made by ONS can be found in the user guide.
3.2 Key findings
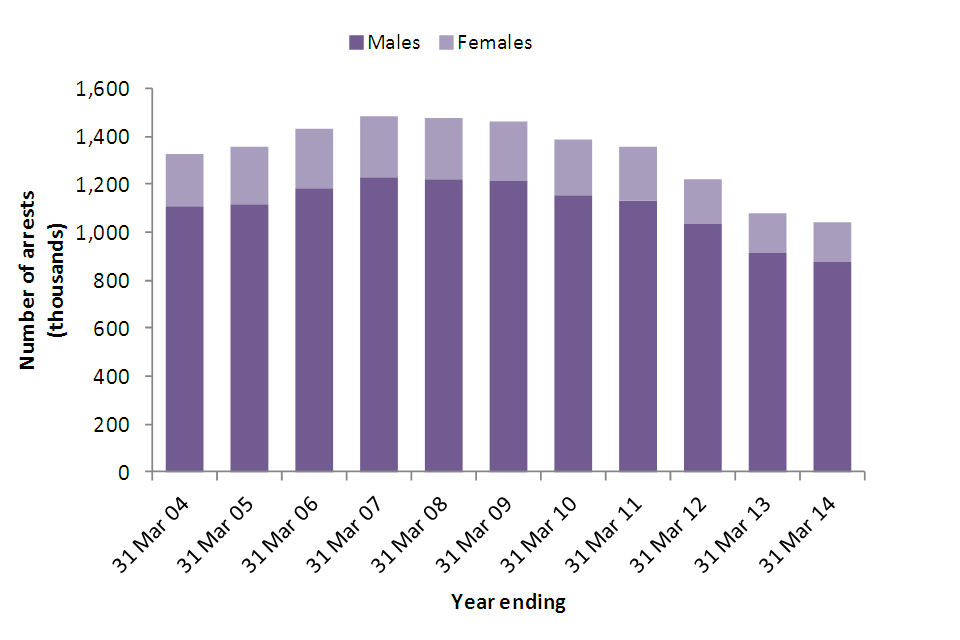
here were 1,041,221 arrests carried out by the police in England and Wales in the year ending 31 March 2014, representing a fall of 3% on the previous year. This continues a gradual year-on-year fall in the number of arrests since a peak in the year ending 31 March 2007. Between the year ending 31 March 2013 and the year ending 31 March 2014, recorded crime (excluding fraud offences) fell by 1%.
The majority (84%) of arrests in the year ending 31 March 2014 were of males. This is consistent with sex breakdowns for previous years.
Excluding those who were under 10 (i.e. under the legal age of arrest) and those whose age was unknown, each age group saw a fall in the number of arrests in the year ending 31 March 2014, compared with the previous year.
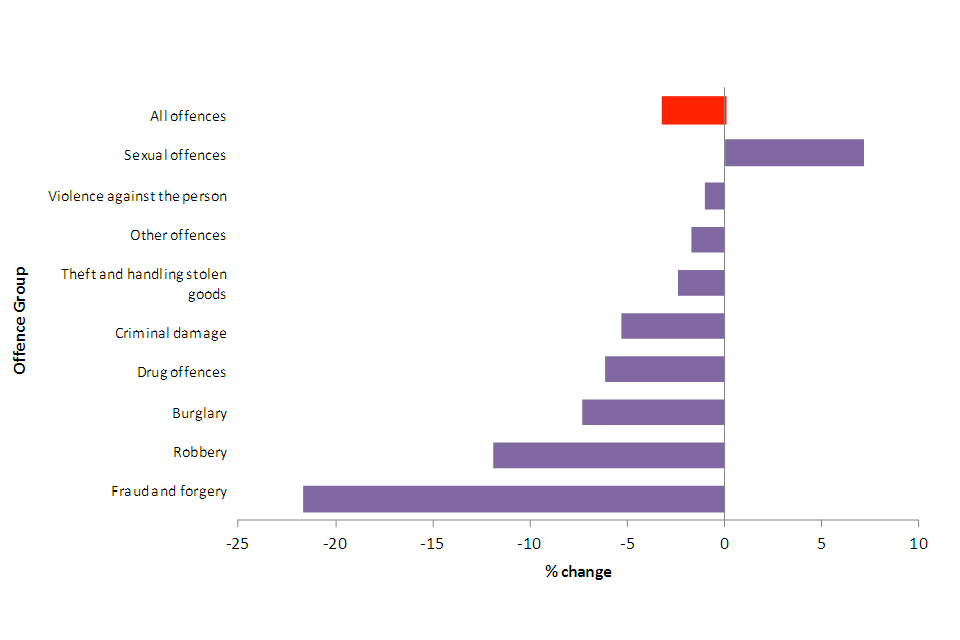
A third of arrests were for offences related to violence against the person and just over one in five were for theft and handling stolen goods. Every offence group saw a fall in the number of arrests compared with previous years, except for sexual offences which saw an increase of 7%. This could be related to Operation Yewtree.
The majority (79%) of persons arrested considered themselves to be White. The number of persons arrested fell for each ethnic group in the year ending 31 March 2014 compared with the year ending 31 March 2013.
Figure 3.1 Number of arrests carried out by police in England and Wales, by sex, year ending 31 March 2004 to year ending 31 March 2014
.
Source: Home Office, Arrests table A.01.
3.3 Data tables
Arrests data provided to the Home Office by the 43 territorial police forces in England and Wales are presented in the arrests tables.
3.4 Arrests by age and sex
Of the 1,041,221 arrests carried out in the year ending 31 March 2014, the majority (879,285, or 84%) were of males, which is consistent with previous years where males have accounted for between 83% and 85% of all arrests.
The fall in the number of arrests recorded by police in England and Wales was driven by a reduction in the number of arrests of males, which fell by 4% in the year ending 31 March 2014 compared with the previous year. The number of females arrested showed no percentage change over the same period.
The age group that saw the largest decrease in the number of arrests was the 18 to 20 year olds, which fell by 12% in the year ending 31 March 2014 compared with the previous year. Arrests of 10 to 17 year olds fell by 11% and arrests of those aged 21 and over fell by 1%.
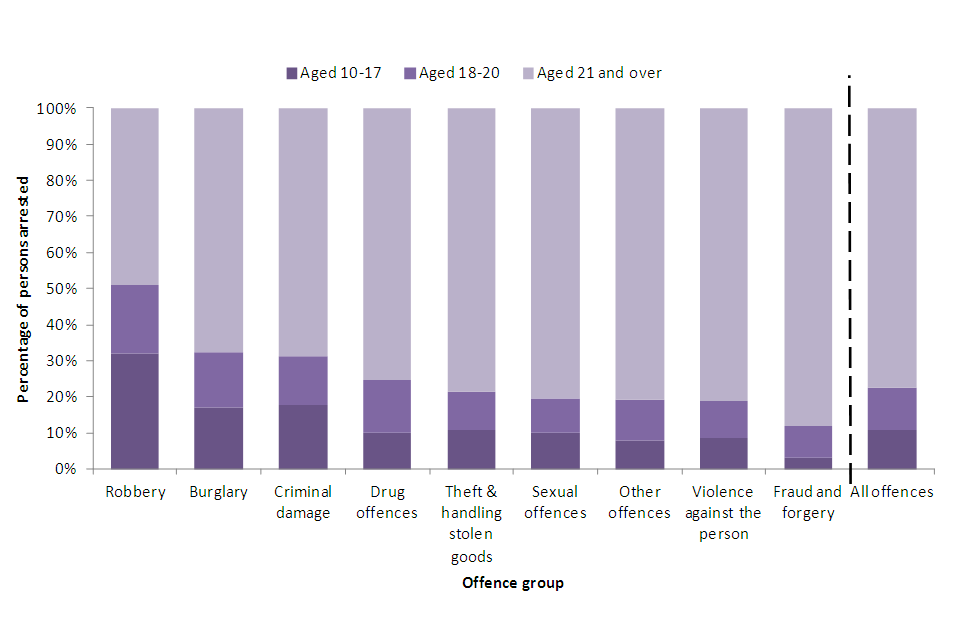
The ages of those arrested were similar for males and females, with over three-quarters of all arrestees being 21 or over. Excluding those whose age was unknown, and those who were under 10 at the time of arrest (i.e. under the legal age limit for arrest), the majority (between 64% and 86%) of those arrested fell into the 21 and over age group for all offence types, although to a lesser extent for robbery, where only 49% of those arrested were aged 21 or over. Around a third of people arrested for robbery were aged 10 to 17 and the remaining 19% were aged 18 to 20.
Figure 3.2 Age group1 of persons arrested by offence group, year ending 31 March 2014
.
Source: Home Office, Arrests table A.03.
Chart Notes
- Excludes those whose age was unknown, and those who were under 10 at time of arrest.
3.5 Arrests by offence group
In the year ending 31 March 2014, a third of all arrests by police in England and Wales were for violence against the person offences, a one percentage point increase on the previous year. The next most common reason for arrest was for theft and handling stolen goods offences, which accounted for 22% of all arrests, the same as the previous year. The breakdown of arrests by offence groups has remained fairly consistent from year to year.
The number of persons arrested in the year ending 31 March 2014 fell across all offence groups with the exception of sexual offences, which increased by 2,247 (7%) when compared with the previous year. This increase should be seen in the context of Operation Yewtree, which has led to an increase in the number of sexual offences being recorded by police following a number of high profile cases of sexual abuse. This has resulted from both an increase in the number of historical cases being reported to, and subsequently recorded by, the police, and a greater willingness of victims to report more recent sexual abuse. While overall police recorded crime fell by 1% throughout this period, the number of sexual offences recorded by the police increased by 20%.
The most common group of offences for which both males and females were arrested was violence against the person, followed by theft and handling stolen goods. However, there were some differences in arrest patterns for males and females. For example, 30% of arrests of females were for theft and handling stolen goods compared to only 20% of arrests of males. Males saw higher proportions of arrests for most other offence types, most notably drug offences, burglary and sexual offences.
Table 3.1 Proportion of arrests by offence group, year ending 31 March 2014
| Percentages | England and Wales | ||
|---|---|---|---|
| Offence group | Male | Female | All |
| Violence against the person | 32 | 35 | 33 |
| Theft and handling stolen goods | 20 | 30 | 22 |
| Other offences1 | 14 | 13 | 14 |
| Drug offences | 11 | 7 | 10 |
| Criminal damage | 8 | 6 | 7 |
| Burglary | 8 | 3 | 7 |
| Sexual offences | 4 | 1 | 3 |
| Robbery | 2 | 1 | 2 |
| Fraud and forgery | 2 | 3 | 2 |
Source: Home Office, Arrests table A.02.
Table Notes
- Other offences include public order offences, possession of weapons and other miscellaneous offences.
In terms of numbers, arrests relating to drug offences saw the largest fall in the year ending 31 March 2014 compared with the previous year, falling by 6,865 from 112,229 to 105,364. Arrests relating to fraud and forgery offences saw the largest percentage fall at 22%, falling from 26,236 to 20,558 arrests.
Violence against the person continued to fall for the seventh consecutive year from a peak of 487,569 in the year ending 31 March 2007. The number of arrests for property crimes such as burglary, theft and handling stolen goods, and criminal damage all continued to fall to the lowest levels since collections began in the year ending 31 March 2004.
Figure 3.3 Percentage change in number of arrests carried out by police in England and Wales, by offence group, year ending 31 March 2014 compared with year ending 31 March 2013
.
Source: Home Office, Arrests table A.02.
3.6 Arrests by ethnicity
When an individual is arrested, they are asked to define their ethnicity. For the purpose of this analysis, these are grouped into six categories:
- White
- Black (or Black British)
- Asian (or Asian British)
- Chinese or Other
- Mixed
- Not stated
The ethnic breakdown of those arrested in the year ending 31 March 2014 was broadly the same as it was the previous year for England and Wales as a whole. Seventy-nine per cent of those arrested self-defined as White, 8% as Black (or Black British) and 6% as Asian (or Asian British). The rest considered themselves either of mixed ethnicity, Chinese or Other, or did not state their ethnicity.
Some forces recorded larger proportions of people arrested who were either Black or Asian than others. The Metropolitan Police (25%), City of London (19%), West Midlands (12%) and Bedfordshire (12%) all recorded relatively high proportions of Black arrestees. City of London (15%), West Midlands (14%), Bedfordshire (14%), Metropolitan Police (13%), West Yorkshire (12%) and Leicestershire (12%) all recorded relatively high proportions of Asian arrestees. These figures should be considered in line with the residential and visiting population of each police force area.
There were falls in the number of people arrested from each ethnic group in the year ending 31 March 2014 compared with the previous year. The number of people arrested who considered themselves White, of mixed ethnicity, or Chinese or Other all fell by 4%. The number of arrestees who considered themselves to be Black fell by 2% and the number who considered themselves to be Asian fell by 1%.
3.7 Arrests by police force area
The number of arrests per 1,000 members of the population was highest in Cleveland with 31 arrests. Devon and Cornwall, Warwickshire and Wiltshire recorded the lowest arrest rates with 10 arrests per 1,000 population. The arrest rate for England and Wales as a whole was 18 arrests per 1,000 population.
Out of the 43 forces in England and Wales, 11 showed an increase in the number of arrests, 31 showed a decrease and one force (Durham) showed no percentage change in the year ending 31 March 2014 compared with the previous year.
West Mercia saw the largest decrease in percentage terms, with a 21% fall. Avon and Somerset saw the largest numerical fall in the number of arrests with a decrease of 4,813. The largest increase in the number of arrests in terms of both numbers and percentages was seen in South Wales, who recorded an increase of 2,741 arrests (or 10%).
3.8 Data quality and interpreting the figures
The presented figures are correct at the time of publication and may include revisions submitted by forces for the years covered by, and received since the publication of, the previous year’s edition.
When considering arrest figures on sexual offences, it should be considered that these are influenced by the willingness of victims to report offences. The number of arrests for drug offences is greatly dependent on police activities and priorities, and does not give a reliable indication of trends in the level of drug offending.
Comparisons with recorded crime are limited here to trends over time. As arrests relate to persons and recorded crime relates to offences, it is not appropriate to compare actual numbers. Furthermore, an individual arrested in a particular financial year, could be arrested for an offence that was recorded by police in a previous year.
In line with a recommendation by the National Statistician’s Review of Crime Statistics for England and Wales, which identified fraud as one of the gaps in crime statistics, police recorded crime data published by the Office for National Statistics (ONS) now include information from additional sources such as Action Fraud and the National Fraud Intelligence Bureau. Information about the ONS’s changes to offence classifications can be found via their crime and justice methodology webpage. Data on arrests presented in this release have been unaffected by this; all arrests for notifiable fraud and forgery offences are included in the figures.
Due to the small resident population within the City of London police force area, caution is needed when examining the ethnic breakdown of those arrested by that force. Differences in the proportion of Black or Ethnic Minority arrestees in some police force areas (e.g. Metropolitan, West Midlands) may, in part, reflect the different proportions of ethnic groups in the overall population, as well as visitors to those areas. Furthermore, an individual arrested in a particular police force area will not necessarily be a resident of that area. Population breakdown is based on residents of a particular area.
3.9 Potential uses of the data
The key users of arrest statistics are the Ministry of Justice (MoJ) and Youth Justice Board (YJB), both of which present data collated from various government departments and agencies in statistical publications looking at race, women and young people and the criminal justice system. Within the Home Office, the statistics are used by a range of policy advisers, social researchers and economists in order to inform policy and operational decisions by ministers.
Whilst some ethnic breakdowns are provided here, detailed figures and analysis continue to be the responsibility of MoJ. The latest edition of its Statistics on race and the criminal justice system series was published in November 2013. Figures presented in this release may since have been superseded by data included in this edition of Police powers and procedures. The next edition of MoJ’s bulletin is expected to be published in the autumn of 2015.
MoJ also publishes biennial statistics on the representation of females and males as victims, suspects, offenders and employees in the criminal justice system. Its latest statistics, which can be found in Women and the criminal justice system, were published in November 2014.
The YJB’s series on Youth justice statistics looks at the flow of young people through the Youth Justice System. The latest edition was released in January 2015 and includes arrests data for the financial year ending March 2014, which may since have been superseded by data included in this edition of Police powers and procedures.
3.10 Other data sources
Data on individuals given an out of court disposal or proceeded against at court are published in MoJ’s Criminal justice statistics quarterly.
Crime Statistics, including police recorded crime figures, are published by ONS on a quarterly basis.
4. Detentions
4.1 Introduction
Under section 42 of the Police and Criminal Evidence Act 1984 (PACE), police may detain a suspect before charge, normally for a maximum of 24 hours, or for up to 36 hours when an alleged offence is an indictable one. From 20 January 2004, new powers were introduced which enable an officer of the rank of superintendent or above to authorise continued detention for up to 36 hours for all arrestable offences. Additionally, police may apply to magistrates to authorise warrants of further detention for up to 60 hours, extending the detention period to a maximum of 96 hours without charge.
This section provides information on the number of persons detained for more than 24 hours who were subsequently released. It also provides details on the number of warrants for further detention that were applied for and the number that led to charges. Data are collected by the Home Office from the 43 territorial police forces in England and Wales on a financial-year basis.
Further information on police detentions can be found in the user guide.
4.2 Key findings
In the year ending 31 March 2014, there were a total of 3,684 persons detained under PACE for more than 24 hours, by police in England and Wales. This represents a fall of 7% compared with the previous year (based on data from 37 forces that were able to provide complete data for both years).
Ninety-five per cent (3,487) of those detained were held for between 24 and 36 hours and a further 60 persons were held for more than 36 hours, before being released without charge. The remaining 137 were detained under warrant for further arrest.
Police in England and Wales applied to magistrates for 531 warrants of further detention. Twenty-nine of these were refused meaning warrants were granted in 95% of cases. When a warrant of further detention was granted, this led to a charge in 68% of cases, a fall of 3 percentage points compared with the previous year (excluding forces who were unable to data for both years).
4.3 Data tables
Detentions data provided to the Home Office by the 43 territorial police forces in England and Wales are presented in the detentions tables.
4.4 Data quality and interpreting the figures
The presented statistics are correct at the time of publication. There have been no revisions submitted by forces for the years covered by, and received since the publication of Police powers and procedures 2012 to 2013.
Lincolnshire and Thames Valley were unable to provide detentions data for the year ending 31 March 2014. Cheshire and Wiltshire were only able to provide partial data. These forces have been excluded from some year-on-year comparisons, as outlined in the notes for the detentions tables.
4.5 Potential uses of the data
Figures on police detention are reported to the Home Office for the purpose of monitoring whether police forces are using their powers of further detention appropriately, rather than to ascertain charging rates. As a result, no figures are collected on the number of persons charged after being held for less than 36 hours with no warrant applied for.
Figures on persons held for more than 36 hours under warrant are collected. This is because such persons can be held in police custody for up to 96 hours and it is important to monitor charging rates when persons are held for extended periods of time.
5. Stop and Search
5.1 Introduction
This section looks at stops and searches conducted by police in England and Wales under 3 different legislative powers. These are:
- Section 1 of the Police and Criminal Evidence Act 1984 (PACE) and associated legislation
- Section 60 of the Criminal Justice and Public Order Act 1994
- Sections 44 and 47A of the Terrorism Act 2000
The powers allow police to search persons and vehicles without a warrant in specific situations. Details of the above legislation and the legislation associated with section 1 of PACE are included in the user guide.
This release includes statistics on a financial-year basis (April to March) from the year ending 31 March 2004 to the year ending 31 March 2014. It covers the reasons given by police for conducting stops and searches, as well as ethnic breakdowns of persons stopped and searched and subsequently arrested under each type of legislation. The data are based on returns submitted to the Home Office by the 43 territorial police forces in England and Wales. Data for the British Transport Police (BTP) are available from the year ending 31 March 2010. BTP data has been excluded from any analysis involving long-term trends to ensure the data are comparable over time.
Figures reported to the Home Office on stops and searches, and resultant arrests, reflect police activity and should not be used to infer levels of crime committed by offenders, or their specific characteristics.
5.2 Key findings
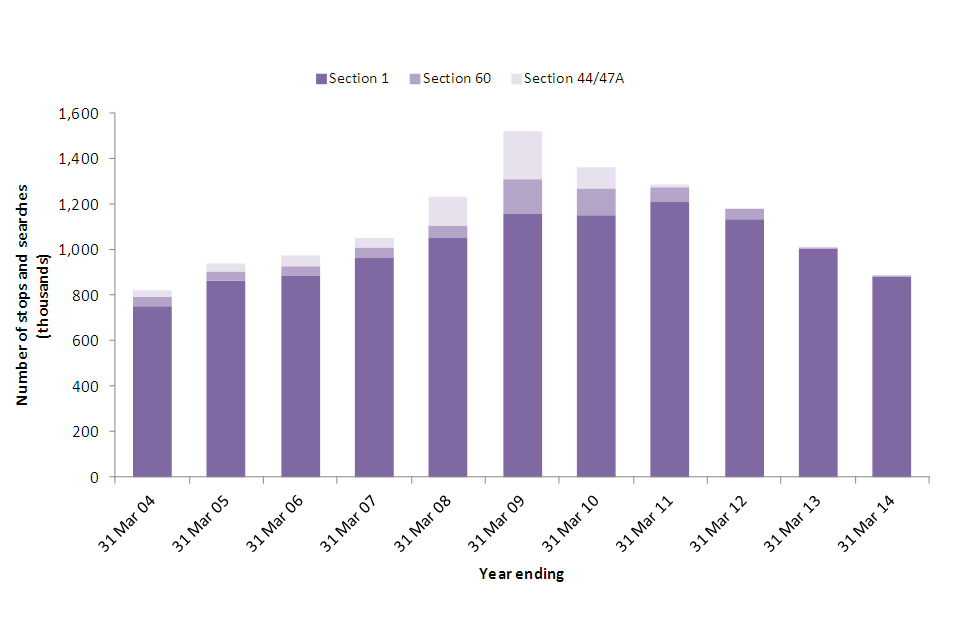
In the year ending 31 March 2014, police in England and Wales stopped and searched 899,919 persons and/or vehicles. This represents a 12% fall on the previous year.
- 895,975 of these were under section 1 of PACE (s1 PACE), which saw an 11% fall compared with the previous year; 12% of these searches resulted in a subsequent arrest
- 3,944 of these were under section 60 of the Criminal Justice and Public Order Act, a fall of around a quarter compared with the previous year; 5% of these searches led to an arrest.
The number of s1 PACE stops and searches carried out by police in England and Wales (excluding BTP) was at its lowest since the year ending 31 March 2005. The total number of all stops and searches was at its lowest since the year ending 31 March 2004.
The number of section 60 stops and searches has seen a large decrease since its peak in the year ending 31 March 2009. This fall has resulted from forces using this power in a more focussed way.
There have been no stops and searches under section 47a of the Terrorism Act 2000 (TACT 2000) since the year ending 31 March 2011. This resulted from a review of the current legislation in 2011 which meant the power became much more limited for police forces (see the user guide for more details).
Figure 5.1 Stops and searches by legislation, England and Wales1, year ending 31 March 04 to year ending 31 March 14
.
Source: Home Office, Stop and Search table SS.01.
Chart Notes
- Excludes data for BTP.
5.3 Data tables
Stop and search data provided to the Home Office by the 44 police forces in England and Wales (including BTP) can be found in the stop and search tables.
5.4 Section 1 PACE and associated legislation
Under section 1 of the Police and Criminal Evidence Act 1984, police are given the power to search persons and/or vehicles for a range of items including stolen property, offensive weapons, controlled drugs or evidence relating to terrorism. Further details can be found in the user guide.
Excluding BTP, in the year ending 31 March 2014, the number of section 1 PACE stops and searches fell by 11% compared with the year ending 31 March 2013, to 883,085, the lowest level since the year ending 31 March 2005, when the police carried out 861,494 stops and searches. Over the same period, the number of arrests resulting from section 1 PACE stops and searches rose by 2% to 106,696 arrests, meaning that 12% of all section 1 PACE stops and searches led to an arrest, 2 percentage points higher than in the previous year. Since the year ending 31 March 2004, arrest rates have remained fairly stable with between 9% and 13% of stops and searches leading to an arrest.
There are a number of reasons why the police may carry out an s1 PACE stop and search, for example, they may suspect an individual is carrying drugs, or a weapon. Any subsequent arrests resulting from an s1 PACE stop and search may not be related to the initial reason for the stop and search. For example, an officer may suspect that an individual is carrying drugs, but actually finds them to be carrying a weapon. As a result, arrest rates give an overall picture of the number of stops and searches leading to arrests, but do not give insight into arrest rates for specific offence categories. In the year ending 31 March 2014, the most common reasons for conducting an s1 PACE stop and search were:
- drug related, which accounted for 53% of searches and 41% of all subsequent arrests
- stolen property related, which accounted for 21% of searches and 28% of subsequent arrests
- going equipped, which accounted for 14% of searches and 9% of subsequent arrests
The most common reasons police state for conducting s1 PACE stops and searches have remained consistent over time, with drug-related searches, and searches relating to stolen property being the 2 most common reasons cited by police. This trend is reflected in the number of resultant arrests following such searches, in which drugs and stolen-property related offences are the most common reasons given.
5.5 Section 60 of the Criminal Justice and Public Order Act 1994
Under section 60 of the Criminal Justice and Public Order Act 1994, the police have the power to stop and search persons and/or vehicles in anticipation of violence through the use of offensive weapons or dangerous instruments. Further details can be found in the user guide.
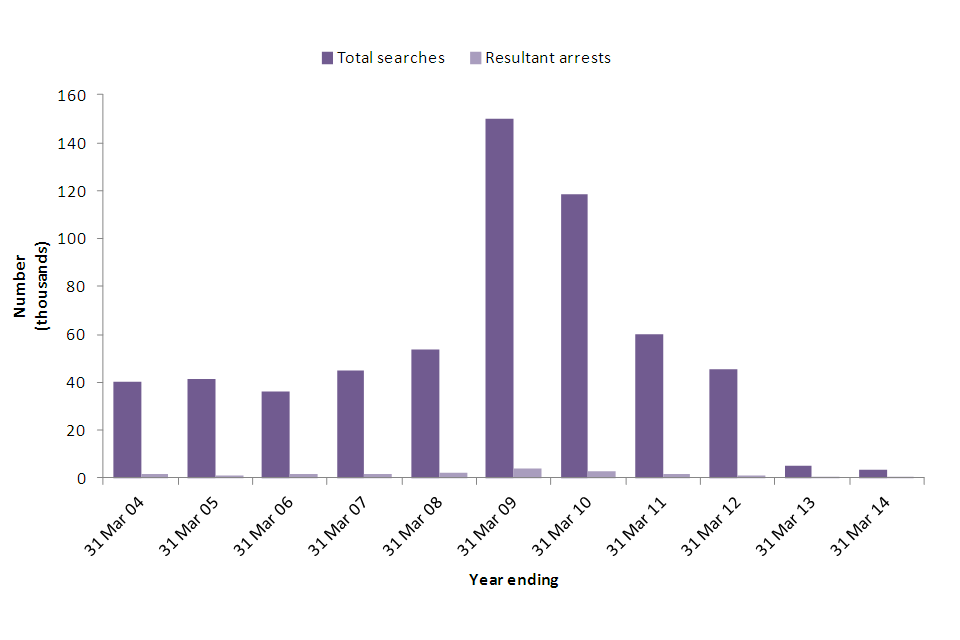
In the year ending 31 March 2014, the police (excluding BTP) carried out 3,944 section 60 stops and searches. This represents a fall of 26% compared with the 5,336 section 60 stops and searches carried out in the year ending 31 March 2013. The number of section 60 stops and searches carried out by police has seen a steep decline over recent years. Between the year ending 31 March 2004 and the year ending 31 March 2008, there was an average of just over 43,000 section 60 stops and searches carried out by police per year. Compared with its peak of 150,174 stops and searches in the year ending 31 March 2009, the number of stops and searches carried out in the year ending 31 March 2014 has fallen by 98%, (or over 145,000) stops and searches.
The large increase seen in the year ending 31 March 2009 coincided with 2 initiatives aimed at reducing knife crime, Operation Blunt 2, launched by the Metropolitan Police Service (MPS) on 19 May 2008, and the Home Office’s Tackling Knives Action Programme, launched in June 2008. This preceded the recent decline in the use of section 60 powers, which has been attributed, in part, to forces using the power in a more focussed way.
Thirty-three forces, including BTP, exercised powers under section 60 of the Criminal Justice and Public Order Act 1994 in the year ending 31 March 2014 compared with 31 forces the previous year. Of the 3,944 section 60 stops and searches, a person was found to be carrying an offensive weapon in 2% (or 71) of cases. Five per cent of all section 60 stops and searches resulted in an arrest, which is the same as the previous year. Although section 60 searches are carried out to identify where persons are carrying offensive weapons or dangerous instruments, over three-quarters of resultant arrests in the year ending 31 March 2014 were for reasons other than carrying an offensive weapon.
Figure 5.2 Number of stops and searches carried out by police under section 60 of the Criminal Justice and Public Order Act 1994, England and Wales1
.
Source: Home Office, Stop and Search table SS.06.
Chart Notes
- Excludes data for BTP.
5.6 Section 47A of the Terrorism Act 2000
Section 47A (as amended by the Protection of Freedoms Act 2012) of the Terrorism Act 2000 (TACT) allows the police to stop and search persons, without reasonable suspicion, in order to prevent acts of terrorism. Searches under this power may only be authorised in a specific area for a defined period where the police reasonably suspect an act of terrorism will take place. Section 47A of TACT stop and search powers replaced similar powers under section 44 to 47 of TACT on 18 March 2011. There has, as yet, been no use of stop and search powers under section 47A of TACT.
Data on long-term trends presented in the stop and search tables combine data for section 44 and section 47A searches. Further information on the background to this change can be found in the user guide.
5.7 Geographical patterns
Thirty-two per cent of all stops and searches carried out in England and Wales were conducted by the Metropolitan Police Service (MPS) in the year ending 31 March 2014, down 4 percentage points from 36% in the previous year. This comprised just under a half (47%) of all section 60 stops and searches and 32% of all section 1 PACE stops and searches.
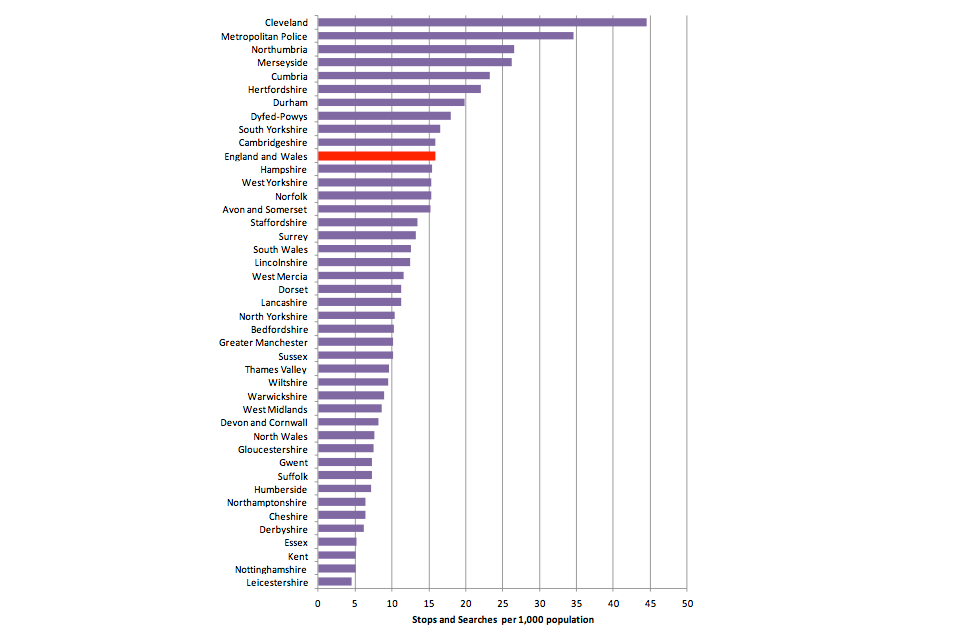
In England and Wales there were 16 stops and searches per 1,000 population in the year ending 31 March 2014. This rate varied from force to force, with Cleveland having the highest rate per 1,000 population with 45 stops and searches, followed by the MPS who recorded 35 stops and searches per 1,000 population. As well as the MPS, northern areas generally saw higher rates of stops and searches than Southern and Midland regions. The lowest rates of stops and searches per 1,000 population were seen across 4 forces. These were Leicestershire, Nottinghamshire, Kent and Essex, who all recorded 5 stops and searches per 1,000 population.
Figure 5.3 Number of stops and searches per 1,000 population by police force area1,2, year ending 31 March 2014
.
Source: Home Office, Stop and Search table SS.08.
Chart Notes
- Population figures for BTP are not available; therefore, this force is excluded.
- City of London is excluded from this analysis due to the small resident population of the area relative to the transient or visiting population.
In the year ending 31 March 2014, 12% of all stops and searches carried out by police in England and Wales led to an arrest. City of London had the highest arrest rate out of all forces, with 23% of all stops and searches leading to a resultant arrest. Forces with the next highest arrest rates were Sussex (17%), the MPS (16%) and Cleveland (16%). Cambridgeshire had the lowest arrest rate at 2%, followed by Cumbria with 3%.
5.8 Ethnic appearance of persons searched
When conducting a stop and search, police are required to ask the person being stopped to define their ethnicity. For the purpose of this analysis, ethnicities are grouped into 6 main categories. These are White, Black (or Black British), Asian (or Asian British), Chinese or Other, Mixed, and Not Stated. A large proportion of all stops and searches are carried out by the MPS (32% in the year ending 31 March 2014). As a result, data from this force can skew the England and Wales total meaning the figures are not representative of England and Wales as a whole. Although data from the MPS show a different picture to that shown across the rest of England and Wales, this must be considered in line with the ethnic breakdown of those who live in and visit areas covered by the MPS. London has a much larger proportion of the population that belong to ethnic minorities than other areas of England and Wales. As a result we may expect to see a larger proportion of ethnic minorities being stopped and searched than in other regions. In the stop and search tables SS.09 and SS.10, data are presented for England and Wales, England and Wales excluding the MPS, and the MPS only.
The ethnic breakdown of those stopped and searched under s1 PACE in the year ending 31 March 2014 has remained similar to the breakdown in the year ending 31 March 2013, with 71% of stops and searches being carried out on those who self-define as White (an increase of 1 percentage point). Eleven per cent self-defined as Black and 8% Asian (both down 1 percentage point). As with the previous year, in the year ending 31 March 2014, 1% self-defined as Chinese or Other and 3% self-defined as Mixed. The remaining people did not state their ethnicity.
The ethnic breakdown of those stopped and searched under section 60 of the Criminal Justice and Public Order Act 1994 shows a different picture to those stopped and searched under s1 PACE. Historically, the number of those stopped under section 60 who self-define as White has been lower than those stopped and searched under s1 PACE. This may be in part down to the fact that the MPS are responsible for a larger proportion of all section 60 searches (47%); however, there are still differences when looking at data for England and Wales excluding the MPS.
Table 5.1 Self-defined ethnicity of those stopped and searched by the MPS and the rest of England and Wales, year ending 31 March 2014
| Percentages | England and Wales | |||||
|---|---|---|---|---|---|---|
| Year ending 31 March 2014 | ||||||
| Legislation | White | Black (or Black British) | Asian or Asian British | Other2 | Not stated | |
| Section 11 | EandW excluding MPS | 84 | 4 | 6 | 3 | 4 |
| Section 11 | MPS | 46 | 27 | 14 | 6 | 6 |
| Section 60 | EandW excluding MPS | 69 | 13 | 6 | 4 | 7 |
| Section 60 | MPS | 25 | 46 | 13 | 8 | 9 |
Source: Home Office, Stop and search tables SS.09.
Table Notes
- Excludes data for South Wales who could not provide complete ethnic breakdowns.
- The ‘Other’ category combines the categories ‘Mixed’ and ‘Chinese or Other’.
In the year ending 31 March 2014, a larger proportion of those stopped and searched under section 60 were Black, compared with stops and searches under section 1 PACE. Data from the MPS show that 46% of all section 60 stops and searches were carried out on those who self-defined as Black, compared to only 27% of s1 PACE searches. The rest of England and Wales also shows a difference, with 13% of all section 60 stops and searches being carried out on those who self-defined as Black, compared to 4% of s1 PACE stops and searches.
This discrepancy between the 2 types of searches has decreased compared with the year ending 31 March 2013. England and Wales as a whole saw 48% of those searched under section 60 to be White and 29% to be Black in the year ending 31 March 2014, compared with 41% White and 36% Black in the year ending 31 March 2013. Across the same period, ethnic breakdowns for s1 PACE stops and searches remained similar.
5.9 Data quality and interpreting the figures
Data presented here have been provided to the Home Office by the 43 territorial police forces in England and Wales. Since the year ending 31 March 2010, BTP have also been providing data to the Home Office. To ensure comparisons are consistent, BTP have been excluded from any comparisons involving data from before the year ending 31 March 2010.
The presented figures are correct at the time of publication and may include revisions submitted by forces for previous years.
Two forces (Dyfed-Powys and South Wales) were unable to categorise the reasons for all of their section 1 PACE stops and searches and subsequent arrests. As a result, they have been excluded from analysis involving offence category breakdowns across these 2 years. They have, however, been included in comparisons involving the total number of stops and searches.
When looking at the ethnic breakdowns of those stopped and searched, the ethnic breakdown of the residential and visiting population of each area must be considered. Areas with higher proportions of ethnic minority residents and visitors are likely to see higher proportions of stops and searches on these groups. This is particularly relevant for the MPS.
The user guide provides further details relating to definitions, legislation and procedure around stop and search.
5.10 Uses of the data
The key user of stop and search statistics is the Ministry of Justice (MoJ), which presents data collated from various government departments and agencies in its biennial statistical publication on race and the criminal justice system. Within the Home Office, the statistics are used by a range of policy advisers, social researchers and economists in order to inform policy and operational decisions by ministers. Additionally, these data are used regularly to answer parliamentary questions tabled by members of parliament.
These statistics are an important part of monitoring the police use of stop and search. They are important in ensuring such powers are used fairly and proportionally, and can inform where the use of stop and search may need to change.
5.11 Other data sources
Quarterly figures for stops and searches conducted in Great Britain under the Terrorism Act 2000 appear in the Home Office series Operation of police powers under the Terrorism Act 2000.
Whilst some ethnic breakdowns are provided here, detailed figures and analysis will continue to be published by the MoJ. The latest edition of its Race and the criminal justice system series was published in November 2013. Figures presented relate to the period up to and including the financial year ending March 2012, and may since have been superseded by figures in this current Police powers and procedures release. The next edition of MoJ’s bulletin, with figures for the financial year ending March 2014, is expected to be published in the autumn of 2015.
6. Road checks
6.1 Introduction
Road checks can be carried out under section 4 of the Police and Criminal Evidence Act 1984 (PACE), for the purpose of ascertaining whether a vehicle is carrying a person who may be of interest to the police. Further details on road checks can be found in the user guide. Data are provided to the Home Office by the 43 territorial police forces in England and Wales. BTP do not provide data on road checks to the Home Office. This section gives information on the number of times this power has been used, including the number of resultant arrests and the total number of vehicles stopped.
6.2 Key findings
In the year ending 31 March 2014, there were 17 road checks carried out by police in England and Wales, 9 fewer than the previous year. This resulted in 2,021 vehicles being stopped which was 39% lower than the year ending 31 March 2013. The average number of vehicles stopped per road check fell from 127 to 119.
Of the 17 road checks that were authorised in the year ending 31 March 2014, 13 were to ascertain whether the vehicle was carrying an individual who had witnessed an indictable offence and 4 were to ascertain whether an individual had committed an indictable offence. There was one arrest that resulted from these road checks and this was not connected to the reason for the road check. Road checks were carried out by a total of 9 forces.
6.3 Data tables
Road check data provided by police forces in England and Wales can be found in the road check tables.
6.4 Data quality and interpreting the figures
Data presented here are correct at the time of publication. There have been no revisions submitted by forces for the years covered by, and received since the previous publication in this series.
Hampshire were unable to provide road check data to the Home Office in the year ending 31 March 2014. A number of other forces were unable to provide data for previous years. See the user guide for further details.
6.5 Uses of the data
The key users of these statistics are Home Office policy advisers, who use them in order to inform policy and operational decisions by ministers.
7. Intimate searches
7.1 Introduction
If a person who is arrested is believed to be concealing Class A drugs, or anything that could be used to cause physical injury, under section 55 of the Police and Criminal Evidence Act 1984, a suitably qualified person may carry out an intimate search. Further details on intimate searches can be found in the user guide. Data here are collected by the Home Office from the 43 territorial police forces in England and Wales. This section includes data on the number of intimate searches carried out by police in England and Wales, as well as details on who conducted the search and why.
7.2 Key findings
There were a total of 73 intimate searches carried out by police in England and Wales in the year ending 31 March 2014. Of these, 67 (or 92%) were carried out by a suitably qualified person. One search was carried out in the presence of a suitably qualified person and 5 were carried out by police officers.
Over 80% of all searches were made in an attempt to find Class A drugs. The remaining searches were conducted to find harmful articles. This is consistent with breakdowns for previous years, where around 80 to 90% of searches were conducted to find Class A drugs. Of these searches, Class A drugs were found in 8% of cases, down 6 percentage points on the year ending 31 March 2013. None of the searches for harmful articles resulted in anything being found.
Intimate searches were carried out by 23 police forces in England and Wales. South Wales conducted the most intimate searches with 15, followed by Surrey who conducted 12.
7.3 Data tables
Data on intimate searches submitted by police forces in England and Wales are available in the intimate searches tables.
7.4 Data quality and interpreting the figures
The figures presented here are correct at the time of publication. There have been no revisions submitted by forces for the years covered by, and received since the previous publication in this series.
The data include intimate searches conducted by 39 police forces. Dorset, Kent, Lincolnshire and Thames Valley were unable to provide any data on intimate searches for the year ending 31 March 2013 and the year ending 31 March 2014. Hampshire and Wiltshire were unable to provide data for the year ending 31 March 2013. Data for these 6 forces have been excluded from any comparison between these 2 years.
The user guide provides further details relating to definitions, legislation and procedure, and data quality.
7.5 Uses of the data
The key users of these statistics are Home Office policy advisers, who use them in order to inform policy and operational decisions by ministers.
8. Fixed penalty notices
8.1 Introduction
Data on fixed penalty notices (FPNs) are collected from the 43 territorial police forces in England and Wales on a calendar-year basis. An FPN is a prescribed financial penalty issued to a motorist as an alternative to facing prosecution for a range of motoring offences. They may be endorsable, meaning they are accompanied by points on a driving licence, or non-endorsable, where no points are added to a driving licence. This section covers the use of police powers to issue FPNs for motoring offences. It looks at FPNs by offence type and outcome, including whether the fine was paid or whether it was registered in court.
From June 2012, PentiP, a new national system designed to process FPNs, was introduced in police forces across England and Wales, replacing the Vehicle Procedures and Fixed Penalty Office (VP/FPO) system. VP/FPO data were supplied to the Home Office by individual police forces and are presented for the years 2003 to 2011. Data for all forces are centrally collected and extracted from the PentiP system for 2011 onwards. Caution must be taken when comparing the 2 data sources. PentiP data are slightly lower than equivalent data taken from VP/FPO data.
The user guide contains further information relating to definitions, legislation, procedure and the change to PentiP.
8.2 Key findings
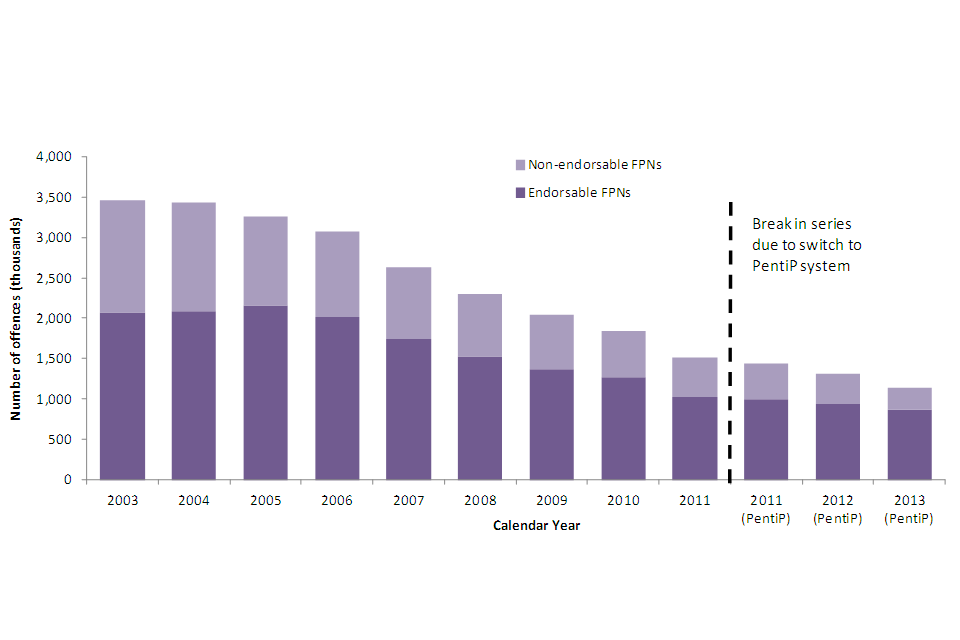
There were 1.15 million FPNs for motoring offences issued by the police (including police-employed traffic wardens) in 2013, a fall of 13% compared with 2012. Since peaking at 3.5 million in 2003, there have been year-on-year decreases in the total number of FPNs issued. Caution must be taken when comparing figures over time, as from 2011, FPNs were recorded using a new system (PentiP), which showed some differences with the existing system (see the user guide for details).
Seventy-six per cent of FPNs issued were endorsable and 24% were non-endorsable. The number of endorsable FPNs issued fell by 8% in 2013 compared with 2012, while the number of non-endorsable FPNs issued fell by 24% over the same period.
In 2013, the most common motoring offence for which an FPN was issued was speeding offences, which accounted for 62% of all FPNs issued by police in England and Wales. This is a higher proportion than in previous years.
When an individual is issued with an FPN, the fine may be paid, or it may be registered in court. In 2013, the fine was paid in 95% of all cases involving FPNs for motoring offences, up 3 percentage points on the previous year.
Figure 8.1 Number of endorsable and non-endorsable FPNs issued for motoring offences in England and Wales, 2003 to 2013
.
Source: Home Office, fixed penalty notice table FPN.01.
8.3 Data tables
Data on FPNs for the 43 territorial police forces in England and Wales are presented in the fixed penalty notice tables.
8.4 FPNs by offence type
The most common motoring offence for which FPNs were issued was speed limit offences, which account for 62% of all FPNs. This is a higher proportion that the previous 2011 and 2012, where speed limit offences accounted for 51% and 56% of all FPNs respectively. Since 2003, speed limit offences have accounted for the majority of FPNs issued for motoring offences. They have followed a similar pattern to the overall trend in FPNs, showing year-on-year falls in the number issued since 2005.
Most offence types saw a fall in the number of FPNs issued, most notably ‘use of a handheld mobile phone while driving’, which fell by 43% and ‘obstruction, waiting and parking offences’, which saw a 42% fall. In numerical terms, this was a fall of around 40,000 FPNs for both of these offence categories. Three offence categories saw an increase in the number of FPNs issued. These were ‘lighting and noise offences’, up 20%, ‘vehicle test and condition offences’, up 2% and ‘careless driving offences (excluding the use of a handheld mobile phone while driving)’, up 2%.
8.5 FPN outcomes
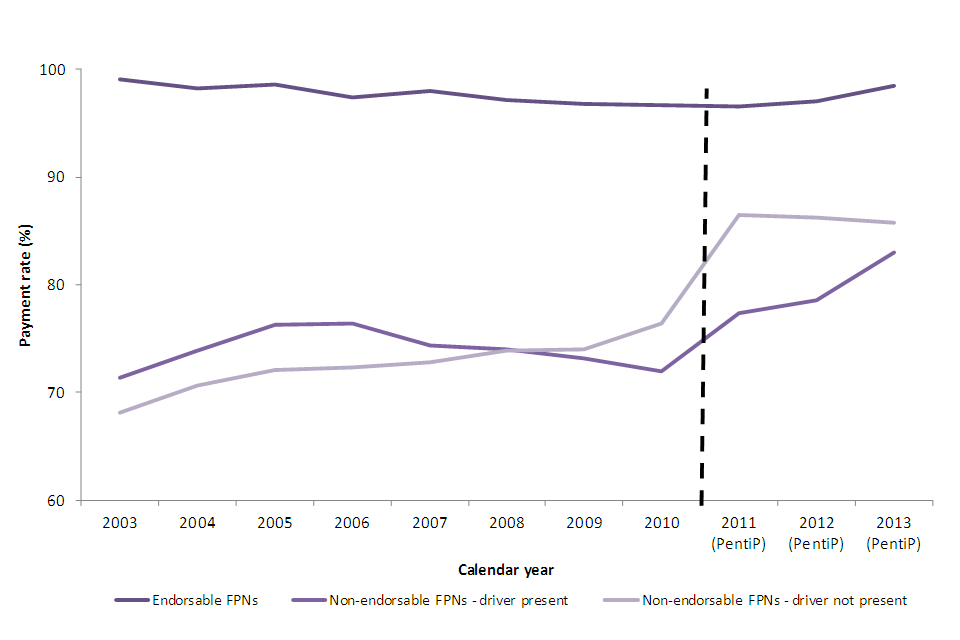
This section provides details on FPN payment rates and the number of FPNs issued as a result of evidence from camera devices. Payment rates from 2011 onwards are taken from PentiP and are not directly comparable to previous years. This is due to the fact that PentiP does not record where FPNs have been referred for court proceedings and those for which there were no further action.
When an individual is issued with an FPN, they may pay the fine, or alternatively a fine may be registered in court. In 2013, the fine was paid in 95% of cases (3 percentage points higher than the previous year). The remaining 5% of cases saw the fine registered in court. Payment rates have been relatively stable since 2003 at nearly 90%.
FPNs are more likely to be paid for endorsable offences than for non-endorsable offences. In 2013 the payment rate for endorsable offences was 98%. This compares with an 83% payment rate in non-endorsable cases where the driver was present and 86% of non-endorsable cases where the driver was not present.
Data on payment rates for FPNs should be seen in the context of large falls in FPNs issued over the last 10 years, which may impact on payment rates. Most notably, the total number of non-endorsable FPNs issued where the driver was absent has fallen by 56% since 2011.
Since 2003, payment rates have remained relatively stable for endorsable FPNs (between 97% and 99%). Payment rates for non-endorsable offences have fluctuated more, but have increased in recent years.
Figure 8.2 FPN payment rate by type of FPN, England and Wales, 2003 to 2013
.
Source: Home Office, fixed penalty notice table FPN.05.
There were 654,820 camera-detected traffic light and speeding offences in 2013, a 1% increase on the previous year. The majority of these (93%) were for speeding offences, with the remaining being for neglect of traffic directions (i.e. traffic lights). Cameras provided evidence for 86% of all speeding offences issued in 2013, up from 84% in 2012.
8.6 Data quality and interpreting the figures
PentiP figures are generally slightly lower than equivalent figures from VP/FPO, and this should be considered when comparing data from the 2 systems, particularly in relation to FPN payment rates. Further information on the differences between VP/FPO and PentiP can be found in the user guide.
Data relating to the failure to hold an operator’s licence and work record or employment offences (relating to the failure of employers or employees to observe limits on driving time) are presented only from 2011 onwards. There were just over 6,000 FPNs issued in relation to these offence groups in 2013; since these represent less than 1% of the total FPNs issued in England and Wales, these categories have been included in long-term trend analysis.
Instead of offering an FPN to those who exceed the speed limit but do not require prosecution, forces can use their discretion to offer a speed awareness course. Those who accept the offer and complete the course, at their own expense, are not subject to any other sanction. The majority of forces in England and Wales now offer such courses. These initiatives should be considered when interpreting changes over time, especially in recent years. In addition, similar initiatives are gradually being introduced for persons found to be committing other offences, for example seatbelt awareness courses. Again, these should be considered when interpreting changes in FPNs over time.
The user guide provides further details relating to definitions, legislation and procedure, and data quality.
8.7 Potential uses of the data
Data on FPNs issued for motoring offences, when analysed alongside data on road traffic collisions and fatalities (collected by the Department for Transport) and data on prosecutions for motoring offences (collected by the MoJ), provide a detailed picture of road safety and levels of road crime enforcement in England and Wales each year. This information allows colleagues in all 3 departments to inform policy and operational decisions by government ministers. Additionally, these data are used to answer parliamentary questions tabled by members of parliament and members of the House of Lords.
8.8 Other data sources
In addition to FPNs for motoring offences, police officers can also issue FPNs for minor disorder offences under the Penalty Notice for Disorder (PND) scheme, which includes possession of cannabis, alcohol consumption and licensing offences. Data on PNDs are collected and published by the MoJ in its Criminal justice statistics quarterly, which also contains figures on court proceedings for motoring offences.
9. Breath tests
9.1 Introduction
This section covers the use of police powers, under the Road Traffic Act 1988, to conduct breath tests at the roadside (or similar location) to determine whether motorists are driving with alcohol in their body, beyond the prescribed limit. It examines the regional and seasonal use of such powers, as well as the number of motorists who either fail or refuse breath tests. If a person refuses a breath test, police may deal with this in the same way, and the individual may be subject to the same penalties as someone who fails a breath test. The statistics presented in this chapter are provided to the Home Office by the 43 territorial police forces in England and Wales, and are on a calendar-year basis. BTP do not provide data on breath tests to the Home Office. The data relate only to preliminary roadside breath tests (hereafter referred to as ‘breath tests’) which are conducted to give an indication of whether motorists are driving over the limit, and not the subsequent evidential tests.
Further details relating to definitions, legislation and procedure are given in the user guide.
9.2 Key findings
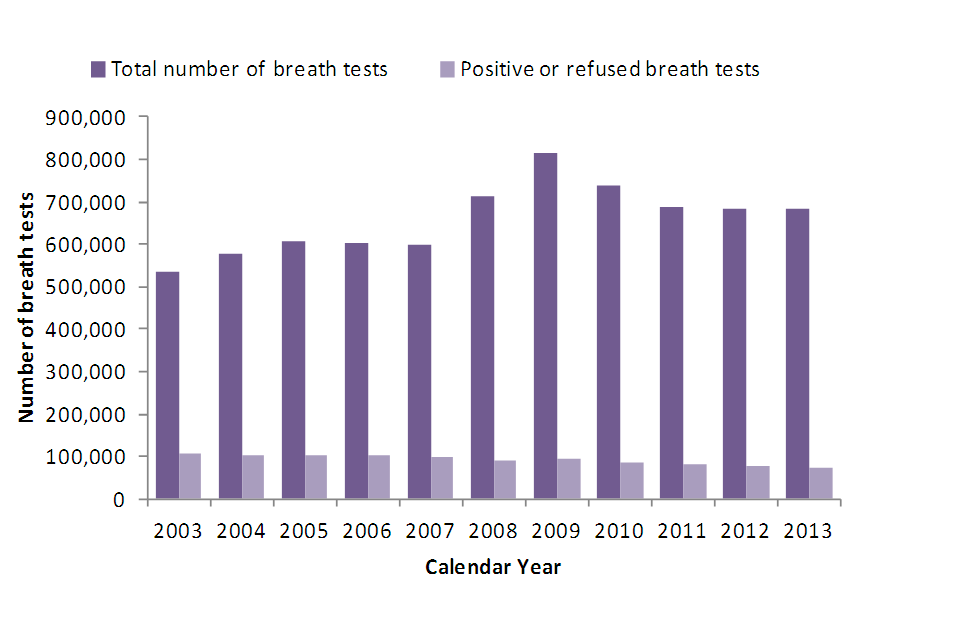
Police carried out 683,631 breath tests in 2013, similar to the 686,346 carried out in 2012. The number of breath tests carried out by police in England and Wales has remained relatively stable since 2011 after falling from a peak of 815,290 breath tests in 2009.
The proportion of positive or refused breath tests has gradually fallen from 20% in 2003 to 11% in 2009 when it began to stabilise, remaining at around 10 to 12% year on year. The cause of the initial fall may be the under-reporting of the positive or refused breath test to the Home Office (see section on data quality and interpreting the figures).
Figure 9.1 Number of breath tests and number positive or refused, carried out by police in England and Wales, 2003 to 2013
.
Source: Home Office, Breath test table, BT.03.
9.3 Data tables
Data on breath tests carried out by the 43 territorial police forces in England and Wales are presented in the breath test tables.
9.4 Seasonal variation
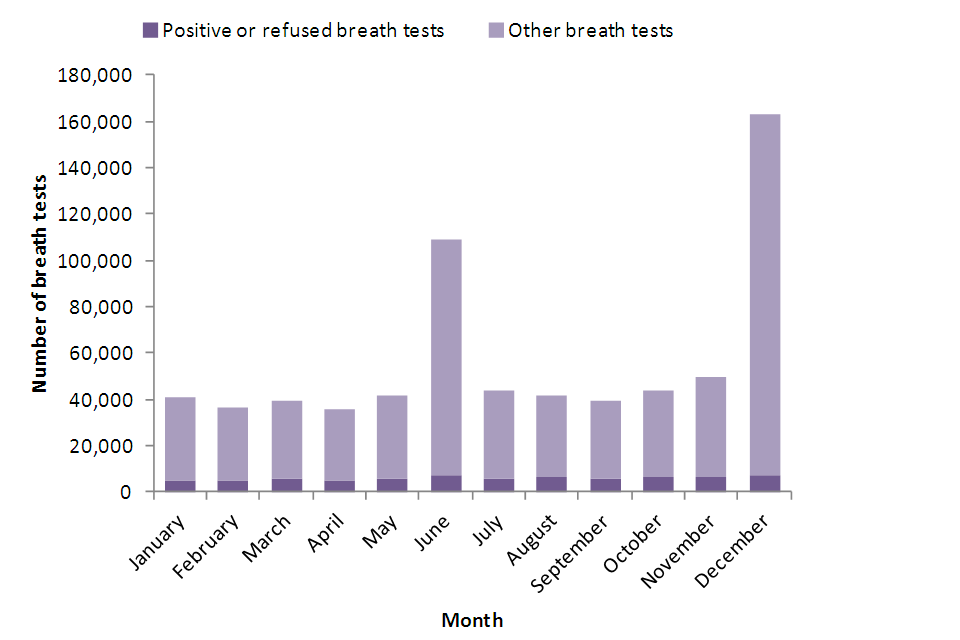
The month with the highest number of breath tests conducted in 2013 was December when 162,943 breath tests were carried out; this equates to 24% of all breath tests in 2013 and coincides with the annual national Christmas drink and drug driving campaign. The second highest number of breath tests were carried out in June, with 108,592, which accounted for a further 16% of all breath tests in 2013. This is likely to be due to police campaigns against drinking and drug driving during the summer months.
Excluding the two peaks in June and December, the number of breath tests in each month ranged from around 36,000 to 50,000 with an average of approximately 41,000 tests. The number of tests carried out in June (108,592) was more than double, and in December (162,943) was almost quadruple, the average of the other months.
Despite the much higher numbers of breath tests in June and December, the number of positive or refused tests as a proportion of total tests was lower in June (6%) and December (4%), than the average of the other 10 months (14%).
Figure 9.2 Number of breath tests carried out by police in England and Wales, by month, 2013
.
Source: Home Office, Breath test data table, BT.04.
9.5 Geographical pattern
In 2013, 12 breath tests were conducted per 1,000 population across England and Wales. The rate for Wales (29 per 1,000 population) was just below 3 times that for England (11 per 1,000 population). There was a large variation in the number of tests carried out per 1,000 of the population by individual police forces, from 4 per 1,000 population in Avon and Somerset to 52 in Dyfed-Powys and 62 per 1,000 population in North Wales.
The number of breath tests per 1,000 population that were positive or refused averaged around 1 throughout England and Wales, though were not as varied as the total number of breath tests at police force level. The rate of positive or refused tests ranged from less than 1 per 1,000 population in Avon and Somerset to 4 per 1,000 population in Cambridgeshire.
9.6 Data quality and interpreting the figures
The presented figures are correct at the time of publication. There was one revision received from Lincolnshire for 2012 since the previous publication in this series. Further details relating to this can be found in the revisions analysis section of the bulletin.
A breath alcohol screening test can be required when a driver involved in a collision is suspected of driving with alcohol in the body or following the commission of a moving traffic offence. Results of breath alcohol screening tests can only be regarded as indicative of the level of alcohol present in a sample of breath and are not used to determine whether a driver was above or below the legal limit to drive. It remains the case that it is only at a police station or hospital that a specimen(s) can be obtained to determine a person’s actual alcohol concentration, using pre-calibrated evidential devices ensuring the sample has not been affected by any interfering substances, or that blood or urine specimens may be taken for subsequent laboratory analysis. These subsequent evidential tests are not included in the breath test statistics.
From April 2008, new digital recording equipment started to be used by forces. The devices are able to record exact breath alcohol readings and the result of individual tests, as well as reason for test, time of day, day of week and age and sex profiles of those tested, and results are downloaded to data systems on a monthly basis and provided to the Department for Transport (DfT).
Data presented here have been sourced from annual statistical returns received from the 43 police forces in England and Wales. By 2011, a large number of police forces in England and Wales had been making greater use of the digital breath test devices, in comparison to previous years. However, the manual recording systems are still being used by some police forces. The figures presented here are based on the combined results of both systems. Negative breath tests may previously have been under-reported to the Home Office and it has been previously anticipated that, as more forces used data from the digital devices, it would lead to further improvements in data recording practices by forces. This appears to have been reflected in the decrease in the proportion of positive or refused tests of total breath tests, since the beginning of 2008.
The user guide provides further details relating to data quality and interpreting the figures.
9.7 Other data sources
Analysis of reported roadside breath alcohol screening tests, based on data from digital breath testing devices, is published by the Department for Transport (DfT). Latest figures were included within the DfT’s Reported Road Casualties in Great Britain: 2013 Annual Report.
The National Police Chiefs Council (NPCC), formerly the Association of Chief Police Officers (ACPO) publishes an annual press release showing the number of persons who were required to take a breath test during the Christmas drink and drug driving campaign. The latest release, covering December 2013, is available online at: NPCC press release. It should be noted that the NPCC data cover the whole of the UK, not just England and Wales, so are not directly comparable to Home Office figures.
10. Revisions analysis
This section gives some general information about data revisions between releases. Where major changes are made, they are outlined in tables below.
10.1 Arrests
Since the last publication, Derbyshire have revised their arrests data for the year ending 31 March 2013 and North Wales have revised their arrests data for the year ending 31 March 2012 and 31 March 2013. Derbyshire’s data in the previous publication were lower than they should have been due to some issues with the force’s recording system. North Wales under-reported the number of arrests in these years at the time of the last publication. They have, however, resubmitted correct figures since then. The table below shows the difference in the number of arrests between the 2 publications.
Arrests for notifiable offences, years ending 31 March 2012 and 31 March 2013
| Force | Last publication | This publication | Difference + or - |
|---|---|---|---|
| Derbyshire year ending 31 Mar 2013 | 13,293 | 16,234 | 2,941 |
| North Wales year ending 31 Mar 2012 | 17,016 | 18,392 | 1,376 |
| North Wales year ending 31 Mar 2013 | 14,329 | 15,579 | 1,250 |
| England and Wales year ending 31 Mar 2012 | 1,224,241 | 1,225,617 | 1,376 |
| England and Wales year ending 31 Mar 2013 | 1,072,068 | 1,076,259 | 4,191 |
10.2 Detentions
There have been no recent revisions to the data in this section.
10.3 Stops and searches
Since the last publication, Avon and Somerset have resubmitted section 1 stop and search data for the year ending 31 March 2013. Cambridgeshire and Cheshire have resubmitted section 1 stop and search data, for the years ending 31 March 2012 and 31 March 2013. This was because their previous submission for this period was found to be missing a number of stops and searches. These are now included in the figures. The tables below show the difference in the number of section 1 stops and searches, and resultant arrests between the 2 publications.
Searches of persons or vehicles under section 1 of the Police and Criminal Evidence Act 1984 and other legislation, years ending 31 March 2012 and 31 March 2013
| Force | Last publication | This publication | Difference + or - |
|---|---|---|---|
| Avon and Somerset year ending 31 Mar 2013 | 30,514 | 32,710 | 2,196 |
| Cambridgeshire year ending 31 Mar 2012 | 16,857 | 17,606 | 749 |
| Cambridgeshire year ending 31 Mar 2013 | 15,958 | 16,808 | 850 |
| Cheshire year ending 31 Mar 2012 | 3,593 | 7,904 | 4,311 |
| Cheshire year ending 31 Mar 2013 | 2,035 | 4,998 | 2,963 |
| England and Wales year ending 31 Mar 2012 | 1,127,172 | 1,132,232 | 5,060 |
| England and Wales year ending 31 Mar 2013 | 995,981 | 1,001,990 | 6,009 |
Arrests resulting from searches of persons or vehicles under section 1 of the Police and Criminal Evidence Act 1984 and other legislation, years ending 31 March 2012 and 31 March 2013
| Force | Last publication | This publication | Difference + or - |
|---|---|---|---|
| Avon and Somerset year ending 31 Mar 2013 | 1,172 | 2,150 | 978 |
| Cambridgeshire year ending 31 Mar 2012 | 613 | 706 | 93 |
| Cambridgeshire year ending 31 Mar 2013 | 239 | 450 | 211 |
| Cheshire year ending 31 Mar 2012 | 401 | 805 | 404 |
| Cheshire year ending 31 Mar 2013 | 204 | 450 | 246 |
| England and Wales year ending 31 Mar 2012 | 107,095 | 107,592 | 497 |
| England and Wales year ending 31 Mar 2013 | 104,116 | 105,551 | 1,435 |
10.4 Road checks
There have been no recent revisions to the data in this section.
10.5 Intimate searches
There have been no recent revisions to the data in this section.
10.6 Fixed penalty notices
There have been no recent revisions to the data in this section.
10.7 Breath tests
Since the last publication, Lincolnshire have revised their figures for 2012. Previously the force was missing some data, but has since been able to provide estimates for the missing data.
Number of breath tests conducted and number of positive/refused breath tests, 2012
| Force | Last publication | This publication | Difference + or - |
|---|---|---|---|
| Lincolnshire breath tests (2012) | 10,541 | 14,329 | 3,788 |
| Lincolnshire positive or refused (2012) | 738 | 1,049 | 311 |
| England and Wales breath tests (2012) | 682,558 | 686,346 | 3,788 |
| England and Wales positive or refused (2012) | 75,868 | 76,179 | 311 |