National curriculum assessments at key stage 1 and phonics screening checks in England, 2018
Updated 25 October 2019
Applies to England

© Crown copyright 2019
This publication is licensed under the terms of the Open Government Licence v3.0 except where otherwise stated. To view this licence, visit nationalarchives.gov.uk/doc/open-government-licence/version/3 or write to the Information Policy Team, The National Archives, Kew, London TW9 4DU, or email: psi@nationalarchives.gov.uk.
Where we have identified any third party copyright information you will need to obtain permission from the copyright holders concerned.
This publication is available at https://www.gov.uk/government/statistics/phonics-screening-check-and-key-stage-1-assessments-england-2018/national-curriculum-assessments-at-key-stage-1-and-phonics-screening-checks-in-england-2018
1. Introduction
1.1 27 September 2018
These statistics cover the attainment of pupils in the 2018 phonics screening check and key stage 1 national curriculum teacher assessments (TA).
Pupils take the phonics screening check at the end of year 1 (typically aged 6); pupils who do not meet the expected standard take the check again at the end of year 2 (typically aged 7).
Pupils are assessed at the end of key stage 1 (year 2) in reading, writing, maths and science. Pupils take tests (commonly referred to as SATs) in reading and maths and receive a teacher assessment (TA) in reading, writing, maths and science. We report only on TA in these statistics because test data is not submitted to the Department.
This statistical publication provides 2018 phonics screening check and key stage 1 teacher assessment results for pupils in schools in England at national, regional and local authority level based on provisional data.
The following tables are included in this publication:
- Phonics national and local authority tables (.xlsx and .ods)
- KS1 national and local authority tables (.xlsx and .ods)
- Underlying data (.csv and metadata .txt)
The accompanying methodology document provides information on the data sources, their coverage and quality and explains the methodology used in producing the data.
All percentage point differences and attainment gaps are calculated using unrounded figures.
1.2 More pupils meet the expected standard in phonics in year 1
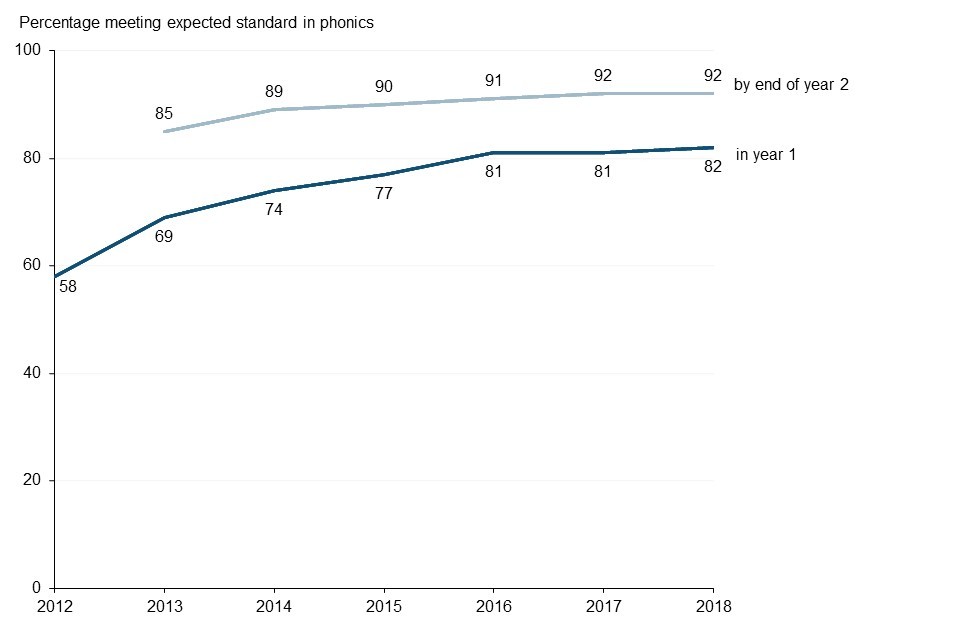
Figure 1: Percentage of pupils who met the expected standard in phonics
England, 2012-2018 (all schools)
Percentage of pupils who met the expected standard in phonics England, 2012-2018 (all schools)
Source: Provisional phonics data (2018) and final phonics data (2012 to 2017)
More than 4 in 5 pupils (82%) met the expected standard in the phonics screening check in year 1, a 1 percentage point increase from 2017. By the end of year 2, more than 9 in 10 pupils (92%) met the standard, the same proportion as in 2017.
The expected standard is a minimum mark of 32 out of 40 in the phonics screening check.
1.3 Attainment in key stage 1 teacher assessments is broadly similar to 2017
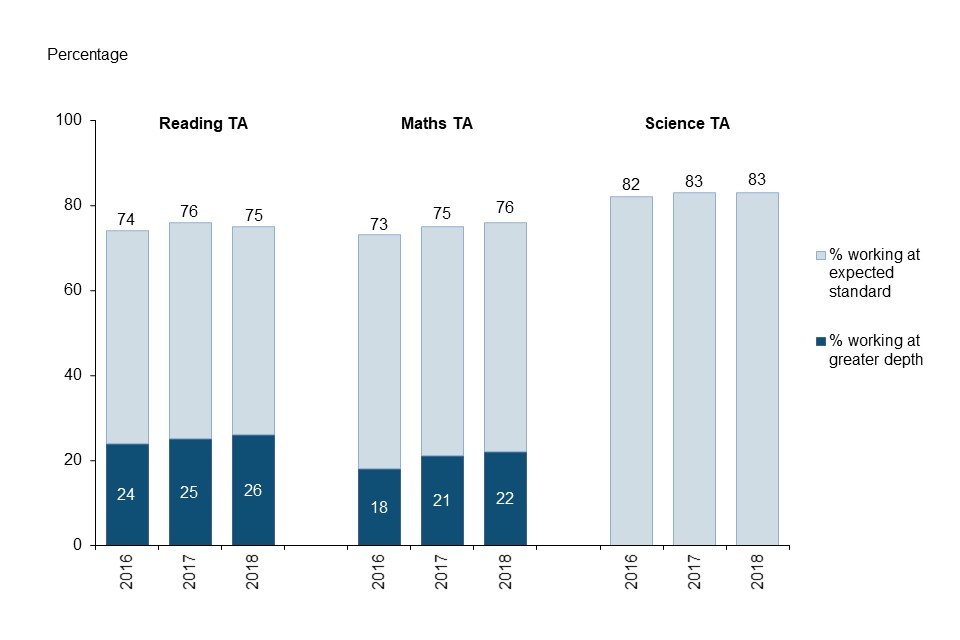
Figure 2: Percentage of pupils who met the expected standard in key stage 1 teacher assessments
England, 2016-2018 (all schools)
Percentage of pupils who met the expected standard in key stage 1 teacher assessments England, 2016-2018 (all schools)
Source: Provisional KS1 data (2018) and final KS1 data (2016 to 2017)
In maths TA, attainment at the expected standard increased by 1 percentage point to 76%. Attainment in reading TA and science TA remained the same compared to 2017. The change in reading TA was less than 0.5 percentage points using unrounded data, so is rounded to zero.
In writing TA , 70% of pupils reached the expected standard. Changes made within the 2017/18 writing TA frameworks mean judgements made in 2018 are not directly comparable to those made using the previous interim frameworks in 2016 and 2017.
2. Phonics attainment
2.1 National phonics attainment
Table 1 shows the proportion of pupils who met the phonics standard by the end of year 2, compared to the proportion of pupils in their year group who met the standard while in year 1.
82% of pupils met the expected standard in the phonics screening check at the end of year 1, an increase of 25 percentage points since the introduction of the check in 2012. The proportion of pupils who met the expected standard in phonics in year 1 has increased year-on-year from 58% in 2012 to 82% in 2018. If applied to the 2018 cohort size, this increase would equate to an additional 163,000 pupils meeting the expected standard. This is calculated as follows: if the same proportion of pupils met the expected standard in 2018 as in 2012, 384,994 pupils would have met the standard. The difference between this figure and the number of pupils who met the standard in 2018 (548,151) is 163,000, rounded to the nearest thousand.
1,268 schools had at least 95% of pupils achieving the phonics standard in year 1 in 2018, more than in 2017 (1,076). These figures exclude schools with fewer than 11 pupils.
The percentage of pupils who met the expected standard in phonics by the end of year 2 was 92% in 2018, the same proportion as in 2017.
Table 1: Percentage of pupils who met the expected standard in phonics
| Percentage meeting the expected standard: England, 2018 (All schools) | in year 1 | by end of year 2 | Change from year 1 to year 2 |
|---|---|---|---|
| 2018 | 82% | 92% | +11 |
| 2017 | 81% | 92% | +11 |
| 2016 | 81% | 91% | +14 |
| 2015 | 77% | 90% | +16 |
| 2014 | 74% | 89% | +20 |
| 2013 | 69% | 85% | +27 |
| 2012 | 58% |
Source: Provisional phonics data (2018) and final phonics data (2012 to 2017)
Phonics screening check
The phonics screening check is a statutory assessment for all pupils in year 1 (typically aged 6) to check whether they have met the expected standard in phonic decoding. All state-funded schools with a year 1 cohort must administer the check. Those pupils who did not meet the standard in year 1 or who were not checked, must take part in the check at the end of year 2 (typically aged 7).
Teachers administer the check one-on-one with each pupil and record whether their response to each of the 40 words is correct. Each pupil is awarded a mark between 0 and 40 and in 2018, as in previous years, the threshold to determine whether a pupil had met the expected standard is 32. Since 2014, this threshold mark has not been communicated to schools until after the screening check has been completed, however its year-on-year stability means it is predictable.
2.2 Phonics mark distribution
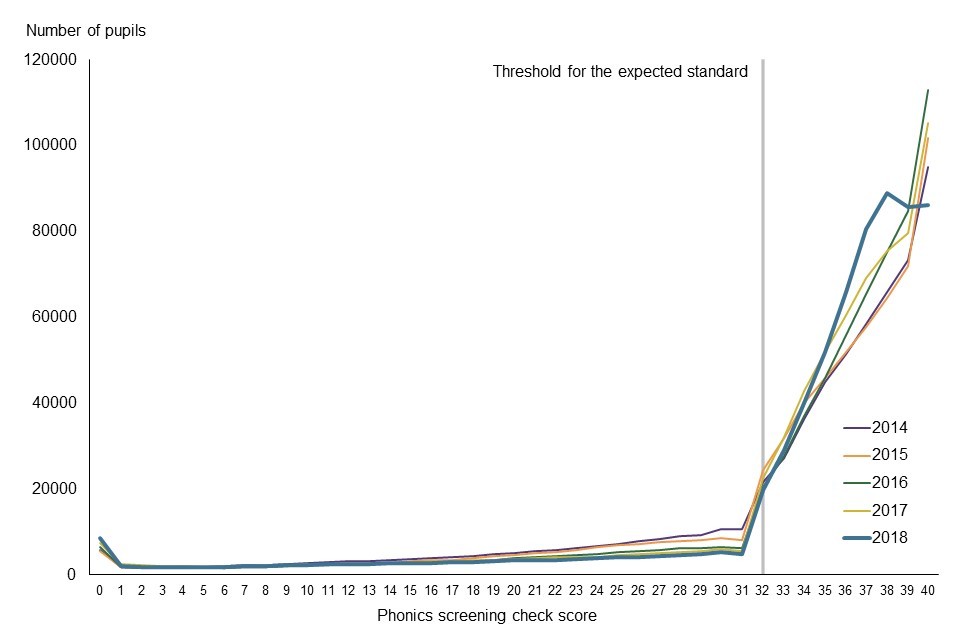
In 2018, 13% of year 1 pupils who took the test achieved full marks (40), a decrease of 3 percentage points from 2017. Any change in the percentage of pupils achieving full marks is influenced by changes in the difficulty of the test, as well as the ability of the cohort. The standard required to achieve 40 marks is not exactly equivalent year-on-year because the standard is anchored at the expected standard (currently 32 marks). Figure 3 shows the distribution of marks in the check in 2018, compared to the four previous years. In 2018, the mean mark is 34 and the median is 37.
Figure 3: Year 1 phonics screening check mark distribution
England, 2014-2018 (All schools)
Year 1 phonics screening check mark distribution England, 2014-2018 (All schools)
Source: Provisional phonics data (2018) and final phonics data (2014 to 2017)
2.3 Phonics attainment by school characteristics
The percentage of pupils who met the expected standard in local authority maintained mainstream schools was 83% in 2018. More pupils met the expected standard in mainstream free schools (88%) than in other types of school, although the number of free schools is much smaller . More pupils met the expected standard in mainstream converter academies (84%) than in mainstream sponsored academies (80%).
This reflects that many sponsored academies were low performing schools before becoming an academy, and converter academies were usually high performing schools before becoming an academy.
There were 11,624 LA maintained schools, 1,182 sponsored academies, 2,821 converter academies and 177 free schools in the phonics year 1 data in 2018.
2.4 Phonics attainment by pupil characteristics
Figure 4 shows the attainment gaps in 2018 by gender, free school meal (FSM) eligibility, first language and special educational needs (SEN) provision.
Figure 4: Attainment gaps by pupil characteristics at the expected standard in phonics in year 1
| Percentage meeting the expected standard in year 1: England, 2018 (All state-funded schools) | 2018 |
|---|---|
| Boys | 79% |
| Girls | 86% |
| FSM | 70% |
| All other pupils | 84% |
| English | 83% |
| First language other than English | 82% |
| All SEN pupils | 44% |
| No identified SEN | 89% |
Source: Provisional phonics data (2018)
A greater proportion of girls continue to meet the phonics standard, with 86% of girls and 79% of boys meeting the standard in year 1 in 2018. The attainment gap remained the same as in 2017, at 7 percentage points.
In 2018, 70% of pupils eligible for free school meals (FSM) met the expected standard, compared to 84% of all other pupils. The gap between pupils eligible for FSM and all other pupils is 14 percentage points, and remains the same compared to 2017.
In 2018 there was no difference in the attainment of pupils whose first language is English (83%) and pupils with a first language other than English (82%).
The largest pupil characteristics attainment gap is between pupils with special educational needs (SEN) and those with no identified SEN, with less than half of pupils with SEN meeting the standard (44%) and 89% of pupils with no identified SEN meeting the expected standard. The gap between these groups remained at 44 percentage points.
Figure 5 shows the attainment of pupils by ethnic group. As in previous years, more Chinese and Indian pupils met the expected standard than pupils of other ethnic groups, with Irish traveller and Gypsy/Roma pupils least likely to meet the standard.
Figure 5: Percentage of pupils who met the expected standard in phonics at year 1 by ethnic group
| Percentage meeting the expected standard in year 1: England, 2018 (All state-funded schools) | 2018 |
|---|---|
| Gypsy/Roma | 42% |
| Traveller of Irish heritage | 43% |
| White and black Caribbean | 79% |
| Black Caribbean | 80% |
| Any other white background | 81% |
| Pakistani | 82% |
| Any other black background | 83% |
| Bangladeshi | 83% |
| Irish | 83% |
| White British | 83% |
| White and black African | 84% |
| Black African | 85% |
| Any other mixed background | 85% |
| Any other Asian background | 87% |
| White and Asian | 88% |
| Indian | 90% |
| Chinese | 91% |
Source: Provisional phonics data (2018)
When results are broken down by ethnic group, gender and free school meal (FSM) eligibility, the lowest attaining group is white boys eligible for free school meals, with only 62% of these pupils meeting the standard. There was a 2 percentage point increase in attainment among this group compared to 2017. The highest performing group is Chinese girls not eligible for FSM.
Attainment by birth month shows a 13 percentage point gap between pupils born in August (the youngest in their year) and in September (the oldest), 1 percentage point smaller than the gap in 2017. In 2018, 75% of August-born pupils met the expected standard in year 1 compared to 89% of September-born pupils. The gap becomes smaller by the end of year 2, at 6 percentage points.
Characteristics definitions
There were no changes to characteristics definitions in 2018, but there have been changes to some definitions in previous years. See the methodology document for the definitions used. Data on disadvantaged pupils will be added to the tables in December 2018, when this data becomes available.
3. Key stage 1 teacher assessments
3.1 National key stage 1 attainment
In maths TA, attainment at the expected standard increased by 1 percentage point to 76%. Attainment in reading TA and science TA remained the same compared to 2017.
In 2018, 26% of pupils were working at greater depth in reading TA and 22% in maths TA.
In writing TA, 70% of pupils reached the expected standard and 16% of pupils were working at greater depth in 2018. Changes made within the 2017/18 writing TA frameworks mean judgements in 2018 are not directly comparable to those made using the previous interim frameworks in 2016 and 2017. In 2017, 68% of pupils met the expected standard in writing TA. In 2016, this figure was 65%.
Attainment remained lowest in writing TA, at 70%, and highest in science TA, at 83%.
Table 2: Attainment in KS1 teacher assessments by subject
Changes made within the 2017/18 writing TA frameworks mean judgements made in 2018 are not directly comparable to those made using the previous interim frameworks in 2016 and 2017.
| Percentage reaching the expected standard and percentage point change: England, 2016-2018 (All schools) | 2016 | 2017 | 2018 | Change from 2016 to 2017 | Change from 2017 to 2018 |
|---|---|---|---|---|---|
| Reading TA | 74% | 76% | 75% | +2 | 0 |
| Writing TA | 65% | 68% | 70% | +3 | Not comparable |
| Maths TA | 73% | 75% | 76% | +3 | +1 |
| Science TA | 82% | 83% | 83% | +1 | 0 |
Source: Provisional KS1 data (2018) and final KS1 data (2016 to 2017)
Key stage 1 assessments
Teacher assessment judgments in reading, writing, maths and science are reported for each pupil at the end of key stage 1 (typically aged 7). Teacher assessments are based on a broad range of evidence from across the curriculum and knowledge of how a pupil has performed over time and in a variety of contexts. Pupils are required to take tests in reading and maths at the end of key stage 1, however teacher assessment is the only data used by the Department of Education.
New key stage 1 assessments were introduced in 2016 to assess the new, more challenging national curriculum and the expected standard was raised. As a result, figures from 2016 onwards are not comparable to earlier years.
Changes were made within the 2017/18 writing TA frameworks, which means that judgements in 2018 are not directly comparable to those made using the previous interim frameworks in 2016 and 2017.
3.2 Key stage 1 attainment by school characteristics
Table 3 shows the attainment of pupils in KS1 teacher assessments by school type.
Attainment in local authority maintained mainstream schools and mainstream ‘academies and free schools’ as a group is similar. However, grouping academies and free schools together masks variation between the different types of school within this group.
More pupils reached the expected standard in free schools in all subjects than in other types of school, although the number of free schools (159) is much smaller. More pupils reached the expected standard in converter academies than in sponsored academies in all subjects. This reflects that many sponsored academies were low performing schools before becoming an academy, and converter academies were usually high performing schools before becoming an academy.
Table 3: Attainment in KS1 teacher assessments at the expected standard or above by school type
| Percentage reaching the expected standard: England, 2018 (Mainstream schools) | No. schools | Reading TA | Writing TA | Maths TA |
|---|---|---|---|---|
| LA maintained schools | 11,639 | 76% | 71% | 77% |
| Academies and free schools | 4,157 | 76% | 70% | 77% |
| Converter academies | 2,822 | 77% | 72% | 78% |
| Sponsored academies | 1,176 | 71% | 66% | 73% |
| Free schools | 159 | 81% | 75% | 81% |
Source: Provisional KS1 data (2018)
3.3 Key stage 1 attainment by pupil characteristics
Changes made within the 2017/18 writing TA frameworks mean that judgements made in writing in 2018 are not directly comparable to those made using the previous interim frameworks in 2016 and 2017.
More girls reached the expected standard than boys in all KS1 TA subjects. The subject with the largest difference in attainment by gender continued to be writing, with a gap of 13 percentage points between girls (77%) and boys (63%). The gender attainment gap was 9 percentage points in reading, with 80% of girls and 71% of boys reaching the standard. The gap was narrowest for maths at 2 percentage points, where 77% of girls reached the standard compared to 75% of boys. These gaps all remained the same in 2018 compared to 2017.
Figure 6: Gender attainment gaps at the expected standard in KS1 teacher assessments
| Percentage reaching the expected standard: England, 2018 (All schools) | Boys | Girls |
|---|---|---|
| Reading TA | 71% | 80% |
| Writing TA | 63% | 77% |
| Maths TA | 75% | 77% |
Source: Provisional KS1 data (2018)
Table 4 shows the attainment gaps between pupils eligible for free school meals (FSM) and all other pupils. In 2018, the attainment gap was 18 percentage points in reading and maths and 20 percentage points in writing. The gap increased by 1 percentage point in writing and remained the same in maths and reading.
Table 4: Attainment in KS1 teacher assessments by pupil FSM eligibility
Changes made within the 2017/18 writing TA frameworks mean judgements made in 2018 are not directly comparable to those made using the previous interim frameworks in 2016 and 2017.
| Percentage reaching the expected standard and attainment gaps in percentage points: England, 2016-2018 (All state-funded schools) | FSM pupils | Other pupils | All pupils | Attainment gap | Change in attainment gap |
|---|---|---|---|---|---|
| Reading TA | |||||
| 2018 | 60% | 78% | 75% | 18 | 0 |
| 2017 | 61% | 78% | 76% | 17 | 0 |
| 2016 | 60% | 77% | 74% | 17 | |
| Writing TA | |||||
| 2018 | 53% | 73% | 70% | 20 | +1 |
| 2017 | 52% | 71% | 68% | 19 | +1 |
| 2016 | 50% | 68% | 65% | 18 | |
| Maths TA | |||||
| 2018 | 61% | 79% | 76% | 18 | 0 |
| 2017 | 60% | 78% | 75% | 18 | 0 |
| 2016 | 58% | 75% | 73% | 18 |
Source: Provisional KS1 data (2018) and final KS1 data (2016 to 2017)
Table 5 shows the attainment gaps between pupils with English as their first language and pupils with first language other than English. In 2018, the attainment gap decreased by 1 percentage point in reading and remained the same in writing and maths.
Table 5: Attainment in KS1 teacher assessments by pupil first language
Changes made within the 2017/18 writing TA frameworks mean judgements made in 2018 are not directly comparable to those made using the previous interim frameworks in 2016 and 2017.
| Percentage reaching the expected standard and attainment gaps in percentage points: England, 2016-2018 (All state-funded schools) | Other than English | English | All pupils | Attainment gap | Change in attainment gap |
|---|---|---|---|---|---|
| Reading TA | |||||
| 2018 | 73% | 76% | 75% | 4 | -1 |
| 2017 | 72% | 77% | 76% | 5 | 0 |
| 2016 | 70% | 75% | 74% | 5 | |
| Writing TA | |||||
| 2018 | 69% | 70% | 70% | 1 | 0 |
| 2017 | 67% | 69% | 68% | 2 | 0 |
| 2016 | 64% | 66% | 65% | 1 | |
| Maths TA | |||||
| 2018 | 75% | 76% | 76% | 1 | 0 |
| 2017 | 74% | 76% | 75% | 1 | 0 |
| 2016 | 72% | 73% | 73% | 1 |
Source: Provisional KS1 data (2018) and final KS1 data (2016 to 2017)
Table 6 shows the attainment gaps between pupils identified with special educational needs (SEN) and pupils with no identified SEN. In 2018, the attainment gap was 53 percentage points in reading, 56 in writing and 51 in maths. The gap increased by 1 percentage point in writing and remained the same in reading and maths.
Table 6: Attainment in KS1 teacher assessments by SEN provision
Changes made within the 2017/18 writing TA frameworks mean judgements made in 2018 are not directly comparable to those made using the previous interim frameworks in 2016 and 2017.
| Percentage reaching the expected standard and attainment gaps in percentage points: England, 2016-2018 (All state-funded schools) | SEN pupils | No identified SEN | All pupils | Attainment gap | Change in attainment gap |
|---|---|---|---|---|---|
| Reading TA | |||||
| 2018 | 30% | 84% | 75% | 53 | 0 |
| 2017 | 31% | 84% | 76% | 53 | +1 |
| 2016 | 30% | 82% | 74% | 52 | |
| Writing TA | |||||
| 2018 | 22% | 79% | 70% | 56 | +1 |
| 2017 | 21% | 77% | 68% | 56 | +2 |
| 2016 | 20% | 74% | 65% | 54 | |
| Maths TA | |||||
| 2018 | 33% | 84% | 76% | 51 | 0 |
| 2017 | 32% | 83% | 75% | 51 | +1 |
| 2016 | 30% | 80% | 73% | 50 |
Source: Provisional KS1 data (2018) and final KS1 data (2016 to 2017)
3.4 Key stage 1 reading attainment by phonics
Almost 9 in 10 pupils (89%) who met the expected standard in phonics in year 1 in 2017, went on to reach the expected standard in KS1 reading TA in 2018. This is the same proportion as in 2017 and 2016.
Of pupils who met the expected standard in phonics in year 2 in 2018, 32% reached the expected standard in KS1 reading TA in 2018.
4. Local authority attainment
4.1 Phonics attainment by local authority
Table 7 shows the minimum and maximum local authority percentages of pupils who met the phonics expected standard in year 1 and by the end of year 2 (excluding City of London and Isles of Scilly, which have 1 school each). Compared to 2017, the range across local authorities narrowed by 1 percentage point at year 1. This is because of both a rise in the minimum and a dip in the maximum. The range remained the same for year 2, at 8 percentage points.
Table 7: Phonics minimum and maximum local authority percentages
| Minimum and maximum local authority attainment: England, 2018 (All state-funded schools) | National average | Minimum | Maximum | Range (percentage points) |
|---|---|---|---|---|
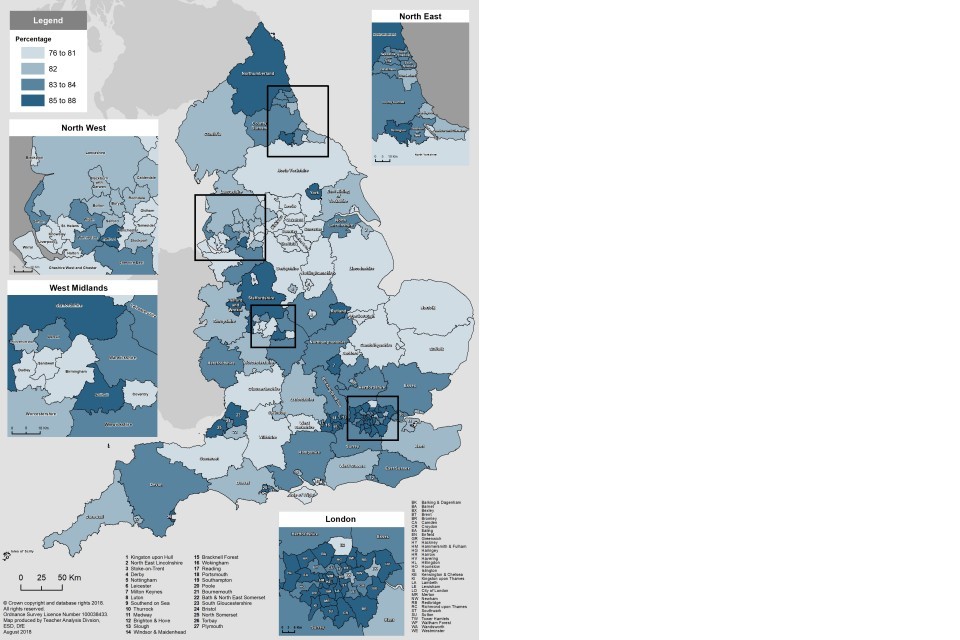
| Year 1 phonics | 82% | 76% | 88% | 12 |
| Year 2 phonics | 92% | 88% | 95% | 8 |
Source: Provisional phonics data (2018)
Figure 7 shows the variation in the percentage of pupils who met the expected standard in phonics between local authorities in England.
Figure 7: Phonics attainment in year 1 by local authority
England, 2018 (All state-funded schools)
Phonics attainment in year 1 by local authority England, 2018 (All state-funded schools)
Source: Provisional phonics data (2018)
4.2 Key stage 1 attainment by local authority
Table 8 shows the minimum and maximum local authority percentages for attainment of each key stage 1 subject (excluding the City of London and Isles of Scilly, which have 1 school each).
Writing had the largest range in attainment across local authorities, as it did in 2017, however it narrowed by 2 percentage points compared to 2017. Changes made within the 2017/18 writing TA frameworks mean judgements made in 2018 are not directly comparable to those made using the previous interim frameworks in 2016 and 2017.
The range in reading and science also narrowed by 1 percentage point. The range in maths remained the same, at 17 percentage points.
Table 8: KS1 minimum and maximum local authority percentages
| Minimum and maximum local authority attainment: England, 2018 (All state-funded schools) | National average | Minimum | Maximum | Range (percentage points) |
|---|---|---|---|---|
| Reading TA | 75% | 68% | 84% | 16 |
| Writing TA | 70% | 61% | 78% | 18 |
| Maths TA | 76% | 68% | 85% | 17 |
| Science TA | 83% | 75% | 91% | 16 |
Source: Provisional KS1 data (2018)
5. About these statistics
Feedback
We have published these statistics as a HTML publication. We would like your feedback on this new approach and if there is anything we can improve. You can contact us about any aspect of this publication at primary.attainment@education.gov.uk
5.1 Advice on comparability over time for key stage 1 data
In 2016, children were assessed under the new national curriculum, where the expected standard has been raised. These changes mean that the key stage 1 expected standard set in 2016 and maintained in 2017 and 2018 is higher and therefore not comparable with the expected standard used in previous year’s statistics. It would therefore be incorrect and misleading to make direct comparisons showing changes over time.
Changes made within the [2017/18 writing TA frameworks](2017/18 writing TA frameworks mean that judgements made in writing in 2018 are not directly comparable to those made using the previous interim frameworks in 2016 and 2017.
5.2 Accompanying tables
The following tables are available at Statistics: key stage 1 - gov.uk
| Phonics national and local authority tables | |
|---|---|
| Table N1 | Percentage of year 1 pupils meeting the expected standard of phonic decoding by gender, school type, school phase and religious character, 2018 |
| Table N2 | Percentage of year 1 pupils meeting the expected standard of phonic decoding by pupil characteristics, 2018 |
| Table N3 | Percentage of year 1 pupils meeting the expected standard of phonic decoding by ethnicity, free school meal eligibility and gender, 2018 |
| Table N4 | Number and percentage of year 1 pupils achieving each phonic mark by gender, 2012 to 2018 |
| Table N5 | Percentage of pupils meeting the expected standard of phonic decoding by gender, school type, school phase and religious character by the end of year 2, 2018 |
| Table N6 | Percentage of pupils meeting the expected standard of phonic decoding by pupil characteristics by the end of year 2, 2018 |
| Table L1 | Percentage of year 1 pupils meeting the expected standard of phonic decoding, by local authority, 2012 to 2018 |
| Table L2 | Percentage of year 1 pupils meeting the expected standard of phonic decoding by ethnicity and gender, by local authority, 2018 |
| Table L3 | Percentage of year 1 pupils meeting the expected standard of phonic decoding by first language and gender, by local authority, 2018 |
| Table L4 | Percentage of year 1 pupils meeting the expected standard of phonic decoding by free school meal eligibility and gender, by local authority, 2018 |
| Table L5 | Percentage of year 1 pupils meeting the expected standard of phonic decoding by SEN provision and gender, by local authority, 2018 |
| Table L6 | Percentage of pupils meeting the expected standard of phonic decoding by local authority by the end of year 2 |
| Key stage 1 national and local authority tables | |
|---|---|
| Table N7 | Attainment in key stage 1 teacher assessments by subject and gender, 2018 |
| Table N8 | Attainment of pupils at the end of key stage 1 by school type, school phase, school cohort size and religious character, 2018 |
| Table N9 | Key stage 1 reading level by phonics prior attainment, 2018 |
| Table N10 | Percentage of pupils reaching expected standard in key stage 1 teacher assessments by pupil characteristics, 2018 |
| Table N11 | APercentage of pupils reaching expected standard in key stage 1 teacher assessments by ethnicity, free school meal eligibility and gender, 2018 |
| Table L7 | Attainment in key stage 1 teacher assessments by region, local authority (LA) and gender, 2018 |
| Table L8a | Percentage of pupils reaching the expected standard in key stage 1 teacher assessments by ethnicity, 2018 |
| Table L8b | Percentage of boys reaching the expected standard in key stage 1 teacher assessments by ethnicity, 2018 |
| Table L8c | Percentage of girls reaching the expected standard in key stage 1 teacher assessments by ethnicity, 2018 |
| Table L9 | Percentage of pupils reaching the expected standard in key stage 1 teacher assessments by first language and gender, 2018 |
| Table L10 | Percentage of pupils reaching the expected standard in key stage 1 teacher assessments by free school meal eligibility and gender, 2018 |
| Table L11 | Percentage of pupils reaching the expected standard in key stage 1 teacher assessments by SEN provision and gender, 2018 |
When reviewing the tables, please note that:
We preserve confidentiality:
The Code of Practice for Official Statistics requires us to take reasonable steps to ensure that our published or disseminated statistics protect confidentiality.
We suppress some figures:
Values of 1 or 2, or a percentage based on 1 or 2 pupils who achieved; or 0, 1 or 2 pupils who did not achieve a particular level are suppressed. Some additional figures have been suppressed to prevent the possibility of a suppressed figure being revealed. This suppression is consistent with our Statistical policy statement on confidentiality.
We adopt symbols to help identify this:
Symbols are used in the tables as follows: ‘.’ not applicable, ‘*’ LA level data based on a single school |Percentages in this publication are given to the nearest whole number but all gaps and differences have been calculated on unrounded data. Therefore, some figures may not match those produced from the rounded figures shown in the tables. |All pupil numbers at regional level are rounded to the nearest 10. This is so that it is not possible to deduce the figures for LAs which have been suppressed. However, percentages have been calculated from unrounded data.
This is provisional data:
Figures are based on provisional data. There is no plan to reissue the publication considering the negligible changes, if any, at national level. However, we will consider whether to revise the 2018 figures in next year’s release, if any difference in the national figures between the provisional and final figures.
We provide underlying data:
The publication is accompanied by national and local authority underlying data and metadata describing this data. This data is provided in csv format so that it can be loaded into the software of your choice.
5.3 Further information available
School level figures:
School level data is not published for the phonics screening check or key stage 1 teacher assessments.
Previously published figures:
Phonics screening check and key stage 1 assessments: England 2017
Attainment for other key stages:
Statistics: early years foundation stage profile - gov.uk. Statistics: GCSEs (key stage 4) - gov.uk Statistics: 16 to 19 attainment Primary school performance tables 2017
Pupil numbers:
Statistics: school and pupil numbers
SEN statistics:
Statistics: special educational needs (SEN) - gov.uk
Attainment in Wales, Scotland and Northern Ireland:
See the methodology document which accompanies this release for details of similar data available for other areas.
International comparisons:
There are no international comparisons of attainment for pupils at this age.
5.4 National statistics
The United Kingdom Statistics Authority has designated these statistics as National Statistics, in accordance with the Statistics and Registration Service Act 2007 and signifying compliance with the Code of Practice for Official Statistics.
Designation can be broadly interpreted to mean that the statistics:
- meet identified user needs
- are well explained and readily accessible
- are produced according to sound methods
- are managed impartially and objectively in the public interest
Once statistics have been designated as National Statistics it is a statutory requirement that the Code of Practice shall continue to be observed. The Department has a set of statistical policies in line with the Code of Practice.
5.5 Technical information
A methodology document accompanies this publication. This provides further information on the data sources, their coverage and quality and explains the methodology used in producing the data, including how it is validated and processed.
5.6 Contact us
Media enquiries
Press Office News Desk
Department for Education
Sanctuary Buildings
Great Smith St
London
SW1P 3BT
Telephone 020 7783 8300
Other enquiries or feedback
Gemma Coleman
Education Data Division
Department for Education
Sanctuary Buildings
Great Smith St
London