Heatwave mortality monitoring report: 2020
Updated 19 November 2020

© Crown copyright 2020
This publication is licensed under the terms of the Open Government Licence v3.0 except where otherwise stated. To view this licence, visit nationalarchives.gov.uk/doc/open-government-licence/version/3 or write to the Information Policy Team, The National Archives, Kew, London TW9 4DU, or email: psi@nationalarchives.gov.uk.
Where we have identified any third party copyright information you will need to obtain permission from the copyright holders concerned.
This publication is available at https://www.gov.uk/government/publications/phe-heatwave-mortality-monitoring/heatwave-mortality-monitoring-report-2020
Background
During summer 2020 there were 3 periods that met the Public Health England (PHE) heatwave definition – outlined below:
- day(s) on which a Level 3 Heat Health Alert (HHA) is issued
- day(s) when the mean Central England Temperature (CET) is greater than 20°C
In addition, the preceding and subsequent days to those identified using the threshold(s) above were included as part of the heatwave period in the analyses.
-
Episode 1 (E1) lasted 5 days (23 to 27 June), during which time the East Midlands, West Midlands, East of England, London, South East and South West of England were at HHA Level 3 and CET reached 20°C.
-
Episode 2 (E2) lasted 3 days (30 July to 1 August). No region reached the threshold for HHA Level 3, but CET reached 20°C.
-
Episode 3 (E3) lasted 11 days (5 to 15 August), with East of England, London and the South East of England at HHA Level 3 HHA, CET also reached 20°C (see figure 1).
Excess all-cause mortality, summer 2020
Excess all-cause mortality was calculated by comparing the average number of all-cause deaths (corrected for delays in registration) on heatwave days with the average from the combination of the 7 non-heatwave days preceding and subsequent to the heatwave period, having subtracting the estimated number of deaths attributed to coronavirus (COVID-19) on those days.
The number of COVID-19 deaths was taken from death reported either by ONS as COVID-19 on death certificate or a death for any reason within 60 days of a COVID-19 positive PCR test. The all-cause deaths data was obtained from the General Registry Office with the location of death according to the region of the office where registration occurred. Deaths were corrected for delays to registration based on historic data on this delay.
Across the 3 episodes, the total cumulative all-cause excess mortality was estimated to be 2,556 (95% CI 2,139 to 2,926), with 311 (95% CI 126 to 446) excess deaths observed in the 0-64 years group and 2,244 (95% CI 1,887 to 2,606) excess deaths observed in the 65+ years group (see Table 1). Statistically significant excesses were observed in all regions of England, except for the North East and the Yorkshire and Humber (see Table 2).
Heatwave and COVID-19
Total cumulative all-cause excess mortality in summer 2020 is comparable to that observed in England during the 2003 pan-European heatwave and 2006 Heatwave event in which 2,234 and 2,323 excess deaths were observed, respectively.
Cumulative excess all-cause mortality related to heatwaves in summer 2020 was the highest observed since the introduction of the Heatwave Plan for England. Whilst the third episode of a heatwave in the summer was prolonged, with very high temperatures recorded (day and night time), the severity and intensity of the heatwave alone does not fully explain the magnitude of the impacts observed. Further work is required to explore how the concurrent risk of COVID-19 and heatwaves may have intersected to amplify these impacts.
Figure 1. All-cause excess mortality in the 65+ years group during summer 2020 (23 to 27 June, 30 July to 1 August and 5 to 15 August) in England.
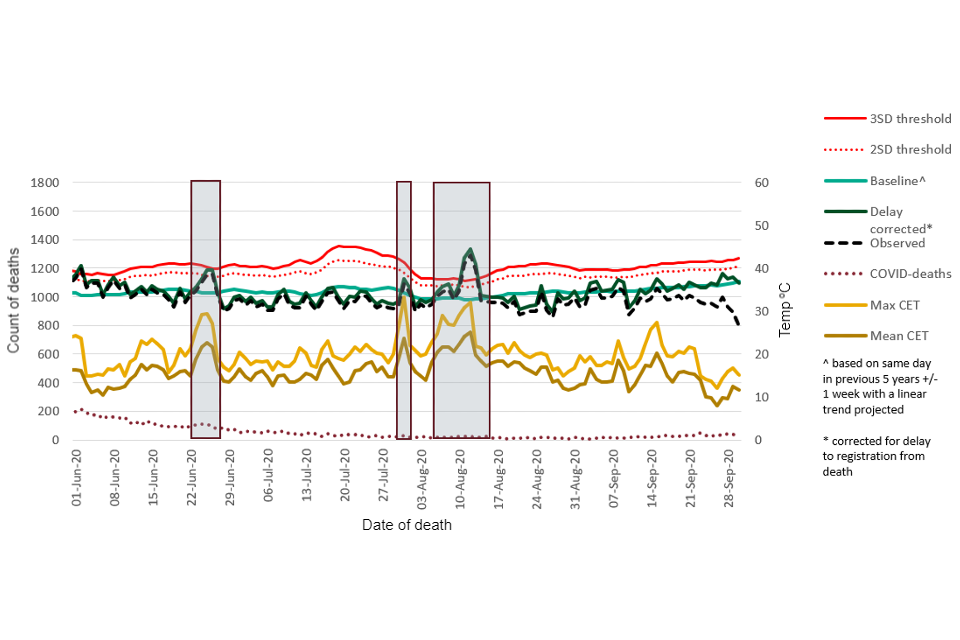
Shaded areas on the figure highlight periods which meet PHE heatwave criteria for estimating heatwave excess mortality and were analysed by age and region. From top to bottom these are:
- 3 and 2 standard deviation (SD) thresholds (solid and dashed red lines)
- daily corrected mortality count (dark green solid line)
- observed mortality counts (black dashed line)
- baseline mortality count (light green solid line)
- maximum Central England Temperature (CET) (solid light gold line)
- average CET (solid dark gold line)
- COVID-deaths (purple dashed line)
Table 1. Estimated all-cause excess mortality by age group for 3 individual heatwave periods and total cumulative excess mortality across all heatwave periods with statistically significant values in bold and 95% confidence intervals in brackets.
Summer 2020 total all-cause excess mortality by age
| Heatwave period | 23 to 27 June | 30 July to 1 August | 5 to 15 August | Total |
|---|---|---|---|---|
| All | 576 (384-768) | 246 (103-389) | 1,734 (1401-2066) | 2,556 (2,139-2,926) |
| 0 to 24 | -2 (-21-16) | 6 (-9-21) | 16 (-17-49) | 19 (-24-55) |
| 25 to 44 | 6 (-24-37) | -15 (-37-7) | 12 (-42-67) | 4 (-63-64) |
| 45 to 64 | 27 (-41-96) | 42 (-10-94) | 219 (100-338) | 288 (128-411) |
| 65 to 74 | 161 (78-243) | 18 (-40-76) | 225 (88-361) | 403 (228-554) |
| 75 to 84 | 172 (69-274) | 17 (-59-92) | 479 (300-659) | 668 (464-886) |
| 85+ | 213 (96-329) | 178 (89-267) | 782 (578-986) | 1173 (938-1421) |
| 0 to 64 | 31 (-46-109) | 33 (-26-92) | 247 (113-382) | 311 (126-446) |
| 65+ | 545 (369-721) | 213 (82-343) | 1,486 (1183-1790) | 2,244 (1887-2606) |
Table 2. Estimated all-cause excess mortality by age group for 3 individual heatwave periods and total cumulative excess mortality across all heatwave periods with statistically significant values in bold and 95% confidence intervals in brackets.
Summer 2020 total all-cause excess mortality by region
| Heatwave period | 23 to 27 June | 30 July to 1 August | 5 to 15 August | Total |
|---|---|---|---|---|
| East of England | 53 (-2-108) | 57 (13-100) | 176 (80-273) | 286 (174-404) |
| East Midlands | 115 (54-176) | 40 (-4-83) | 163 (65-261) | 319 (179-418) |
| London | 46 (-14-106) | 29 (-15-74) | 412 (305-520) | 488 (346-599) |
| North East | -3 (-48-42) | -1 (-34-32) | 5 (-71-81) | 1 (-95-85) |
| North West | 101 (28-174) | 11 (-43-65) | 141 (16-267) | 253 (102-399) |
| South East | 155 (70-240) | 39 (-23-102) | 530 (381-678) | 724 (544-893) |
| South West | 28 (-38-93) | 3 (-45-51) | 181 (68-295) | 212 (69-338) |
| West Midlands | 60 (-7-128) | 56 (6-106) | 164 (51-277) | 280 (131-402) |
| Yorkshire and Humber | 56 (-7-118) | 13 (-32-59) | -33 (-138-73) | 36 (-64-185) |