Personal Independence Payment: Official Statistics to April 2020
Updated 28 July 2020

© Crown copyright 2020
This publication is licensed under the terms of the Open Government Licence v3.0 except where otherwise stated. To view this licence, visit nationalarchives.gov.uk/doc/open-government-licence/version/3 or write to the Information Policy Team, The National Archives, Kew, London TW9 4DU, or email: psi@nationalarchives.gov.uk.
Where we have identified any third party copyright information you will need to obtain permission from the copyright holders concerned.
This publication is available at https://www.gov.uk/government/statistics/personal-independence-payment-april-2013-to-april-2020/personal-independence-payment-official-statistics-to-april-2020
The latest release of these statistics can be found in the collection of Personal Independence Payment statistics.
This summary contains official statistics on Personal Independence Payments (PIP).
PIP helps with some of the extra costs caused by long-term disability, ill-health or terminal ill-health.
The summary covers both new claims and claims made by those with an existing claim for Disability Living Allowance (DLA) (known as DLA reassessments). From 8 April 2013 the Department of Work and Pensions (DWP) started to replace DLA for working age people with PIP.
The statistics cover the PIP customer journey from registration through to payment, mandatory reconsideration (MR) and appeal.
This release includes:
- PIP registrations
- PIP clearances
- PIP awards and award rates
- claimants entitled to PIP at a point in time (caseload)
- PIP Award Reviews and Changes of Circumstance (experimental)
- average clearance & outstanding times
- award types and review periods (experimental)
- MR registrations
- MR clearances
- MR clearance times
- customer journey statistics tracking initial decisions following a PIP assessment through to MR and appeal (experimental)
The majority of all claims fall under normal rules. A small proportion of claims fall under special rules for terminal illness (SRTI).
1. Main Stories
Figures for March and April 2020 reflect the initial period of the COVID-19 pandemic, which has impacted the activity of claimants and led to operational emergency procedures to process the claims in order to reduce the risk to claimants.
The reduction in the activity initiated by customers has led to lower levels of registrations of new claims, changes of circumstances and MRs. In April 2020 there were:
- 25,000 registrations for new claims (less than three fifths – 58% – of the level a year earlier and the lowest number since December 2013)
- 3,700 changes of circumstances (just over three fifths – 61% – of the level a year earlier and the lowest number since December 2017)
- 19,000 MR registrations, the lowest number since January 2016
Emergency operational measures implemented in late March include:
- the temporary suspension of face-to-face health assessments (temporarily replaced by either telephone assessments or paper based reviews)
- the delay to routine re-assessments and reviews
- and extending awards due to end until they can be reviewed
The emergency measures have led to distortions to trends in clearances, clearance times and awards as operational teams initially focused on clearing claims already in the system.
Latest published statistics for PIP show that from April 2013 until April 2020:
- 5.2 million claims to PIP have been registered
- 5 million have been cleared, with just over four out of ten (42%) normal rules new claims, just over seven out of ten (71%) DLA reassessment claims, and nearly all (99%) SRTI claims receiving an award (excluding withdrawn claims).
- 1.2 million claims have had an Award Review registered
- 310,000 claims have reported a change in circumstances
- 1.6 million Mandatory Reconsiderations (MRs) have been registered
- 1.5 million MRs have been cleared, with the proportion of MR decisions resulting in a change in award (excluding withdrawn MRs) rising to 57% in April 2020, reflecting a new operational approach since 2019 as well as COVID-19 impact
- two out of five (40%) of completed MRs against initial decisions following a PIP assessment (to December 2019) go on to lodge an appeal, one out of ten (10%) of appeals lodged were “lapsed” (where DWP changed the decision in the customer’s favour before the appeal was heard at tribunal), and one in twenty (5%) of initial decisions have been overturned (revised in favour of the customer) at a tribunal hearing
As at April 2020 there were 2.5 million claimants entitled to PIP (caseload), with nearly one in three normal rules cases (32%) receiving the highest level of award.
2. What you need to know
COVID-19 changes to 30 April 2020
- As part of the government’s strategy to support people affected by the COVID-19 public health emergency, DWP has made a number of changes to its benefit processes to ensure people who need financial help have access to the benefit system.
- DWP has taken the precautionary decision to suspend, temporarily, face-to-face health assessments. This is aimed at reducing the risk of exposure to coronavirus and safeguarding the health of individuals claiming health and disability-related benefits, many of whom are likely to be at greater risk due to their pre-existing health conditions. This means that that those claiming PIP will no longer be required to attend face-to-face assessments. However, new claims and changes of circumstances are still being accepted and payments will continue to be made.
- DWP have also suspended all routine re-assessments and reviews of disability benefits – that is DLA to PIP reassessments and routine award reviews for those already claiming PIP. All PIP award reviews and DLA to PIP reassessments which had not yet had an assessment booked have been delayed for 3 months (to be reviewed with option to extend) and existing awards due to expire have been automatically extended to ensure continuity of financial support.
- COVID-19 emergency provisions were put in place in late March 2020 and may be reviewed and amended during subsequent periods.
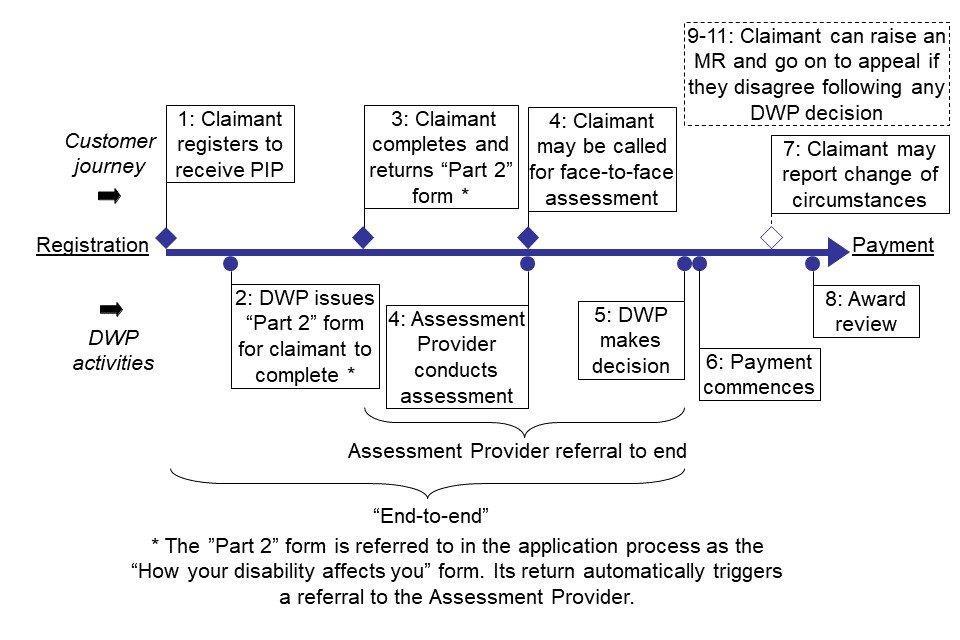
During the current COVID-19 pandemic, some of the steps that a PIP claimant follow have been changed. A typical customer journey is as follows, with COVID-19 changes highlighted in bold.
-
Claimant registers to receive PIP
-
DWP issues PIP “Part 2” form (PIP2, referred to in the application process as the “How your disability affects you” form) for claimant to complete
-
Claimant completes and returns “Part 2” form – which automatically triggers a referral to the Assessment Provider (AP)
-
Claimant may have their claim assessed based on telephony assessments, alongside paper based reviews (Under normal circumstances, claimant may be called for face-to-face assessment conducted by AP)
-
DWP makes a decision based on the AP recommendation – the outcome may be an award (including monetary amount of the award for both Daily Living and Mobility components, the award type and, if appropriate, the period of time that should be allowed before a review of the award takes place) or a disallowance due to failing the assessment (although a claim can also be disallowed prior to the AP referral based on the information in the “Part 2” form or if the claimant fails to attend the assessment)
-
Payment commences
-
When the claim is in payment, a claimant must report any changes of circumstances relating to the claim
-
Award reviews are currently suspended and claims reaching the end of their review period will have their claim extended automatically, to ensure awards stay in payment. (Under normal circumstances, claims may undergo Award Reviews when they reach the end of their review period (unless they received an ongoing award, where they’ll receive a light touch review after 10 years))
-
If the claimant disagrees with a decision on their claim, they can raise a Mandatory Reconsideration (MR)
-
If the claimant still disagrees after the MR has been completed, they can raise an appeal
-
Appeals may be cleared at a tribunal hearing, with face to face hearings being replaced by telephone hearings and the use of other remote hearing technology (where the initial decision is upheld or overturned), or cleared without a hearing (including being withdrawn by the customer, struck out or lapsed – where DWP change the decision in the customer’s favour before it is heard at a tribunal hearing)
The period between initial registration (1) and DWP decision (5) is known as the “End to end” section of the customer journey.
The period between the return of the “Part 2” form (3) and DWP decision (5) is the Assessment Provider referral to end section of the customer journey.
Figure 1: Summary of customer journey
Visualisation of the customer journey
Further detail is given at the end of this release in the About these statistics section.
A methodological note is also available with additional detail on definitions, methodology and data quality issues.
3. PIP Claim Activity: Registrations, Reviews and Clearances
This section covers the volumes of main activities triggered by key points of the PIP customer journey, typically through:
- an initial registration for a claim
- the clearance of the claim when a decision is made as to whether or not PIP should be awarded
- an award review, which is an opportunity to look at entitlement at set intervals to ensure a claimant continues to receive the correct award - the review point is selected based on the claimant’s individual circumstances
- the claimant reporting a change in circumstances – claimants must report any changes to their condition or needs arising, and the award is reviewed to ensure that they continue to receive the correct entitlement, so a change in circumstance may or may not lead to a change in award
This section considers activity for new claims, DLA reassessments, award reviews and changes of circumstance together as volumes across different series can affect one another.
Other activities can be triggered if the claimant disputes decisions being made, such as Mandatory Reconsiderations (MRs) or appeals to the Ministry of Justice, but these are covered in later sections.
5.2 million claims have been registered for PIP between April 2013 when PIP began and April 2020.
Of these:
- 3.3 million (64%) are new claims whilst 1.9 million (36%) are DLA reassessed claims
- 160,000 (3%) were registered under SRTI though the majority (97%) were under normal rules
5.0 million of the registered claims have been cleared.
Of these:
- 2.7 million were awarded PIP
- 2.2 million had their claim disallowed
- 94,000 withdrew their claim
As at 30 April 2020, 230,000 PIP registrations for new or DLA reassessment claims were in progress.
1.2 million claims have had an Award review registered and 310,000 claims have reported a change in circumstances between April 2013 and April 2020.
Note: you can view an interactive dashboard of the latest PIP statistics by region.
Figure 2: All registrations, clearances and reviews April 2013 to April 2020
Visualisation of the total number of registrations, clearances, reviews and in progress cases set out above
Registration activity fluctuates month on month. Whilst initial new claim and change of circumstance registrations tend to follow a stable pattern of gradual increase over time and seasonal dips each December, levels of DLA reassessment and award review activity can be actively managed by the Department when this is required. Since PIP began, figures show:
- increasing levels of DLA reassessment registrations between July 2015 and March 2017 due to wider roll out of DLA reassessment claims, known as Full PIP roll out (FPR)
- lower levels of DLA reassessment registrations between April 2017 and January 2019 as award review registrations increased
- a spike in award review registrations in October 2017, caused by action taken to register 6,500 cases on 24th October 2017 where the PIP Computer System (PIPCS) had not registered these award reviews on the correct date
- a pause in award review registrations between January 2019 and June 2019 in order to manage the number of outstanding cases awaiting a decision and reduce delays for claimants
- a corresponding peak in DLA reassessment registrations between March 2019 and August 2019
- a drop in DLA reassessment levels from August 2019 onwards
During the quarter ending April 2020, COVID-19 has caused major changes in DWP policy and customer behaviour since emergency provisions were put in place in late March. This is reflected in the monthly figures for April 2020, which show:
- a reduction in activity initiated by customers, with 25,000 registrations for new claims (less than three fifths – 58% – of the level a year earlier and the lowest number since December 2013) and 3,700 reported changes of circumstances (just over three fifths – 61% – of the level a year earlier and the lowest number since December 2017)
- DLA reassessment and award review activity has been temporarily stopped except where a DLA customer reports a change in circumstances, and so only these cases plus DLA reassessments or award reviews that were already in progress appear in the statistics (2,000 DLA reassessment claims and 210 award reviews)
Figure 3: Monthly Registrations for initial claims, award reviews and changes of circumstance, all claims (thousands) to April 2020
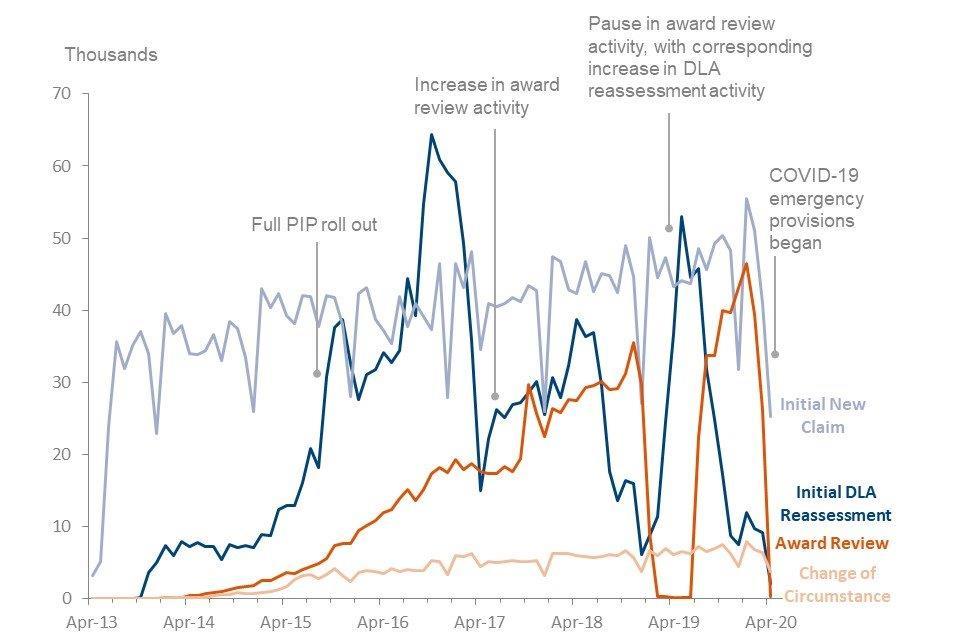
New claims and changes of circumstances show gradual increases since the beginning of PIP with some fluctuation across months and seasonal dips. DLA reassessments and award reviews show more variation corresponding to management of work flows
Clearance activity patterns are driven by patterns in registration activity, lagged by the time it takes to process claims and reviews. However, since processing time is also affected by available capacity there is more variation especially in periods with processing backlogs. Since PIP began, figures show:
- a peak of new claim clearances between November 2014 and January 2015 as claims were cleared following capacity issues earlier in 2014
- increasing levels of DLA reassessment clearances between August 2015 and May 2017 due to wider roll out of DLA reassessment claims (FPR)
- lower levels of DLA reassessment clearances between July 2017 and April 2019 as award review clearances increased
- a spike in award review clearances between January and March 2019 as management of workflows during the first few months of the pause in award review registrations concentrated on outstanding award review cases to reduce delays for claimants, and a subsequent reduction in award review clearances between March 2019 and September 2019
- a corresponding increase in DLA reassessment clearances from May 2019 until November 2019
- a drop in both new claim and DLA reassessment clearances in December 2019 and January 2019 corresponding to active management of workflows between Claims, DLA Reassessments and Reviews, and a temporary suspension of automatic disallowances for failure to return “Part 2” forms from early December to mid-January
During the quarter ending April 2020, disruption due to COVID-19 has affected volumes of clearances for all activities. Assessment Providers have switched to paper based and telephony assessments rather than face to face assessments. In the first few weeks of the COVID-19 pandemic efforts have been made to clear residual claims in the system from before emergency measures were put in place, giving rise to an initial spike in clearance volumes, though this is expected to reduce in future months. Latest figures show:
- clearances for new claims in March 2020 were 58,000 (the highest in-month figure since January 2015), but then dropped to 27,000 in April 2020 (two thirds – 66% – of the level a year earlier)
- 16,000 DLA reassessment claims were cleared in March 2020, continuing the downward trend shown in January and February, but then in April 2020 figures increased to 24,000 as cases in the system were processed
- the number of award reviews cleared dropped between February 2020 (36,000) and March 2020 (22,000) and rose very slightly in April 2020 (24,000) as cases already being processed at the start of the COVID-19 pandemic progressed through the system
- 6,200 changes of circumstance were cleared in March 2020 but this figure almost doubled to 12,000 in April 2020 as those already registered at the start of the COVID-19 pandemic were cleared
Figure 4: Monthly Clearances for initial claims, award reviews and changes of circumstance, all claims (thousands) to April 2020
Clearances have fluctuated since PIP began due to a range of operational factors. The recent quarter saw activity levels changing due to COVID-19
Note: more information on registrations and clearances is available from Stat-Xplore. Information on award reviews and changes of circumstance can be found in tables 6A to 6C in the tables that accompany this release.
4. Clearance outcomes: Awards
As an initial registration progresses through the PIP process, DWP makes a decision based on the AP recommendation – the outcome may be an award or a disallowance due to failing the assessment. However, a claim can also be disallowed prior to the AP referral based on the information in the “Part 2” form or if the claimant fails to attend the assessment. A claimant may choose to withdraw their claim at any stage.
A clearance is defined as the resolution of the initial registration, and therefore includes all possible outcomes – awards, disallowances and withdrawals.
The award rate is defined as the number of cases awarded divided by the total number of cases cleared (minus those that are withdrawn). It includes all types of clearances, including disallowances, both pre-referral and post-referral to an AP.
Award rates for all normal rules awards made between April 2013 and April 2020 are:
- just over four out of ten clearances receive an award (42%) for new claims
- just over seven out of ten clearances receive an award (71%) for DLA reassessment claims
Nearly all (99%) SRTI claimants are awarded PIP.
The assessment award rate gives the proportion of assessments where a decision is made to award PIP. It is defined as number of cases awarded divided by the total number of cases where an assessment has taken place. It includes awards and disallowances post-referral to an AP due to failing assessment, but excludes withdrawn claims, disallowances pre-referral to an AP, and disallowances post-referral to AP where the claimant failed to attend the assessment.
At the end of April 2020:
- 2,300,000 (74%) of the new claims had an assessment
- 1,700,000 (91%) of the DLA reassessment claims had an assessment
- all remaining claims were disallowed (either pre-assessment or through failing to attend the assessment), or withdrawn
Assessment award rates for all decisions made between April 2013 and April 2020 (normal rules, excluding cases where an assessment has not been completed) show that:
- nearly three out of five (57%) assessments result in an award for new claims
- nearly four out of five (78%) assessments result in an award for DLA reassessment claims
Award rates and Assessment award rates saw a gradual decrease in the first few years after the introduction of PIP. Rates were relatively stable with some fluctuation across months from the beginning of 2016 until March 2020.
In April 2020, COVID-19 impacted award rates and assessment award rates as assessment methods changed to paper based and telephone assessments. Trends have been distorted during the transitional period to emergency measures. Figures show:
- over half (56%) of all new claim clearances (excluding withdrawn) and nearly three out of five (59%) who were assessed received an award in April 2020, compared to just over one in three (36%) and just over half (52%) respectively a year previously
- over three quarters (76%) of all DLA reassessment clearances (excluding withdrawn) and also of those who were assessed (77%) received an award in April 2020, compared to just under three in five (57%) and over seven in ten (71%) respectively a year previously
Figure 5: Award rates and Assessment award rates (all claims) to April 2020
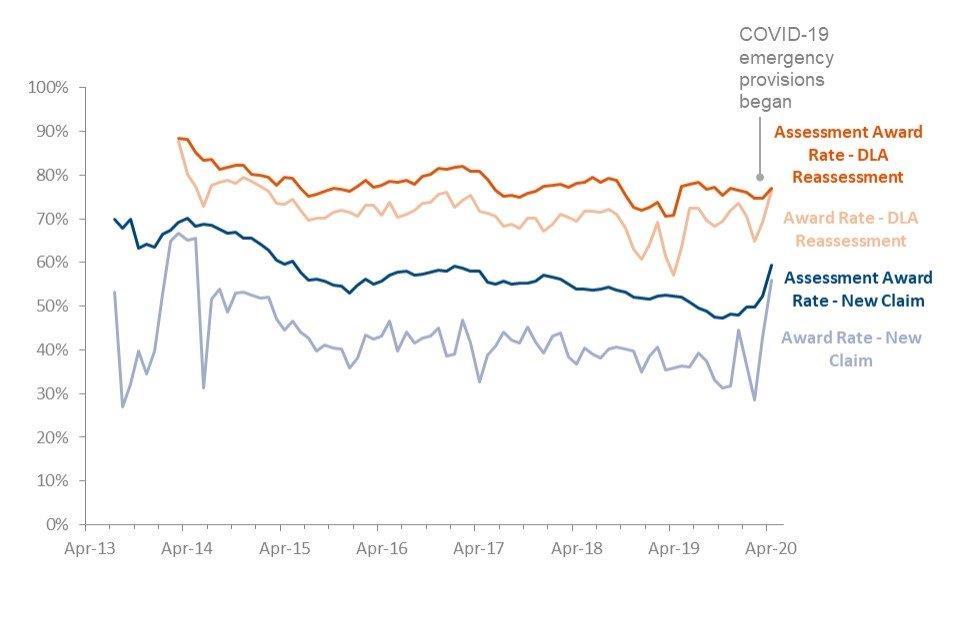
Award rates and assessment award rates had been generally steady with some month on moth fluctuation since 2016, but have seen increases in the latest month due to COVID-19
Assessment award rates vary by disabling condition. A PIP claimant’s main disabling condition is recorded during their assessment. Customers who withdraw their claim, are disallowed prior to their assessment or who fail to attend their assessment will not have a main disabling condition recorded.
Of those claims that have had an assessment, 82% of new claims and 88% of DLA reassessment claims are recorded as having one of the following most common disabling conditions:
- psychiatric disorders (which includes mixed anxiety and depressive disorders)
- musculoskeletal disease (general)
- musculoskeletal disease (regional)
- neurological disease
- respiratory disease
Figure 6a: Assessment award rates (new claims, normal rules) by main disabling condition to April 2020
| PIP New Claim Assessment Award Rates (normal rules) | Percentage |
|---|---|
| Psychiatric disorders | 54% |
| Musculoskeletal disease (general) | 63% |
| Musculoskeletal disease (regional) | 60% |
| Neurological disease | 62% |
| Respiratory disease | 57% |
| Other | 52% |
Figure 6b: Assessment award rates (reassessed claims, normal rules) by main disabling condition to April 2020
| PIP Reassessed Claim Assessment Award Rates (normal rules) | Percentage |
|---|---|
| Psychiatric disorders | 73% |
| Musculoskeletal disease (general) | 85% |
| Musculoskeletal disease (regional) | 82% |
| Neurological disease | 84% |
| Respiratory disease | 83% |
| Other | 72% |
Those claims shown as “other” in the charts cover a wide variety of conditions with a broad range of assessment award rates.
If a PIP award is made, entitlement to PIP commences immediately. Claimants generally receive payment during the period for which they have entitlement, although there are times when payment may be suspended, for example if they are in hospital.
There were 2.5 million claims with entitlement to PIP (caseload) as at 30th April 2020.
Of these:
- 1.2 million (47%) are new claims whilst 1.3 million (53%) are DLA reassessed claims
- 31,000 (1%) were registered under SRTI though the majority (99%) were under normal rules
For normal rules claims:
- nearly two out of five (38%) have had entitlement for less than 2 years
- just under one in five (19%) have had entitlement for between 2 and 3 years
- just over two out of five (43%) have had entitlement for more than 3 years
When PIP is awarded, decisions are made as to the award level – the monetary amount of the award for both Daily Living and Mobility components – depending on the claimant’s individual circumstances. Each component can be awarded at:
- enhanced rate
- standard rate
- nil, where the claimant is not awarded this component
Nearly one in three (32%) normal rules claims with entitlement to PIP as at 30th April 2020 receive the highest level of award
For normal rules claims with entitlement in April 2020:
- one quarter (25%) received daily living award only, a few (4%) received mobility award only, and nearly three quarters (71%) received both
- almost one third (32%) received the highest level of awards (‘enhanced/enhanced’ rates) for both mobility and daily living components, and almost a further third (30%) received one component at the enhanced rate
The most commonly recorded disabling condition for claims under normal rules is ‘Psychiatric disorder’
Figure 7: PIP claims with entitlement (normal rules) by main disabling condition, as at April 2020
| Disabling condition | Claimants | Percentage |
|---|---|---|
| Psychiatric disorders | 900,000 | 37% |
| Musculoskeletal disease (general) | 500,000 | 20% |
| Neurological disease | 330,000 | 13% |
| Musculoskeletal disease (regional) | 310,000 | 13% |
| Respiratory disease | 110,000 | 4% |
| Cardiovascular disease | 60,000 | 2% |
| Malignant disease | 52,000 | 2% |
| Other | 190,000 | 8% |
Note: more information on claims with entitlement (caseload), clearances and awards by a range of factors including disability is available from Stat-Xplore.
5. Clearance and Review outcomes: Award Levels
During a review of an award due to a planned award review or when a change of circumstance is reported, the award level is assessed and may be changed. Since 25 June 2016 (when procedures were updated), the outcome of a review can be recorded as:
- Increased – where the award level has increased for one or both components
- Maintained – where the award level remains as it was prior to the review
- Decreased – where the award level has decreased for one or both components
- Disallowed – where the claimant’s entitlement to benefit is ended
- Withdrawn or voluntarily relinquished (for Changes of Circumstances only)
Prior to 25 June 2016, whether an award review resulted in an increase or decrease in the level of award that the claimant received was not recorded.
From 25 June 2016 to April 2020:
- 550,000 of the 930,000 award reviews, nearly 3 out of 5 (59%), resulted in an increase or no change to the level of award received by the claimant
- 170,000 of the 240,000 changes of circumstances, nearly three quarters (72%), resulted in an increase or no change to the level of award received by the claimant
This difference reflects the fact that many PIP claimants report a change of circumstances when their condition or disability deteriorates.
Figure 8a: Award Review outcomes from 25th June 2016 to April 2020
| Review Outcome | Percentage |
|---|---|
| Award Increase | 17% |
| Award Maintained | 42% |
| Award Decreased | 16% |
| Award Disallowed | 25% |
Figure 8b: Change of circumstance outcomes from 25th June 2016 to April 2020
| Review Outcome | Percentage |
|---|---|
| Award Increase | 44% |
| Award Maintained | 28% |
| Award Decreased | 7% |
| Award Disallowed | 14% |
| Withdrawn or voluntarily relinquished | 6% |
The proportion of claimants receiving more (or less) benefit after their award review differs across the various main disabling condition groups, where condition is as recorded at the time of award review clearance.
The six most common groups account for 91% of all award reviews cleared between June 2016 and April 2020. Among these groups:
- claimants with a respiratory disease were most likely to have their award increased or maintained (69%)
- claimants with a malignant disease were most likely to have their award decreased or disallowed (52%).
Figure 9: Award Review outcomes by main disabling condition, from 25 June 2016 to April 2020
| Disabling condition | Award Increased | Award Maintained | Award Decreased | Award Disallowed |
|---|---|---|---|---|
| Psychiatric disorders | 15% | 38% | 15% | 32% |
| Musculoskeletal disease (general) | 19% | 46% | 18% | 17% |
| Musculoskeletal disease (regional) | 16% | 45% | 16% | 22% |
| Neurological disease | 19% | 47% | 15% | 19% |
| Respiratory disease | 24% | 44% | 14% | 17% |
| Malignant disease | 13% | 35% | 17% | 35% |
| Other | 17% | 40% | 14% | 29% |
Further information on award review outcomes for all main disabling conditions can be found in tables 6B (iv) – (vi) of the tables that accompany this release.
6. Clearance outcomes: Award Types and Review Periods (experimental statistics)
When PIP is awarded, decisions are also made as to the award type and, where appropriate, the review period.
The award type may be:
- a fixed length award with a set period of time before a review of the award takes place
- an “ongoing award” with no end date, where the intention will be to apply a light-touch review at the 10-year point
- a “short term award without review” which will not be subject to review but will end within a small number of years of award unless a new claim is submitted (mostly awarded under SRTI, with others being awarded to claimants who are expected to see a significant reduction in needs in the short term)
For fixed length awards, decisions are also made as to:
- the period of time that should be allowed before a review of the award takes place, known as the review period
- a “review date”, which is set to reflect the point at which the Department considers that the claimant’s needs might change sufficiently to warrant a review
- an “end date”, set to 12 months after the review date, at which point the claim will come to an end unless it is extended by the review
Award levels and review periods are set on an individual basis, based on the claimant’s needs and the likelihood of those needs changing. This takes into account such matters as planned treatment/therapy or learning/adapting to manage a condition. For fixed length awards, the review period usually ranges from a minimum of 9 months to a maximum 10 years. Review periods of less than 9 months are set only in exceptional circumstances. An award of 2 years or less is considered short term.
New guidance in place from 31 May 2019 means that successful claimants whose review would normally have taken place when they were of State Pension age will now be awarded ongoing awards. This change affects higher volumes of reassessed claims than new claims, because DLA claimants tend to be older than new claimants. There are some claimants aged above State Pension Age who have been incorrectly recorded as having an award with a review date of less than 10 years. Claimants do not need to do anything and work is underway to ensure all claimants who are of State Pension Age at the time of their next review date are given a light touch ongoing award with a review at 10 years.
Most new claimants receive an award of 2 years or less. DLA reassessment claimants tend to receive longer awards. Trends over time have tended to differ between new and reassessed claims.
For new claims:
- in April 2020, seven out of ten (70%) claims awarded were short term (with a review period of 0 to 2 years), nearly one in ten (9%) were longer term (over 2 years) and just over one in ten (11%) were ongoing
- short term claims with review period of 0 to 2 years have consistently been the most common type of award for new claims, rising from 54% in April 2017 and peaking between September and November 2018 at 80%
- longer term claims over 2 years were the second most common type of award and peaked in May 2015 (33%), after which they started a decreasing trend with a sharper drop from January 2018 counterbalancing the equivalent rise in shorter claims at that point in time
- ongoing claims have only accounted for 5% of all claims awarded up until May 2019, rising slightly since then to current levels due to the policy change described above
For DLA reassessment claims:
- in April 2020, ongoing awards were the most common award type (two out of five – 40% – of all claims awarded) followed by short term 0 to 2 year claims (one in three - 33%) and longer term claims over 2 years (over one in four – 27%)
- longer term claims over 2 years were initially the most typical type of reassessed award until November 2016, although these have gradually decreased from an initial peak at 69% in August 2014 to become the least common award type since April 2019
- short term reviews became the most common type from April 2018 and peaked in December 2018 (53% of all reassessed claims awarded)
- ongoing awards have increased since PIP began, peaking at 43% in December 2016, dropping back to 23% in December 2018 and then peaking again at 54% in October 2019
Figure 10: Percentage of award types, by month of award, to April 2020

Awards by award type and trends. Early periods (pre-July 2013 for new claims, pre-July 2014 for DLA reassessments) are too volatile (due to low volumes) for proportions to be meaningful, and claimants during these periods were more likely to be SRTI
Award types and review periods also differ by main disabling condition.
In particular:
- new claimants with psychiatric disorders are more likely to receive short term awards with reviews
- most new claimants with a malignant disease claim under SRTI
- DLA reassessment claimants are more likely to receive ongoing awards than new claimants across all disabling conditions
- since PIP was introduced, 50% of successful DLA reassessed claimants with neurological diseases received an ongoing award
Figure 11: Award types, proportion, by condition to April 2020
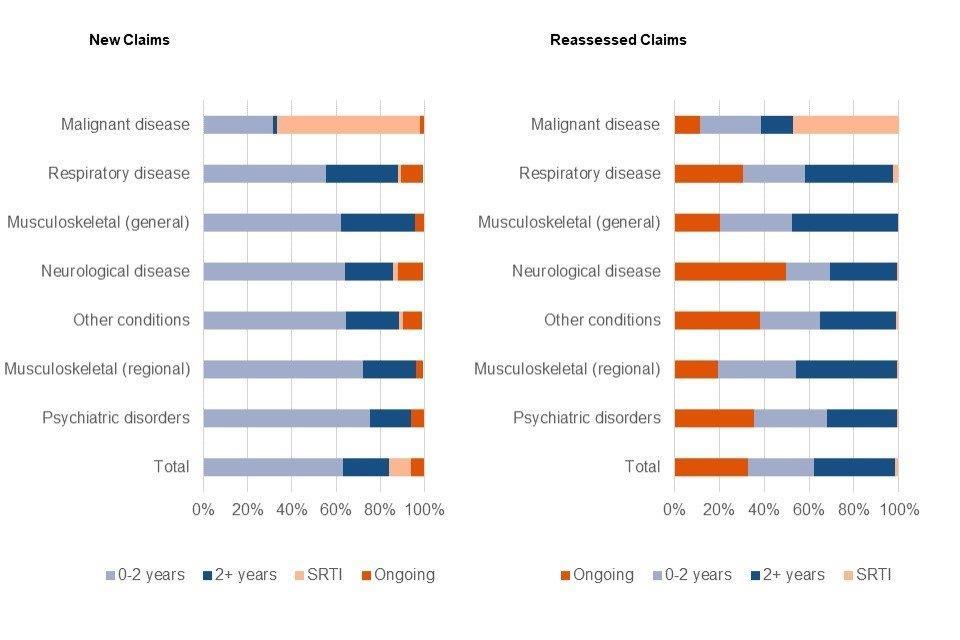
Chart shows graphic representation of proportions given in figures 13a and 13b
Figure 11a: New Claim Award types, proportion, by condition to April 2020
| Disabling condition | Short term 0-2 years | Longer term 2+ years | SRTI | Ongoing |
|---|---|---|---|---|
| Malignant disease | 31% | 2% | 64% | 2% |
| Respiratory disease | 55% | 33% | 1% | 10% |
| Musculoskeletal disease (general) | 62% | 33% | 0% | 4% |
| Neurological disease | 64% | 22% | 2% | 11% |
| Other | 65% | 24% | 2% | 8% |
| Musculoskeletal disease (regional) | 72% | 24% | 0% | 3% |
| Psychiatric disorders | 76% | 18% | 0% | 5% |
Figure 11b: DLA Reassessment Claim Award types, proportion, by condition to April 2020
| Disabling condition | Short term 0-2 years | Longer term 2+ years | SRTI | Ongoing |
|---|---|---|---|---|
| Malignant disease | 27% | 14% | 47% | 12% |
| Respiratory disease | 28% | 39% | 2% | 31% |
| Musculoskeletal disease (general) | 32% | 47% | 0% | 20% |
| Neurological disease | 20% | 30% | 0% | 50% |
| Other | 27% | 34% | 1% | 38% |
| Musculoskeletal disease (regional) | 35% | 45% | 0% | 20% |
| Psychiatric disorders | 33% | 31% | 0% | 36% |
7. Clearance and Outstanding Times
Clearance times show the time taken for DWP to process and make a decision on a case. The average clearance time is calculated as the median of all individual clearance times.
Figure 12: Average PIP clearance times in Great Britain (GB), April 2020
| Claim type | “End to end” clearance time (from registration to decision being made) | “AP referral to end” clearance time (from point of referral to the Assessment Provider to decision being made) |
|---|---|---|
| New claim, normal rules | 16 weeks | 11 weeks |
| Reassessed claim, normal rules | 27 weeks | 19 weeks |
| New claim, special rules for terminal illness | 5 working days | N/A |
| Reassessed claim, special rules for terminal illness | 6 working days | N/A |
Note: “AP referral to end” times not shown for special rules for terminal illness cases as these are not published separately.
Clearance times for normal rules new claims:
- have reduced significantly from peaks in July 2014 (42 weeks end to end, 35 weeks AP referral to end)
- saw increases in late 2019 following the introduction, in July 2019, of a 2-week extension to the 4-week time limit to return the “Part 2” form where a reminder has been sent
- fell in April 2020 (to 16 weeks end to end, 11 weeks AP referral to end) compared to the previous few months (February 2020 saw a peak of 20 weeks end to end, 13 weeks AP referral to end), which reflect distortions due to the transition from normal procedures to emergency COVID-19 measures
Clearance times for normal rules reassessed claims:
- peaked in September 2014 (32 weeks end to end, 27 weeks AP referral to end)
- reduced significantly from the start of 2015, though with fluctuation over time due to changing workflows
- saw increases in late 2019 following the introduction, in July 2019, of a 2-week extension to the 4-week time limit to return the “Part 2” form where a reminder has been sent
- have continued to rise over the last quarter and are currently (27 weeks end to end, 19 weeks AP referral to end) at the highest levels since October/November 2014, which reflect distortions due to the transition from normal procedures to emergency COVID-19 measures
Figure 13: Clearance times for claims under normal rules (median weeks) to April 2020
Clearance times peaked for new claims in July 2014 and for reassessed claims in September 2014 due to capacity issues but reduced by April 2015. Recent months have seen increases in clearance times especially for reassessed claims
Information on clearance times and outstanding times (time already waited for cases where DWP has yet to make a decision) can be found in tables 2 and 3 of the tables that accompany this release. Regional clearance times can also be found there.
8. Mandatory Reconsiderations (MRs)
Claimants who wish to dispute a decision on their PIP claim at any stage can ask DWP to reconsider the decision. This is a mandatory reconsideration (MR).
Its purpose is to consider the grounds for the dispute and complete a review of the initial decision. An MR may give rise to a change in award, which includes:
- previously disallowed claims that are now awarded
- claims that had previously been awarded but the MR has resulted in a change in the level of the award
An MR must be completed before an appeal is made and lodged with HM Courts and Tribunals Service (HMCTS).
MRs arising from award reviews are counted as relating to a new claim or a DLA reassessment claim based on the initial claim type.
By the end of April 2020, 1.6 million MRs had been registered against normal rules claims. Of these:
- 940,000 (59%) related to new claims
- 660,000 (41%) related to reassessed DLA claims
1.5 million MRs for normal rules claims had been cleared by the end of April 2020. Of these:
- 900,000 (59%) were for new claims
- 630,000 (41%) were for reassessed DLA claims
- 110,000 (7%) were withdrawn or cancelled
The number of MRs registered and cleared within each month fluctuates over time. Since PIP began:
- the number of MRs gradually increased between April 2013 and November/December 2016 as volumes of PIP customers increased
- MR volumes peaked in October 2016, and then levels remained steady apart from fluctuation until a new peak in October 2019
- MR volumes then decreased through to March 2020
- Latest figures for MR registrations (19,000 in April 2020) are the lowest since January 2016 and reflect reduced activity since the COVID-19 pandemic began
- MR clearances in February and March 2020 (19,000 and 18,000 respectively) were also the lowest since early 2016, though they rose to 21,000 in April 2020
Figure 14: Monthly reconsiderations: Registrations and clearances, normal rules (thousands) to April 2020
MR registrations and clearances fluctuate month on month with the latest quarter showing a drop in activity
The degree to which MRs lead to changes in award has fluctuated over time.
Since PIP began:
-
from April 2013 to December 2018, levels remained stable with just over one in five (fluctuating around 21%) of MR decisions leading to a change in award (excluding withdrawn MRs), while nearly four out of five (fluctuating around 79%) left the award unchanged
- the proportion of MRs where the award was changed (excluding withdrawn MRs) gradually increased, with some fluctuation, from 23% in January 2019 to 40% in December 2019, while the proportion where the award was unchanged decreased correspondingly from 77% to 60%
- changes in 2019 may reflect a new operational approach where the Department began to proactively contact claimants, as appropriate, to gather additional oral and written evidence for PIP at the MR stage
- the proportion of MR decisions (excluding withdrawn MRs) resulting in a change in award rose sharply between 40% in February 2020 and 44% in March 2020 to 57% in April 2020, reflecting the new operational approach as well as COVID-19 impact
Figure 15: Monthly reconsiderations clearance outcomes, proportion (excluding withdrawn MRs) to April 2020
The proportion of MR clearances where but the award is unchanged dominating until late 2019, but with those where the award changed increasing over time
MR clearance times refer to the median average time taken to process an MR from the time it is registered by the claimant to a decision being made.
Since April 2013 MR clearance times followed similar patterns for both new claims and DLA reassessments, and have been quite volatile, with peaks in August 2014 (56 days) and October 2016 (39 days) before an all-time high of 69 calendar days at the end of July 2019 and a subsequent drop to 33 days in November 2019.
In April 2020, the median MR clearance time rose to 59 calendar days (58 days for new claims and 63 days for reassessed DLA claims), levels somewhat higher than the same month the previous year (51 days in April 2019).
Figure 16: MR clearance times, normal rules (median) to April 2020
MR clearance times peaked in July 2019 and then dropped in November 2019. Latest figures showed a rise compared to the previous quarter though slightly lower than the same month the previous year
Note: information on MR clearance times can be found in tables 4A to 4B of the tables that accompany this release. Further breakdowns of MR registration and clearance volumes are available from Stat-Xplore.
9. Customer journey (experimental) Statistics
This section includes experimental statistics based on a dataset that tracks initial decisions following a PIP assessment, through to MR and appeal. These statistics:
- help us understand the claimant’s end-to-end journey from claiming PIP, through to MR and appeal
- are particularly useful to understand the volumes and proportions flowing through each stage of the process and whether there are differences for particular groups of claimants
- cover initial decisions following a PIP assessment since PIP was introduced up to December 2019, and for MRs and appeals to March 2020 – note that more MRs and appeals could be made and completed after March 2020, so numbers could go up as it can take some time for an appeal to be lodged and then cleared after the initial decision - note that the majority of customer journey statistics do not yet cover the period affected by COVID-19, this will appear in future quarterly updates
- cover new claims and DLA reassessment claims and both normal rules and special rules for terminally ill people (SRTI)
These statistics do not include:
- decisions made prior to an assessment being completed
- decisions made at an Award Review or Change of Circumstance
This means that the MR volumes are on a different basis to the other statistics on MRs contained within this release. Appeal volumes are also on a different basis to the statistics published by the Ministry of Justice on tribunal appeals.
For robust figures on individual stages, please use:
- for MR registration and clearance volumes, the figures from Stat-Xplore
- for appeals, the quarterly Ministry of Justice Tribunals statistics
For initial PIP decisions following an assessment during the period April 2013 to December 2019:
- there were 3.8 million initial decisions following a PIP assessment - nearly seven in ten (68%) were awarded PIP at the initial assessment
- 870,000 MRs have been registered about the 3.8 million initial decisions
- just over three in twenty (17%) of completed MRs resulted in a change to the award (excluding withdrawn)
- four in ten (40%) of completed MRs then lodged an appeal
- one in ten (10%) of appeals lodged were “lapsed” (which is where DWP changed the decision in the customer’s favour after an appeal was lodged but before it was heard at tribunal)
- two thirds (67%) of the DWP decisions cleared at a tribunal hearing were “overturned” (which is where the decision is revised in favour of the customer)
- just under one in ten (9%) of initial decisions following a PIP assessment have been appealed and around one in twenty (5%) have been overturned at a tribunal hearing
Claimants who were disallowed PIP at initial decision (April 2013 to December 2019) were, in comparison to those awarded at initial decision:
- more likely to go on to register an MR or lodge an appeal
- less likely to have an award changed at MR or appeal
Of the 2.6 million cases where PIP was awarded at the initial assessment between April 2013 and December 2019:
- just over one in ten (11%) go on to register an MR (280,000 MRs registered, of which 1,700 were withdrawn)
- just over one in four (26%) of the 270,000 MRs decided gave rise to a change in award (70,000 changed the award while 200,000 left the award unchanged)
- just over one in three (35%) of cases lodged an appeal following their MR decision (96,000 appeals were lodged, of which 6,500 were withdrawn or struck out, and 14,000 were lapsed)
- almost three quarters (73%) of the 67,000 appeals cleared at tribunal hearing were overturned in favour of the customer (49,000 were overturned while 18,000 upheld the original DWP decision)
Figure 17: Initial Awarded Decisions through to MR and Appeal, April 2013 to December 2019 (Experimental statistics)
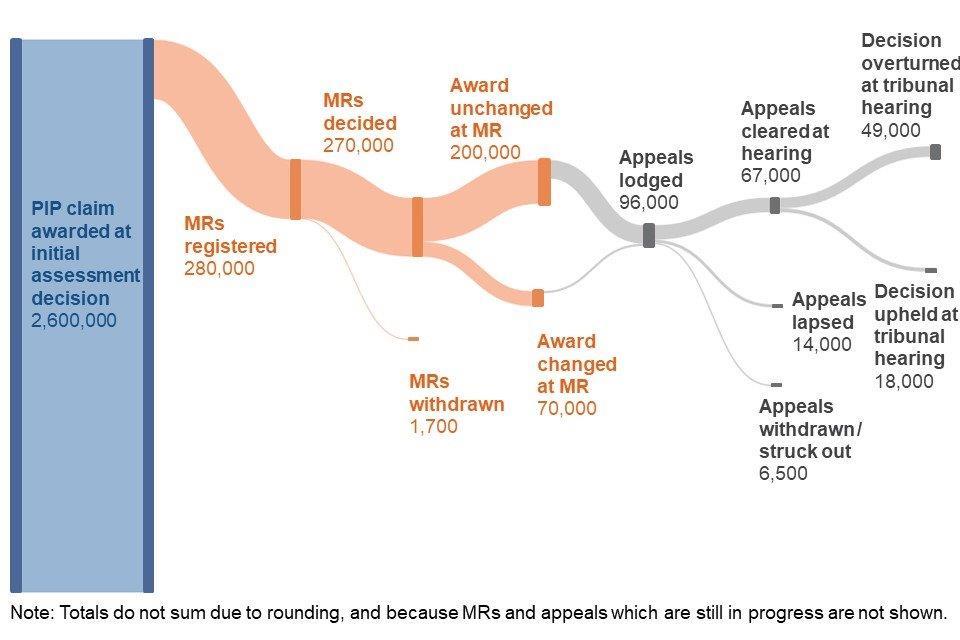
A visualisation of the total number of decisions, MRs and appeals for cases where PIP was awarded at initial assessment, as set out above
Of the 1.2 million cases where PIP was disallowed at the initial assessment between April 2013 and December 2019:
- nearly half (48%) go on to register an MR (590,000 MRs registered, of which 880 were withdrawn)
- slightly over one in ten (13%) of the 590,000 MRs decided gave rise to a change in award (78,000 changed the award while 510,000 left the award unchanged)
- just over two in five (43%) of cases lodged an appeal following their MR decision (250,000 appeals were lodged, of which 5,700 were withdrawn or struck out, and 21,000 were lapsed)
- almost two thirds (64%) of the 200,000 appeals cleared at tribunal hearing were overturned in favour of the customer (130,000 were overturned while 70,000 upheld the original DWP decision)
Figure 18: Initial Disallowed Decisions through to MR and Appeal, April 2013 to December 2019 (Experimental statistics)
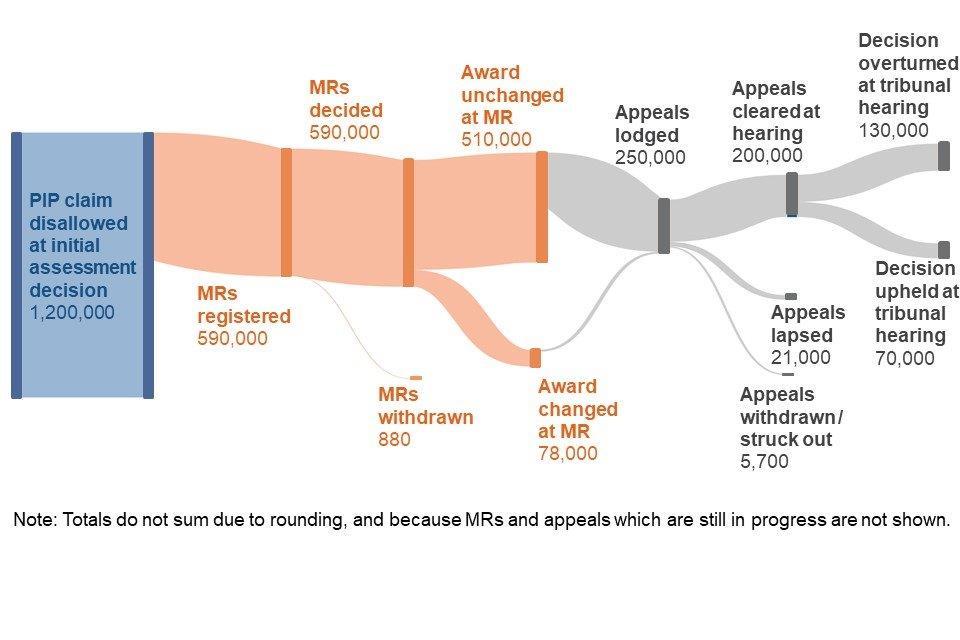
A visualisation of the total number of decisions, MRs and appeals for cases where PIP was awarded at initial assessment, as set out above
Considering trends over time, the proportion of:
- MRs resulting in a change to the award has increased by 5 percentage points in the most recent quarter of initial decision to reach 32% in the October to December 2019 quarter
- appeals lodged which were lapsed has gradually increased since 2015-16 to reach 20% in the period April to December 2019
- initial decisions following an assessment which have been appealed has gradually increased over time – from around 6% over the first couple of years when PIP was introduced, to 10% in 2018 to 2019
- initial decisions following an assessment overturned at a tribunal hearing has gradually increased and was 6% in 2017 to 2018 – though as these statistics are grouped by initial decision date, numbers could increase for later periods as more appeals are completed
The summary tables 5A to 5F that go with this release give information by date of initial decision (quarter and financial year) and by outcome of initial decision, whether it was a DLA reassessed case or new claim, and by geography.
10. About these statistics
Data quality statement:
The following PIP statistics are Official Statistics:
- registrations
- clearances & awards
- clearance & outstanding times
- mandatory reconsideration registrations & clearances
- mandatory reconsideration clearance times
- claimants entitled to PIP
Official Statistics are produced in accordance with Statistics and Registration Service Act 2007 and the Code of Practice for Statistics and meet high standards of trustworthiness, quality and public value.
The following PIP statistics are Experimental Statistics:
- award types & review periods
- award review and change of circumstance registrations and clearances
- customer journey statistics (tracking of initial decisions following a PIP assessment through to MR and appeal)
These statistics are badged as experimental to reflect the fact that the series are new and methodologies and definitions for the statistics may develop over time.
Breakdowns available:
Statistics available on Stat-Xplore and in accompanying tables are further broken down by:
- geography (region, local authority and parliamentary constituency and for Stat-Xplore, Middle & Lower layer Super Output Area and Census Output Area)
- assessment status (SRTI, DLA reassessment indicator and for all post-assessment measures, mobility component award level, daily living component award level)
- claimant characteristics (age, gender, State Pension Age)
- primary disability category / sub category / low level disability category (for all post-assessment measures)
- duration of current claim (for caseload)
- outcomes and review periods (for clearances)
- mean financial award amounts (for all awards in clearance and caseload series)
Note that State Pension Age flag and mean financial award amounts were added for the first time in the June 2020 release.
Rounding policy
The rounding policy has been reviewed for the June 2020 publication. Data in the release has been rounded as per the table below, with the exception of average clearance times which are shown as whole numbers of days or weeks.
Figure 19: Summary of rounding policy
| From | To | Round to nearest |
|---|---|---|
| 0 | 1,000 | 10 |
| 1,001 | 10,000 | 100 |
| 10,001 | 100,000 | 1,000 |
| 100,001 | 1,000,000 | 10,000 |
| 1,000,001 | 10,000,000 | 100,000 |
| 10,000,001 | 100,000,000 | 1,000,000 |
All changes and totals are calculated prior to rounding. Percentage changes are calculated prior to rounding and then are rounded to the nearest whole number. As all figures within this statistical summary have been rounded, they may not add up.
Retrospection
The data is subject to some minor retrospection. When a claim is first registered, it is assumed to be a new claim unless there is evidence to suggest that it is a DLA reassessment. If evidence is presented between registration and clearance, the claim will then show as a DLA reassessment clearance and will move from being a new claim registration to being a DLA reassessment registration.
Some claims may not be marked as claims under SRTI at the point of registration but become an SRTI claim prior to the point of clearance, and vice versa. This may lead to the figures showing fewer SRTI registrations than clearances.
PIP operational roll out
On 8 April 2013, PIP was introduced as a controlled start, for new claims from people living in a limited area in the North West and part of the North East of England.
On 10 June 2013, PIP was introduced for new claims for the remaining parts of Great Britain.
From 28 October 2013, using a structured roll out to postcode areas, DWP invited DLA working age recipients to claim PIP if:
- DWP received information about a change in care or mobility needs which meant their claim had to be renewed
- the claimant’s fixed term award was due to expire
- children turned 16 years old (unless they have been awarded DLA under the special rules for terminally ill people)
- the claimant chose to claim PIP instead of DLA
Since July 2015, the remaining DLA working age recipients have been gradually invited to claim PIP.
Where to find out more
The Personal Independence Payment statistics collection has links to this release and other releases of PIP statistics.
Read a detailed PIP statistics background and methodology document. This gives information about production of the PIP statistical release including:
- data sources
- methods
- definitions
- quality assurance steps
Build your own data tables using Stat-Xplore
View an interactive dashboard of the latest PIP statistics by region.
Read an overview of PIP.
Read the release strategy for the PIP statistics.
Related statistics
Ministry of Justice tribunals statistics.
Work and Pensions Select Committee PIP and ESA assessments inquiry: supporting statistics. This ad hoc publication gives statistics about the assessment process from the Department for Work and Pensions (DWP) and the 3 assessment providers:
- Centre for Health and Disability Assessments (CHDA)
- Capita
- Independent Assessment Services (IAS)
The release also includes statistics about the outcomes of MRs and tribunals.
ISBN: 978-1-78659-239-2