Chapter 7: health checks 2017 to 2018
Updated 27 January 2020

© Crown copyright 2020
This publication is licensed under the terms of the Open Government Licence v3.0 except where otherwise stated. To view this licence, visit nationalarchives.gov.uk/doc/open-government-licence/version/3 or write to the Information Policy Team, The National Archives, Kew, London TW9 4DU, or email: psi@nationalarchives.gov.uk.
Where we have identified any third party copyright information you will need to obtain permission from the copyright holders concerned.
This publication is available at https://www.gov.uk/government/publications/people-with-learning-disabilities-in-england/chapter-6-health-checks-2017-to-2018
Summary
The NHS offers a free health check[footnote 1] every year for people with learning disabilities aged 14 years and above. NHS England have issued guidance for GP practices to improve the identification of people with learning disabilities and flagging for annual health checks on GP records[footnote 2]:
- in 2017 to 2018 147,181 checks were done. This was 13,219 more than the previous year
- in 2017 to 2018, 52% of people with learning disabilities known to their family doctor GP had a check. This was up from 49% the previous year
- learning disability health checks are done by GPs and the nurses who work with them. Not all GP practices do learning disability health checks, but this number is going up too
- in 2017 to 2018, 90% of general practices did at least one learning disability health check. This was up from 84% the previous year
- 95% of patients on GP learning disabilities registers were with a practice doing health checks. This was up from 92% the previous year
- management information tells us more about the performance of the general practices that did do learning disability health checks. These practices:
- did checks for 57% of people with learning disabilities known to them – this was up from 52% the previous year
- did checks for more people aged 18 and older with learning disabilities (58%, up from 53%) than younger people aged 14 to 17 (37%, up from 33%)
- of practices that did health checks, 88% recorded providing Health Action Plans. This was up from 84% the previous year
Numbers of checks each year
The learning disability health checks programme[footnote 1] has changed in several ways since it started in 2008. Figure 1 shows the number of checks done each year and the numbers of people on learning disability registers. The solid part of the bars shows the number of checks done. The outline above shows the number of additional people on the learning disability register. The bars are shaded differently from 2014 to 2015 onwards because both the scheme and the arrangements for learning disability registers changed. The numbers on the bars show the number of people who had a check as a percentage of the number on the register.
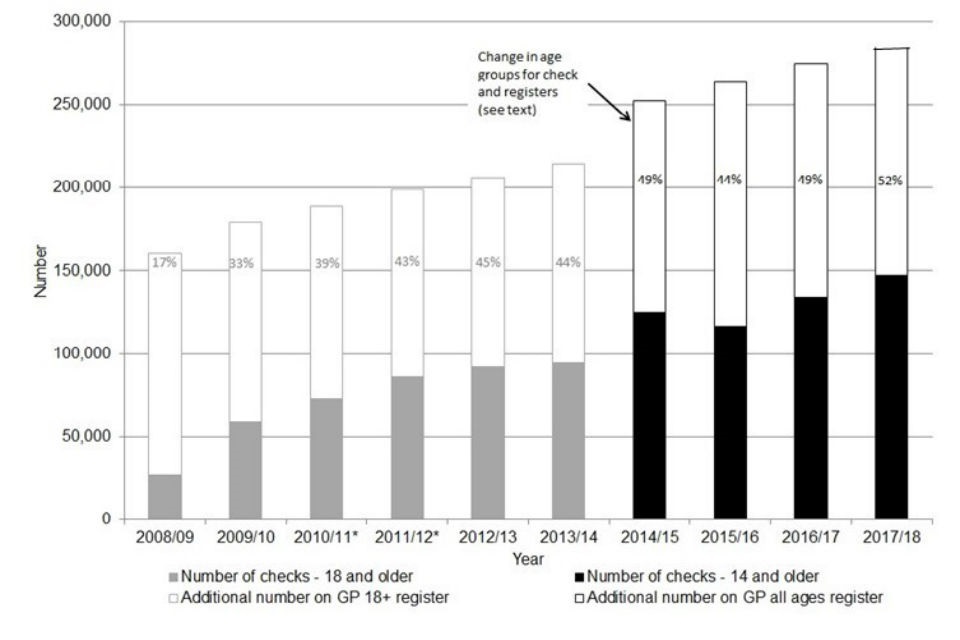
Figure 1: Numbers of learning disability health checks and numbers of people on GP learning disability registers, 2008 to 2009 to the time period 2017 to 2018
From 2013 to 2014 (grey bars) only people with learning disabilities aged 18 or older were recorded on GP learning disability registers and only these people could have checks. From 2014 to 2015 (black bars) people with learning disability aged 14 to 17 were also eligible to have checks and people with learning disabilities of any age were included in registers. So for the first 6 years the percentage figure was a good measure which ideally should have been 100%. In the last 4 years registers included people aged under 14 who are not eligible for checks. Roughly 88% of people on learning disability registers are aged 14 or older. So we would not expect this number to go above this.
The number of checks reported and the number on the register both jumped upwards between 2013 to 2014 and 2014 to 2015. The number of checks reported fell in 2015 to 2016. This is probably not an accurate reflection of what happened. In 2014 to 2015 a new data collection system was introduced. That year a small number of areas reported more checks than people on the register.
In the most recent year, all 3 numbers rose. The number of people on learning disability registers went up by 3.7%. This has been a steady pattern since 2010. The number of checks rose by 9.9%. The number of checks as a percentage of numbers on the learning disability register rose for a second year from 48.9% to 51.7%. Apart from the unreliable figures in 2014 to 2015 it had been fairly static at just under 45% since 2011 to 2012.
Practice participation
Learning disability health checks are done by GPs and the nurses who work with them. But not all GP practices do learning disability health checks. This is important as patients registered with non-participating practices probably won’t get checks. The number of practices participating is going up. The number of patients with learning disability registered with practices that don’t do checks is going down.
The first part of Table 1 shows the total number of practices and the number of them reporting doing at least one health check in each of the last 3 years.
The second part of the table shows the total number of patients on GP registers and the number of them registered with practices who reported doing at least one check each year.
Table 1: Practices doing health checks and patients with learning disabilities registered with practices that do checks
| 2014/15 | 2015/16 | 2016/17 | 2017/18 | |
|---|---|---|---|---|
| All general practices | 7,838 | 7,715 | 7,518 | 7,288 |
| Practices reporting checks | 5,950 | 6,104 | 6,332 | 6,557 |
| Practice participation | 76% | 79% | 84% | 90% |
| 2014/15 | 2015/16 | 2016/17 | 2017/18 | |
|---|---|---|---|---|
| All on learning disability registers | 252,446 | 263,588 | 274,213 | 284,422 |
| On registers with participating practices | 215,123 | 230,920 | 250,983 | 270,181 |
| % registered with participating practices | 85% | 88% | 92% | 95% |
Practice performance
Separate numbers are collected on practices that do checks to see how well they are doing on 2 indicators.
Coverage for younger people
The first 2 of these numbers are about people of different age groups. They show people aged 14 to 17 separately from people aged 18 and older. The older group have been able to get checks since the scheme started in 2008. The younger group have only been included since 2014 to 2015. This is to make sure that when young people with learning disabilities move up from children and young people’s services, the adult services they go to know all about their medical needs.
These coverage numbers should be higher than the overall coverage numbers for 2 reasons. First they leave out practices that aren’t doing any checks. Second the reports from practices that are doing checks give us the numbers eligible in the exact age groups. So these are more precise measures of coverage, though only for participating practices.
Table 2 shows numbers on the learning disability register and numbers having checks in each of these 2 age bands for the last 3 years in the management indicator data items. These numbers were first collected in 2015 to 2016. The numbers of checks are slightly lower that the numbers reported in figure 1 above. This is because data from practices is excluded if it contains certain apparent inconsistencies. Numbers on learning disability registers are substantially lower because non-participating practices are not included here.
Young people aged 14 to 17 are not as well covered as people aged 18 and older. But this is improving. The numbers of checks rose much faster for the younger age group.
Table 2: Numbers on learning disability registers and numbers having checks by age group
| Age 14 to 17 | 2015/16 | 2016/17 | 2017/18 |
|---|---|---|---|
| On learning disability register | 14,211 | 15,335 | 16,513 |
| Had a check | 3,588 | 5,016 | 6,098 |
| Coverage | 25% | 33% | 37% |
| Age 18 and above | 2015/16 | 2016/17 | 2017/18 |
|---|---|---|---|
| On learning disability register | 215,571 | 229,335 | 245,815 |
| Had a check | 98,700 | 121,900 | 142,384 |
| Coverage | 46% | 53% | 58% |
Health Action Plans
People with learning disabilities should get a Health Action Plan at their annual health check. This is one of the specified requirements for checks. A Health Action Plan tells the person and their carers how to improve their health and keep them well over the next year. Not all GPs report giving people Health Action Plans yet.
It is unclear what proportion of patients having a check got a health action plan because there are problems with this data collection. However we can say how many of the practices that did health checks recorded doing at least some Health Action Plans. Table 3 shows the numbers.
Table 3: Proportion of practices providing Health Action Plans
| 2015/16 | 2016/17 | 2017/18 | |
|---|---|---|---|
| Practices doing checks | 6,104 | 6,332 | 6,557 |
| Practices reporting Health Action Plans | 4,786 | 5,337 | 5,789 |
| Proportion reporting Health Action Plans | 78% | 84% | 88% |
Variations around the country
The coverage of the health check scheme varies considerably around the country. In 2018, the CCG with the highest coverage (Eastern Cheshire) reported checks being done on 78% of people on GP learning disability registers. One other CCG (Knowsley) achieved better than 75% coverage. At the other end of the scale, 26 CCGs achieved coverage of less than 40%, 5 of them less than 30%.
CCGs vary in their performance in getting health checks done for people with learning disabilities. Figure 2 shows the variation in the 5 regions currently recognised by NHS England. The numbers of CCGs in regions varies very considerably (shown in the legend). The graph shows a box for each region which spans the range of the middle half (a quarter above the middle reading and a quarter below. The whiskers and dots identify the range of coverage values.
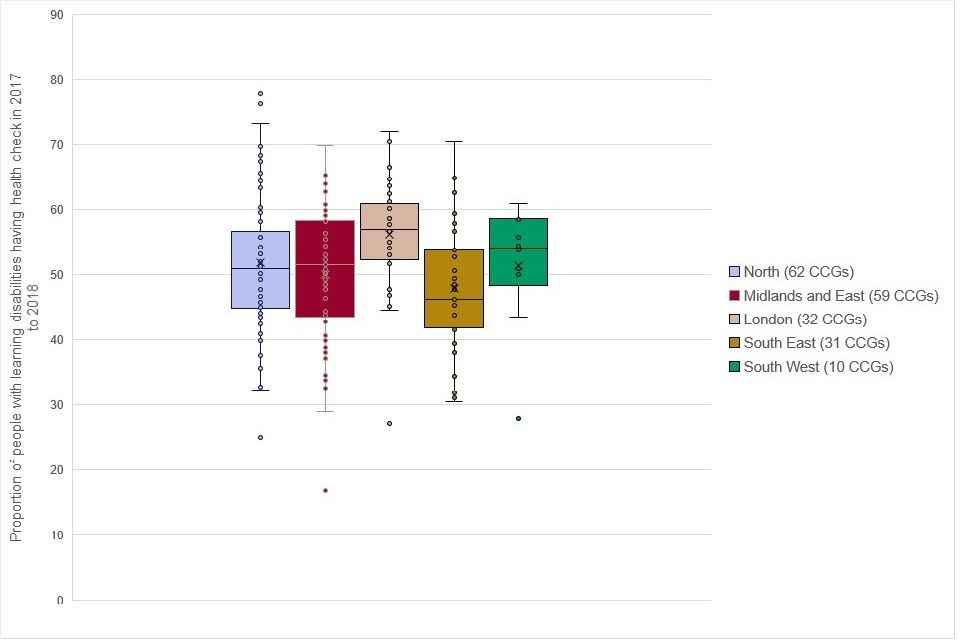
Figure 2: Range of coverage performance by Clinical Commissioning Groups in each NHS England region
References
-
NHS England Annual health checks ↩ ↩2
-
NHS England (2019) Improving identification of people with a learning disability: guidance for general practice ↩