Chapter 3: safeguarding
Updated 27 January 2020

© Crown copyright 2020
This publication is licensed under the terms of the Open Government Licence v3.0 except where otherwise stated. To view this licence, visit nationalarchives.gov.uk/doc/open-government-licence/version/3 or write to the Information Policy Team, The National Archives, Kew, London TW9 4DU, or email: psi@nationalarchives.gov.uk.
Where we have identified any third party copyright information you will need to obtain permission from the copyright holders concerned.
This publication is available at https://www.gov.uk/government/publications/people-with-learning-disabilities-in-england/chapter-3-safeguarding
Summary
Local authorities provide annual data on safeguarding processes to NHS Digital:
In 2017 to 2018, 14,655 adults with a primary reason for support of learning disability in England were involved in a Section 42 safeguarding enquiry. This was 10% of all adults involved in Section 42 safeguarding enquiries, compared to 12.9% in 2015 to 2016.
The number of people recorded as being involved in Section 42 safeguarding enquiries increased greatly from 2015 to 2016 up to 2016 to 2017 for all other groups, with a smaller increase for people with learning disabilities.
There is wide variation in safeguarding enquiry rates for adults with learning disabilities across local authorities in England, with a median of 29.4 adults with learning disabilities per 100,000 adult general population.
People with learning disabilities in England
National statistical information on the characteristics of people with learning disabilities, and the services and supports they and their families use, is collected by several government departments.
The aim of People with Learning Disabilities in England, produced by the Learning Disabilities Team at Public Health England (PHE), is to provide a concise summary of this information.
Previous versions have been produced as a single report, most recently People with Learning Disabilities in England 2015[footnote 1]. In this version, individual sections are updated as data become available to allow for more regular and timely updates of national statistics.
Safeguarding
For the first time in the year 2010 to 2011, all local authorities with social services responsibilities were mandated to return statistics concerning the number of vulnerable people aged 18 or over, who they had been made aware of with regards to potential abuse (Abuse of Vulnerable Adults, AVA). This data collection was repeated in 2011 to 2012 and 2012 to 2013[footnote 2].
These statistics are fully reported in a previous report, People With Learning Disabilities in England 2013[footnote 3], including information on referrals to local authorities for safeguarding issues, the nature of the alleged abuse and the relationship of the alleged perpetrator to the person with learning disabilities, and the outcomes of these referrals.
From 2013 to 2014 onwards, AVA returns have been replaced by the Safeguarding Adults Return[footnote 4] [footnote 5] [footnote 6] [footnote 7]. Publications from both these sets of returns are designated ‘experimental statistics’, as they relate to new or rapidly developing areas of activity where definitive statistics are still being developed. AVA returns up to 2014 to 2015 are reported in People With Learning Disabilities in England 2015[footnote 1]. Due to various changes in data collection methods, only data from 2015 to 2016 onwards can be considered continuous, and these are reported here.
During this time period, disaggregated data for people with a primary reason for support of learning disabiltiies are available for the number of individuals involved in safeguarding concerns, the number of individuals involved in Section 42 safeguarding enquiries, and the number of individuals involved in other safeguarding enquiries.
It is important to note the partial nature of much of this infomation. Almost all local authories (for example 149 out of 152 local authorities in 2017 to 2018) provided information on the number of people with learning disabilities involved in Section 42 safeguarding enquiries.
However, only 107 local authorities (70.5%) in 2017 to 2018 (up from 66 local authorities, 43.4% in 2015 to 2016) provided information on the number of people with learning disabilities involved in other safeguarding enquiries. In 2017 to 2018,128 local authorities (84.2%) provided information on the number of people with learning disabilities involved in safeguarding concerns, up from 108 local authorities (71.1%) in 2015 to 2016.
Therefore, in this section, only information on the number of people with learning disabilities involved in Section 42 safeguarding enquiries will be reported. Due to the relatively small amount of data presented, accompanying data tables have not been produced for this section.
Figure 1 shows that 14,655 people with learning disabilities (10% of all people involved in Section 42 safeguarding enquiries) were recorded as being involved in Section 42 safeguarding enquiries in 2017 to 2018, compared to 131,860 other people.
Equivalent figures for previous years are:
- 2015 to 2016: 14,815 people with learning disabilities vs 99,805 other people (12.9%)
- 2016 to 2017: 14,890 people with learning disabilities vs 133,265 other people (10.1%)
The number of people recorded as being involved in Section 42 safeguarding enquiries increased greatly from 2015 to 2016 up to 2016 to 2017 for all other groups, with a smaller increase for people with learning disabilities.
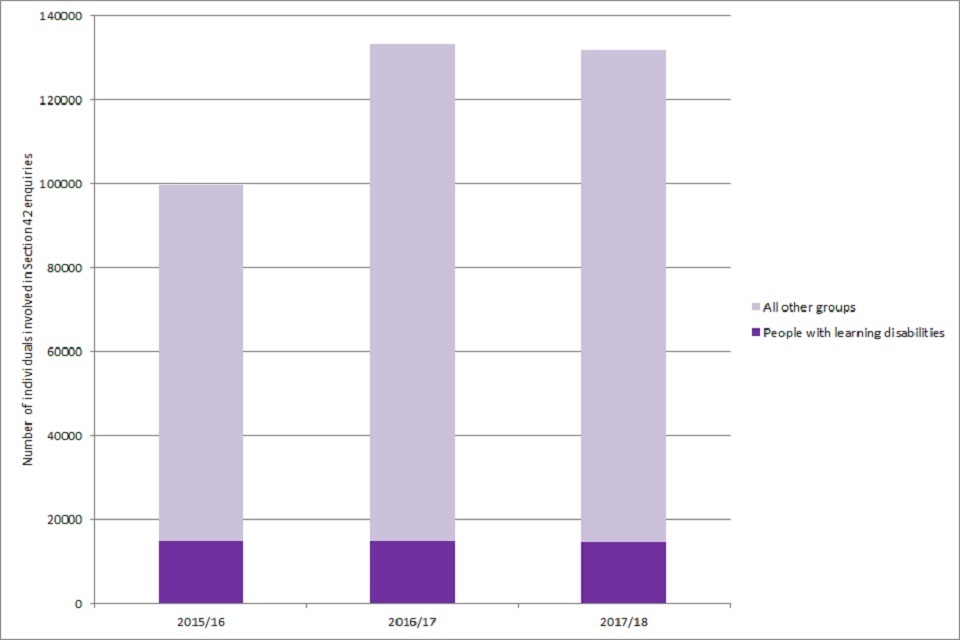
Figure 1: Number of individuals recorded as being involved in Section 42 safeguarding enquiries 2015/16 to 2017/18 (SAR) – people with learning disabilities vs all other groups
Figure 2 presents geographical variation in the rates at which adults with learning disabilities were involved in Section 42 safeguarding enquiries, where each column represents the rate of adults with learning disabilities involved in Section 42 safeguarding enquiries per 100,000 adult general population[footnote 8] for each local authority, ordered from lowest to highest.
In the middle ranked local authority in England in terms of safeguarding rates, 29.4 adults with learning disabilities per 100,000 adult general population were involved in Section 42 safeguarding enquiries, although this varied greatly between local authorities.
The 10 councils reporting the highest safeguarding rates for people with a primary support reason of learning disability reported rates from 68.3 per 100,000 upwards, whilst the 10 councils reporting the lowest safeguarding rates reported rates of 11.3 per 100,000 or lower; both extremes include a range of types of council across different regions.
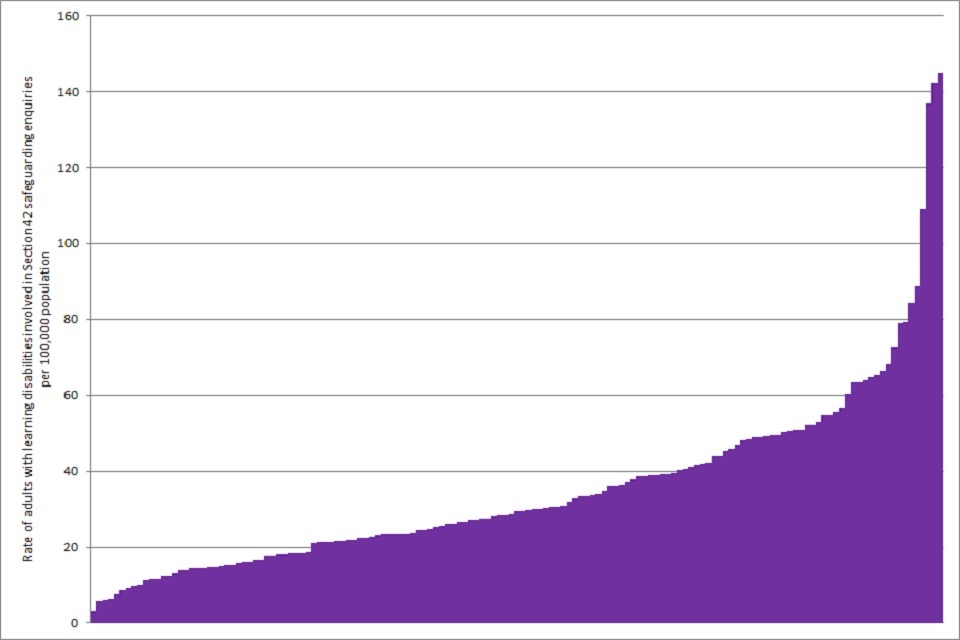
Figure 2: Variations across local authorities in the rate of adults with a primary support reason of learning disabilities involved in Section 42 safeguarding enquiries per 100,000 general adult population
References
-
Public Health England People with Learning Disabilities in England 2015 London: Public Health England; 2016. ↩ ↩2
-
NHS Digital. Abuse of Vulnerable Adults in England - 2012-13, Final report, Experimental statistics Leeds: NHS Digital; 2014. ↩
-
Hatton C, Emerson E, Glover G, Robertson J, Baines S, Christie A. People with Learning Disabilities in England 2013 London: Public Health England; 2014. ↩
-
NHS Digital. Safeguarding Adults, Annual Report, England 2014-15, Experimental statistics Leeds: NHS Digital; 2015. ↩
-
NHS Digital. Safeguarding Adults, Annual Report, England 2015-16, Experimental statistics Leeds: NHS Digital; 2016. ↩
-
NHS Digital. Safeguarding Adults, Annual Report, England 2016-17, Experimental statistics Leeds: NHS Digital; 2017. ↩
-
NHS Digital. Safeguarding Adults, Annual Report, England 2017-18, Experimental statistics Leeds: NHS Digital; 2017. ↩
-
Office for National Statistics. Population estimates for UK, England and Wales, Scotland and Northern Ireland. London: ONS; 2018. ↩