Chapter 2: paid employment
Updated 27 January 2020

© Crown copyright 2020
This publication is licensed under the terms of the Open Government Licence v3.0 except where otherwise stated. To view this licence, visit nationalarchives.gov.uk/doc/open-government-licence/version/3 or write to the Information Policy Team, The National Archives, Kew, London TW9 4DU, or email: psi@nationalarchives.gov.uk.
Where we have identified any third party copyright information you will need to obtain permission from the copyright holders concerned.
This publication is available at https://www.gov.uk/government/publications/people-with-learning-disabilities-in-england/chapter-2-employment
Summary
Local authorities in England continue to report very low rates of paid and self employment amongst working age adults with learning disabilities using long-term social care:
- in 2017 to 2018, 6% of working age adults with learning disabilities in England (7,907 people) getting long-term social care support were in paid or self employment
- employment rates were higher for men (6.6%) than women (5.2%)
- most of these adults with learning disabilities (68.3%) were working for less than 16 hours per week
- there is marked variation across local authorities in reported rates of paid employment
- paid employment rates for adults with learning disabilities do not seem to be increasing over time
- there are no regular national statistics reported in England concerning the paid employment of the wider population of working age adults with learning disabilities
People with learning disabilities in England
National statistical information on the characteristics of people with learning disabilities, and the services and supports they and their families use, is collected by several government departments. The aim of People with Learning Disabilities in England, produced by the Learning Disabilities Team at Public Health England (PHE), is to provide a concise summary of this information.
Previous versions have been produced as a single report, most recently People with Learning Disabilities in England 2015[footnote 1]. In this version of People with Learning Disabilities in England, individual sections are updated as data become available, to allow for more regular and timely updates of national statistics.
Employment
Councils with adult social services responsibilities provide data to NHS Digital on working age adults with learning disabilities in paid or self employment. Up to 2013 to 2014, the statistics concerned adults with learning disabilities aged 18 to 64 years known to councils with adult social services responsibilities (CASSRs) in paid or self employment and in voluntary employment[footnote 2].
As part of a larger group of changes to data collection relating to social care, from 2014 to 2015 the statistics concern adults with a primary support need of learning disabilities aged 18 to 64 years who are receiving long-term social care support from councils with social services responsibilities[footnote 3] [footnote 4] [footnote 5] [footnote 6] [footnote 7]. As such, statistics over the time period 2013 to 2014 up to 2014 to 2015 cannot be treated as continuous. There have also been some changes to the data collected and reported concerning people with learning disabilities in employment.
The discontinuity in data from 2013 to 2014 up to 2014 to 2015 is shown in graphs by a gap and different shading for data from 2014 to 2015 onwards, and is clearly described in accompanying tables.
Figure 1 below shows the number of working age adults (aged 18 to 64 years) with learning disabilities engaged in any paid or self employment (see Table 1 in the accompanying PDF document of data tables for more details - ASCOF 1E, ASC-CAR L1 and SALT LTS004a).
Up to 2013 to 2014, the data concern working age adults with learning disabilities known to councils (and include data on voluntary work) from 2014 to 2015 onwards the data concern working age adults with a primary support reason of learning disabilities receiving long-term social care support, and focus on paid or self employment only.
Setting aside the first year of incomplete data collection (2008 to 2009) the number of adults in any paid/self employment rose slightly to a peak of 9,905 people in 2011 to 2012, dropping gradually to 9,580 people in 2013 to 2014.
Under a different data collection regime from 2014 to 2015 onwards, the number of adults with a primary support reason of learning disability in any paid or self employment was recorded as 7,472 people in 2014 to 2015 and increased slightly to 7,907 people in 2017 to 2018.

Figure 1: Number of working age (18 to 64 years) adults with learning disabilities in England engaged in any paid/self employment 2008/09 to 2017/18
Figure 2 below presents information on the percentage of working age adults with learning disabilities (aged 18 to 64 years) known to social services (to 2013 to 2014) or receiving long-term social care (from 2014 to 2015) who are engaged in any paid or self employment (see Table 1 in the accompanying PDF data tables document for more details).
As Figure 2 shows, the overall paid or self employment rate for working age adults with learning disabilities reached a peak at 7.1% in 2011 to 2012, and was at 6.7% in 2013 to 2014. In 2014 to 2015 the employment rate was 6%, and after a dip had returned to 6% in 2017 to 2018. Figure 2 also shows employment rates broken down by gender, with men with a primary support reason of learning disability consistently reporting higher employment rates higher than women with a primary support reason of learning disability.
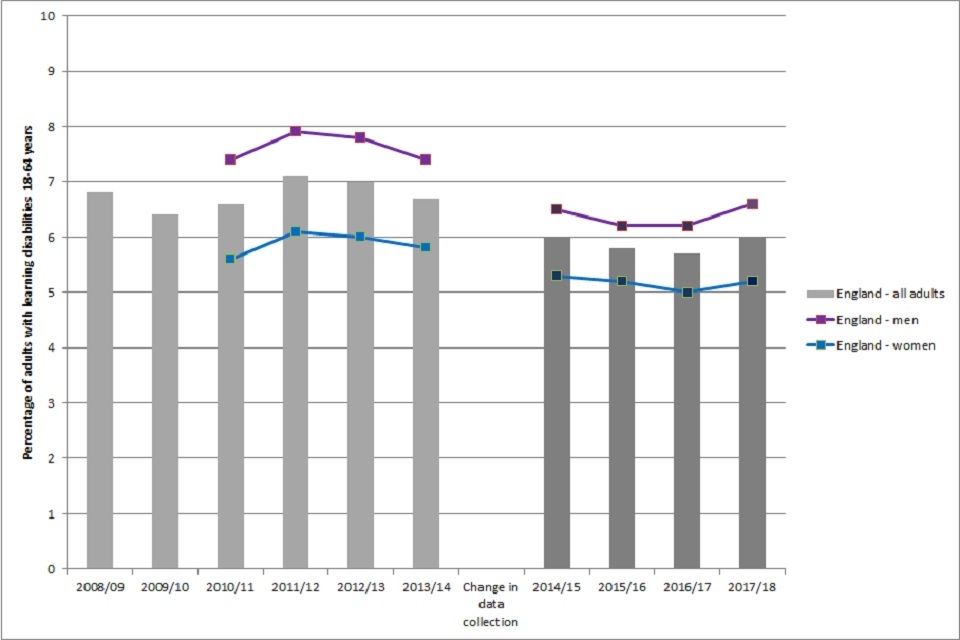
Figure 2: The percentage of working age adults with learning disabilities (18 to 64 years) in England who are in any paid/self employment 2008/09 to 2017/18
Information on self or paid employment rates is also available by former Government Office Region, presented in Figure 3 from 2014 to 2015 up to 2017 to 2018 (data over a longer timeline is available in Table 2 in the accompanying PDF data tables document).
In 2017 to 2018, the regions with the highest employment rates were Eastern (7.5%), London (7.5%) and Yorkshire & Humber (7.4%) - the regions with the lowest employment rates were the East Midlands, the West Midlands and the North West (all 4.3%).
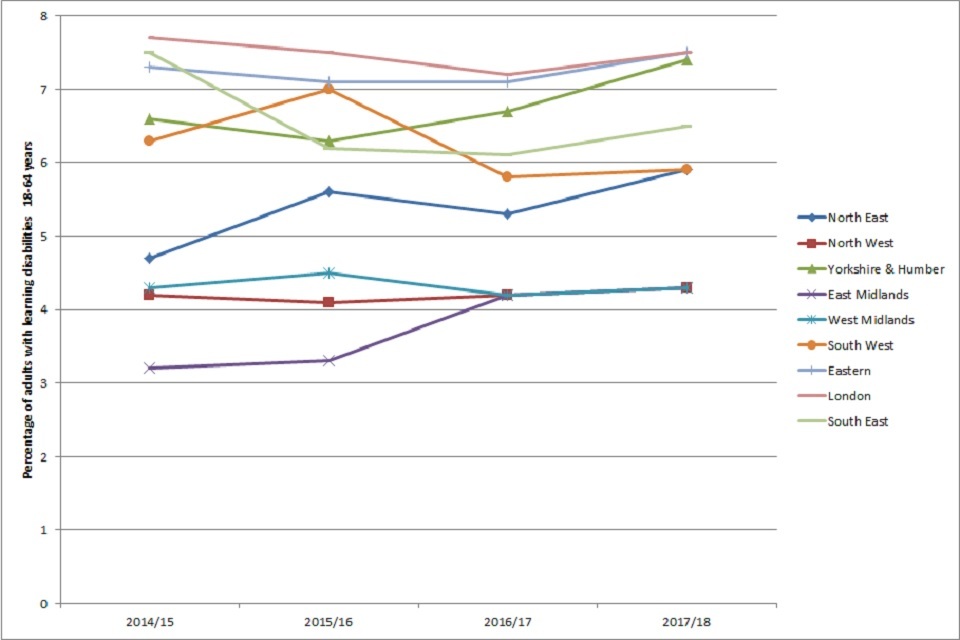
Figure 3: The percentage of working age adults with learning disabilities (18 to 64 years) who are in any paid/self employment by English region 2014/15 to 2017/18
Figure 4 presents geographical variation in reported employment rates by individual local authority where each column represents the paid employment rate reported for each local authority, ordered from lowest to highest (Figure 4 does not include the City of London (reported employment rate 0%) or the Isles of Scilly (reported employment rate 100%).
In the middle ranked local authority in England in terms of employment rates, 5.4% of working age adults with a primary support reason of learning disability were in any form of paid employment, although this varied greatly between local authorities.
The 10 councils reporting the highest rates of paid or self employment for people with a primary support reason of learning disability reported rates from 15.2% upwards, whilst the 10 councils reporting the lowest employment rates reported rates of 1.4% or lower - both extremes include a range of types of council across different regions.
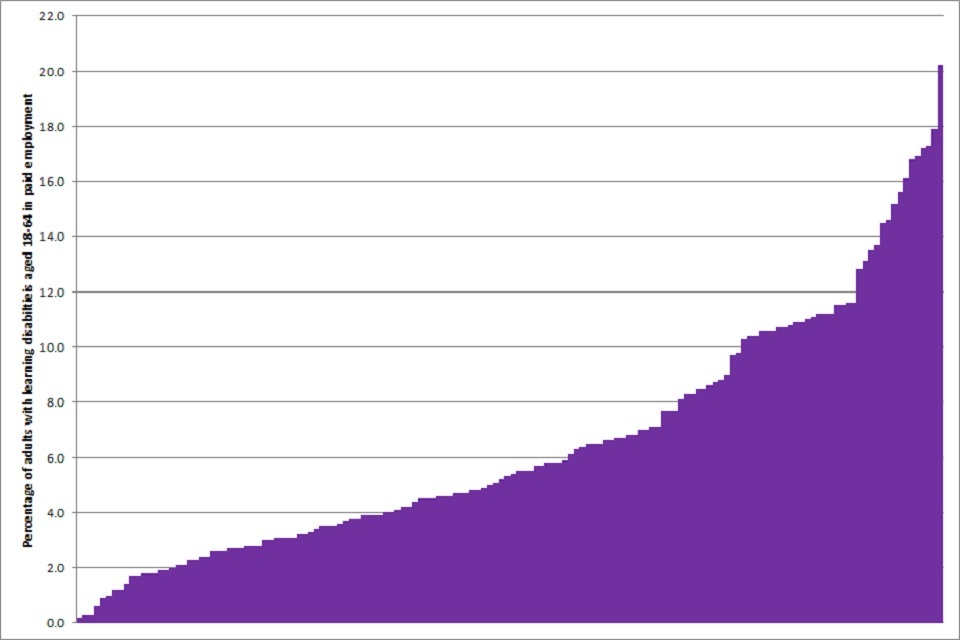
Figure 4: Variations across local authorities in the percentage of adults with a primary support reason of learning disability aged 18 to 64 years in any form of paid/self employment: 2017/18
The paid or self employment statistics can also be broken down according to the number of hours worked per week. Figure 5 below presents this information (see Table 1 in the accompanying data tables PDF document) over time up to 2013 to 2014, and for 2014 to 2015 up to 2017 to 2018.
As Figure 5 shows, the number of adults with learning disabilities working 16 hours or more per week stayed fairly static from 2009 to 2010 (3,020 people) to 2013 to 2014 (2,940 people); in 2014 to 2015 this figure was 2,185 people and in 2017 to 2018 the figure had increased to 2,505 people.
The number of adults with learning disabilities working less than 16 hours per week peaked in 2012 to 2013 (6,925 people) and dropped to 6,635 people in 2013 to 2014. In 2014 to 2015 there were 5,305 people working less than 16 hours per week, increasing slightly to 5,400 people in 2017 to 2018.
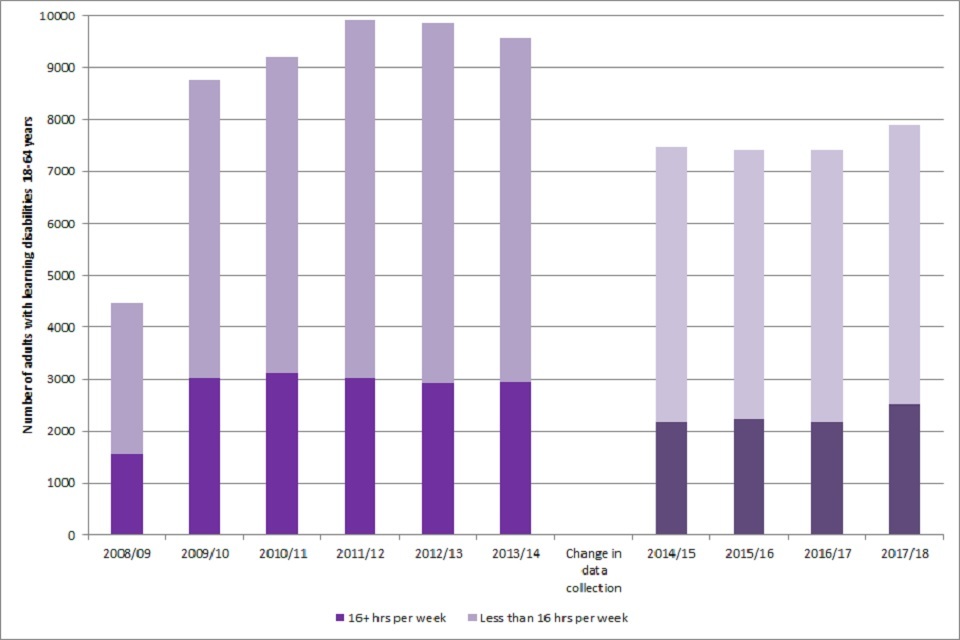
Figure 5: Number of working age (18 to 64 years) adults with learning disabilities in England in paid employment - hours per week: 2008/09 to 2017/18
From 2014 to 2015 onwards, councils also report statistics on the number of working age adults with a primary support reason of learning disability getting long-term social care support who are:
- in paid or self employment - not in paid employment but actively seeking work
- not in paid employment and not actively seeking work
- people for whom their employment status is unknown
These data are presented below in Figure 6 for 2014 to 2015 through to 2017 to 2018 and show small increases in the numbers of people in employment or seeking work and a larger increase in the number of people not actively seeking work, although these increases may be partly a function of a decrease in the number of people where their employment status is unknown.
As Figure 6 shows, in 2017 to 2018, 6% of working age adults with a primary support reason of learning disability were in paid or self employment, 10.5% were not in employment but actively seeking work - and over half (55.5%) were not in employment and not actively seeking work. The employment status of over a quarter of adults with a primary support reason of learning disability (27.9%) was recorded as unknown.

Figure 6: Employment status of adults with learning disabilities of working age (aged 18 to 64) in and out of work: 2014/15 to 2017/18
-
Public Health England People with Learning Disabilities in England 2015 London: Public Health England, 2017 ↩
-
NHS Digital Community Care Statistics: Social Services Activity, England 2013-14 Leeds: NHS Digital, 2014 ↩
-
NHS Digital Community Care Statistics: Social Services Activity, England 2014-15 Leeds: NHS Digital, 2015 ↩
-
NHS Digital Community Care Statistics: Social Services Activity, England 2015-16 Leeds: NHS Digital, 2016 ↩
-
NHS Digital Adult Social Care Activity and Finance Report, England 2016-17 Leeds: NHS Digital, 2017 ↩
-
NHS Digital Measures from the Adult Social Care Outcomes Framework, England 2016-17 Leeds: NHS Digital, 2017 ↩
-
NHS Digital Measures from the Adult Social Care Outcomes Framework, England 2017-18 Leeds: NHS Digital, 2018 ↩