Chapter 1: education and children’s social care
Updated 27 January 2020

© Crown copyright 2020
This publication is licensed under the terms of the Open Government Licence v3.0 except where otherwise stated. To view this licence, visit nationalarchives.gov.uk/doc/open-government-licence/version/3 or write to the Information Policy Team, The National Archives, Kew, London TW9 4DU, or email: psi@nationalarchives.gov.uk.
Where we have identified any third party copyright information you will need to obtain permission from the copyright holders concerned.
This publication is available at https://www.gov.uk/government/publications/people-with-learning-disabilities-in-england/chapter-1-education-and-childrens-social-care-updates
Summary
In 2018, 67,765 children in England had a statement of special educational needs (SEN) or an Education, Health and Care (EHC) plan and were identified as having a primary SEN associated with learning disabilities, including:
-
28,241 children identified as having Moderate Learning Difficulties (MLD), a reduction of 31% from 2010
-
29,492 children identified as having Severe Learning Difficulties (SLD), an increase of 17% from 2010
-
10,032 children identified as having Profound Multiple Learning Difficulties (PMLD), an increase of 16% from 2010
In 2018, 228,315 children in England who were identified at a broader level of SEN support were identified as having a primary SEN associated with learning disabilities. Of these, 98% were identified as having MLD, 1% SLD and less than 1% PMLD, and together they constituted 24% of all children recorded at SEN support.
The majority of children identified as having MLD, SLD and PMLD are boys.
Children with MLD, SLD and PMLD are more likely to be eligible for Free School Meals (an indicator of household poverty) than children without an identified SEN.
In 2018, 26% of children with a statement or EHC plan and with a primary SEN associated with learning disabilities were being educated in mainstream schools, including:
- 44% of children with a primary SEN of MLD, down from 51% in 2010
- 12% of children with a primary SEN of SLD, down from 18% in 2010
- 15% of children with a primary SEN of PMLD, similar to 2010 (15%)
In terms of authorised absences, in 2016/17 children with a primary SEN associated with learning disabilities were more likely than other children to be absent from school, with children with PMLD on average missing almost 1-in-7 half-day sessions due to authorised absences.
Levels of unauthorised absences were low for all groups of children, with unauthorised absences slightly more likely for children with a primary SEN of MLD.
Children with a primary SEN of MLD were markedly more likely to be excluded (fixed-period exclusion 4.4%, permanent exclusion 0.2%) than children with no SEN (fixed-period exclusion 1.5%, permanent exclusion 0.05%).
Children with a primary SEN of PMLD were less likely to be excluded (fixed-term exclusion 0.3%, no permanent exclusions) than children with no SEN.
With regard to children’s social care, in 2015/16 18,030 children with a primary SEN need of MLD were children in need or looked after children, compared to 9,650 children with a primary SEN need of SLD and 4,860 children with a primary need of PMLD.
Children with a primary need of MLD, SLD or PMLD represented 9.2% of all looked after children, 5.6% of all children with a Child Protection Plan, and 8.5% of all children with a Children in Need Plan.
People with learning disabilities in England
National statistical information on the characteristics of people with learning disabilities, and the services and supports they and their families use, is collected by several government departments. The aim of People with Learning Disabilities in England, produced by the Learning Disabilities Team at Public Health England (PHE), is to provide a concise summary of this information.
Previous versions have been produced as a single report, most recently People with Learning Disabilities in England 2015[footnote 1]. In this version of People with Learning Disabilities in England, individual sections are updated as data becomes available, to allow for more regular and timely updates of national statistics.
Education
Information on the education of children with SEN associated with learning disabilities is provided in a series of annual reports published by the Department for Education (DfE). The Special Educational Needs (Information) Act 2008 requires the Secretary of State for Education to publish information about pupils in England with SEN each calendar year in order to help improve the wellbeing of these pupils. This requirement has led to the publication between 2009 and 2014 of the annual series Children with Special Educational Needs: An Analysis[footnote 2] [footnote 3] [footnote 4] [footnote 5] [footnote 6] [footnote 7]. In 2015, the format of this reporting changed to a summary report and extensive signposting of potential users to relevant source data[footnote 8] [footnote 9] [footnote 10].
The primary source of information for reporting on SEN is the DfE’s National Pupil Database. Children with SEN in this database are identified through the school census. This survey, undertaken each school term, collects information on all children enrolled in all English state-funded schools and non-profit making independent special schools during that term. Schools have a statutory responsibility to return school census data under section 537A of the Education Act 1996.
Children not included in the school census include those being educated at home, in independent (non-state funded) mainstream schools or in for-profit independent special schools. It has been estimated that the school census includes information on approximately 97% of English children of statutory school age[footnote 11].
Unless specified, 2017/18 information contained in this chapter is extracted from the statistical first releases Special educational needs in England: January 2018[footnote 12] and Special Educational Needs: analysis and summary of data sources: 2018 Update[footnote 10].
How many school children have learning disabilities?
The identification of SEN prior to 1 September 2014 was undertaken at 3 levels which were:
- School Action (extra or different help is provided to the child)
- School Action Plus (extra or different help is provided plus the class teacher and the school’s special educational needs co-ordinator (SENCO) receive advice or support from outside specialists, for example, specialist teachers, an educational psychologist, a speech and language therapist or other health professionals)
- statement of SEN (a legal document that specifies the child’s needs and the extra help they should receive)
All schools were obliged to provide information on the type of primary and, if relevant, secondary SEN for children at School Action Plus and children with a statement of SEN. Three categories of SEN are associated with learning disability: moderate learning difficulty (MLD), severe learning difficulty (SLD) and profound multiple learning difficulty (PMLD).
The special educational needs and disability (SEND) provisions in the Children and Families Act 2014 were introduced on 1 September 2014. From that date, any child or young person who was newly referred to a local authority for assessment was considered under the new EHC plan assessment process. The legal test of when a child or young person requires an actual EHC plan remained the same as that for a statement under the Education Act 1996. As such, information on children with a statement of SEN or an EHC plan should be comparable over time across the introduction of these legislative changes.
However, the SEND provisions in the Children and Families Act 2014 combined previous ‘School Action’ and ‘School Action Plus’ categories and replaced them with a new category ‘SEN support’. Information on type of SEN for all children on SEN support was collected from January 2015. As a result, information on children with a SEN who do not have a statement or an EHC plan will not be comparable over time across the introduction of these legislative changes.
Varying time periods have been allowed to make the transition between the old and new systems. These are:
- transfers to SEN Support for those currently at school action or school action plus must be completed by Summer 2015
- transfers to EHC plans for those that currently have a statement of SEN must be complete by Spring 2018
Figure 1 (detailed tables are available in an accompanying PDF file - see Table 1) shows the number of children with a statement of SEN or an EHC plan and a primary SEN associated with learning disabilities in state-funded primary, secondary and special schools and non-maintained special schools in England from 2010 to 2018.
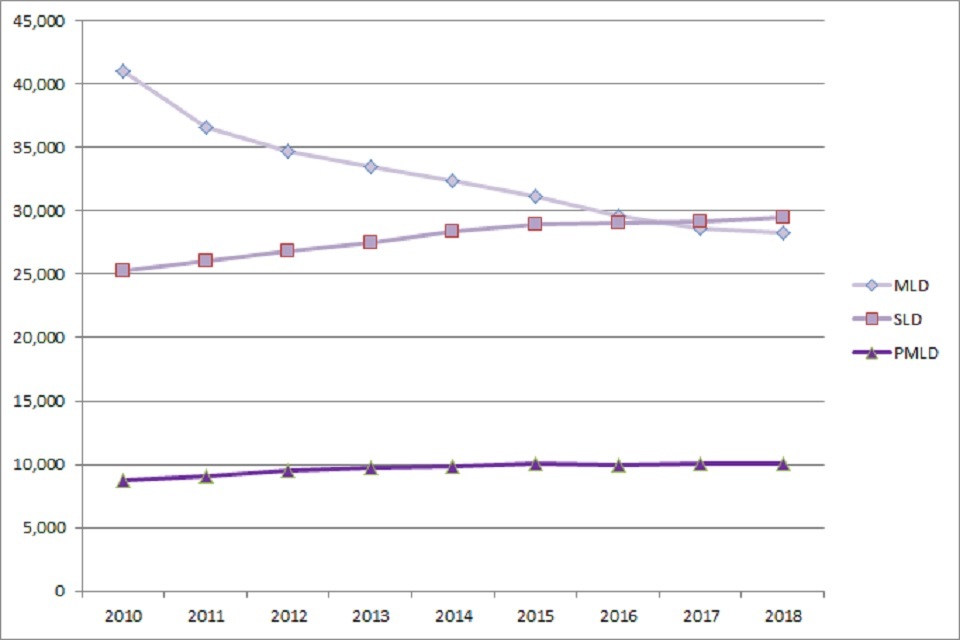
Figure 1: Number of children with a statement of SEN or an EHC plan and a primary SEN of MLD, SLD or PMLD in state-funded primary, secondary and special schools and non-maintained special schools in England 2010 to 2018
In 2018, 67,765 children in England had a statement of SEN or an EHC plan and were identified as having a primary SEN associated with learning disabilities. Of these, 42% were identified as having MLD (28,241 children), 44% SLD (29,492 children) and 15% PMLD (10,032 children). Together, these children constituted 29% of all children in England with a statement of SEN or an EHC plan.
Between 2010 and 2018, the number of children in England who had a statement of SEN or an EHC plan and were identified as having a primary SEN associated with learning disabilities reduced by 10%. This reduction was driven by a marked reduction in the number of children identified with MLD (31% over the period), attenuated by increases in the smaller numbers of children identified with SLD (17% over the period) and PMLD (16% over the period).
Over the same time period, however, the total number of children on school rolls increased by 7.0%. As a result, the percentage of children with a statement of SEN or an EHC plan who had a primary SEN associated with learning disabilities decreased from 0.93% in 2010 to 0.78% in 2018.
As noted above, the collection of information on children with SEN who do not have a statement/EHC plan changed in 2015. Between 2010 and 2014, information on the type of SEN was only reported for children at School Action Plus in the assessment of SEN, and not reported for children at the School Action stage. Since 2015, information on the type of SEN has been reported for children requiring SEN Support, a new category that combines the previous School Action Plus and School Action stages in the assessment of SEN.
Figure 2 (for further details see Table 2 in the separate PDF file) shows the number of children at School Action Plus who have a primary SEN associated with learning disabilities in state-funded primary, secondary and special schools and non-maintained special schools in England from 2010 to 2014.
In 2014, 134,960 children in England were identified at the School Action Plus level and were identified as having a primary SEN associated with learning disabilities. Of these, 96% were identified as having MLD, 3% SLD and 1% PMLD. Between 2010 and 2014, the number of children in England at School Action Plus who were identified as having a primary SEN associated with learning disabilities reduced by 25%. This reduction was driven by a marked reduction in the number of children identified with MLD (25% over the period).
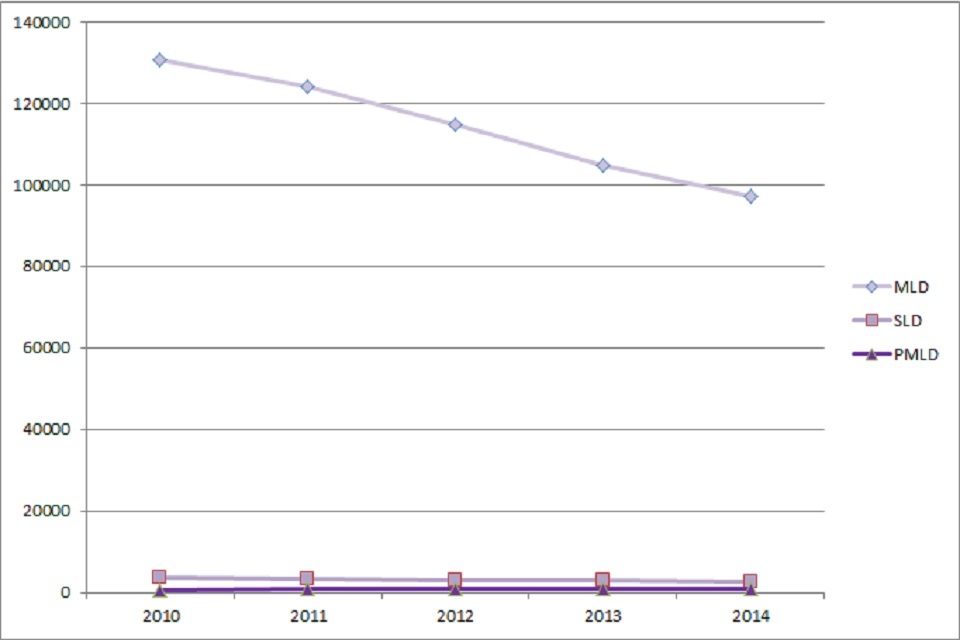
Figure 2: Number of children at School Action Plus and a primary SEN of MLD, SLD or PMLD in state-funded primary, secondary and special schools and non-maintained special schools in England, 2010 to 2014
Figure 3 (for further details see Table 3 in the separate PDF document) shows the number of children at SEN Support who have a primary SEN associated with learning disabilities in state-funded primary, secondary and special schools and non-maintained special schools in England from 2015 to 2018.
In 2017, 228,315 children in England who were identified at SEN support were identified as having a primary SEN associated with learning disabilities. Of these, 98% were identified as having MLD, 1% SLD and less than 1% PMLD, and together they constituted 24% of all children recorded at SEN support. As yet, from 2015 to 2018, there have been no clear trends.
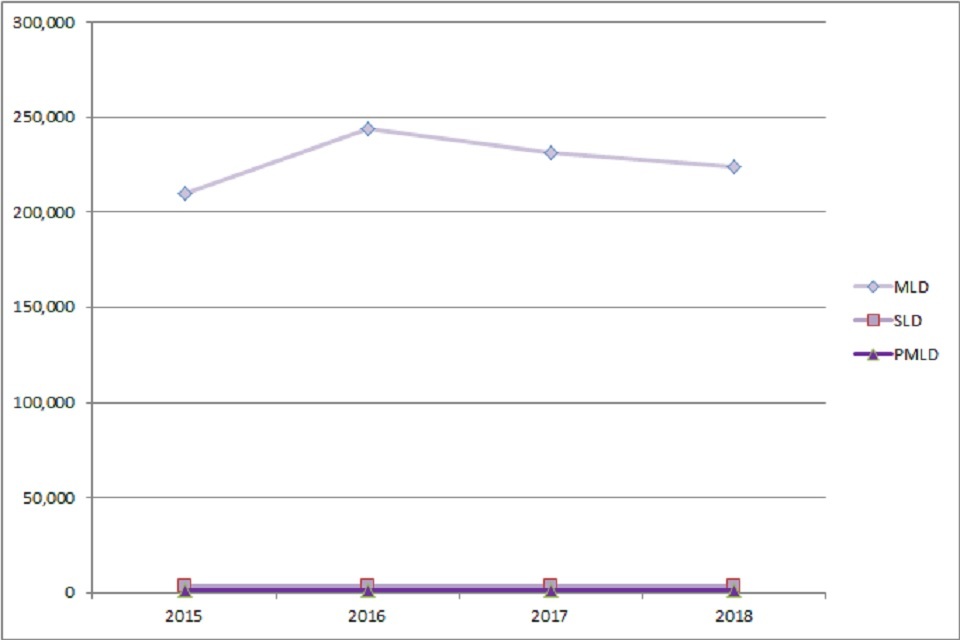
Figure 3: Number of children at SEN Support and a primary SEN of MLD, SLD or PMLD in state-funded primary, secondary and special schools and non-maintained special schools in England, 2015 to 2018
As well as recording the primary SEN need of children, an additional secondary SEN need can optionally be recorded.
In 2018, among the 28,241 children with a primary SEN of MLD and a statement/EHC plan, a secondary SEN was recorded for just over half of these children (52%). Secondary SEN needs recorded for 5% or more of children with a primary SEN of MLD and a statement/EHC plan were:
- speech, language and communication needs (6,678 children, 23.6%)
- social, emotional and mental health (2,597 children, 9.2%)
- autistic spectrum disorder (2,106 children, 7.5%)
In 2018, among the 29,492 children with a primary SEN of SLD and a statement/EHC plan, a secondary SEN was recorded for just over half of these children (52%). Secondary SEN needs recorded for 5% or more of children with a primary SEN of SLD and a statement/EHC plan were:
- autistic spectrum disorder (5,698 children,19.3%)
- speech, language and communication needs (4,517 children, 15.3%)
- physical disability (1,891 children, 6.4%)
In 2018, among the 10,032 children with a primary SEN of PMLD and a statement/EHC plan, a secondary SEN was recorded for just under half of these children (46%). Secondary SEN needs recorded for 5% or more of children with a primary SEN of PMLD and a statement/EHC plan were:
- physical disability (1,237 children, 12.3%)
- visual impairment (1,117 children, 11.1%)
- speech, language and communication needs (709 children, 7.1%)
- autistic spectrum disorder (535 children, 5.3%)
In addition, there are also children with a different primary SEN and a statement/EHC plan where learning disability is recorded as a secondary SEN.
In 2018, among all children with a statement/EHC plan, 14,531 children were recorded as having a secondary SEN of MLD. The most common primary SEN categories where there was also a secondary SEN of MLD were:
- speech, language and communication needs (5,081 children)
- autistic spectrum disorder (3,879 children)
- social, emotional and mental health (2,653 children)
- physical disability (1,394 children)
In 2018, among all children with a statement/EHC plan, 7,481 children were recorded as having a secondary SEN of SLD. By far the most common primary SEN category where there was also a secondary SEN of SLD was autistic spectrum disorder (4,826 children).
In 2018, among all children with a statement/EHC plan, 982 children were recorded as having a secondary SEN of PMLD. The most common primary SEN categories where there was also a secondary SEN of PMLD were physical disability (324 children) and autistic spectrum disorder (211 children).
In total, in 2018 there were:
- 42,772 children with a statement/EHC plan and a primary or secondary SEN of MLD
- 36,973 children with a statement/EHC plan and a primary or secondary SEN of SLD and
- 11,014 children with a statement/EHC plan and a primary or secondary SEN of PMLD
Variation in the identification of learning disabilities among children
Gender
All forms of SEN associated with learning disabilities are more common among boys, reflected in the DfE statistics which report 4.4% of all boys and 2.9% of all girls being identified as having a primary SEN associated with learning disabilities (see Table 4 in the separate PDF file). Within the group of children with an identified primary SEN of MLD (at SEN Support or statement/EHC plan level), 60.5% were boys, for children with SLD 65.1% were boys, and for children with PMLD 57.1% were boys.
Age
The association between child age and the identification of primary SEN (SEN Support and with statement/EHC plan) associated with learning disabilities is presented in Figures 4 to 6 among children aged 5 to 15 at the start of the academic year in 2018. Identification rates for SEN associated with learning disabilities are likely to be unreliable outside these age bands.
Identification rates of MLD and SLD based on a child having a statement/EHC plan both show a gradual increase across the ages 5-15 years. For children with PMLD, however, rates decline over this period. The difference in these trends is probably related to the ease of identification of PMLD in young children and higher mortality rates among children with PMLD across childhood.
At all ages, the majority of children identified with SLD or PMLD have a statement/EHC plan. In contrast, the majority of children identified with MLD are identified at SEN support, which increases up to the transition point from primary to secondary school age then decreases to the age of 15 years.
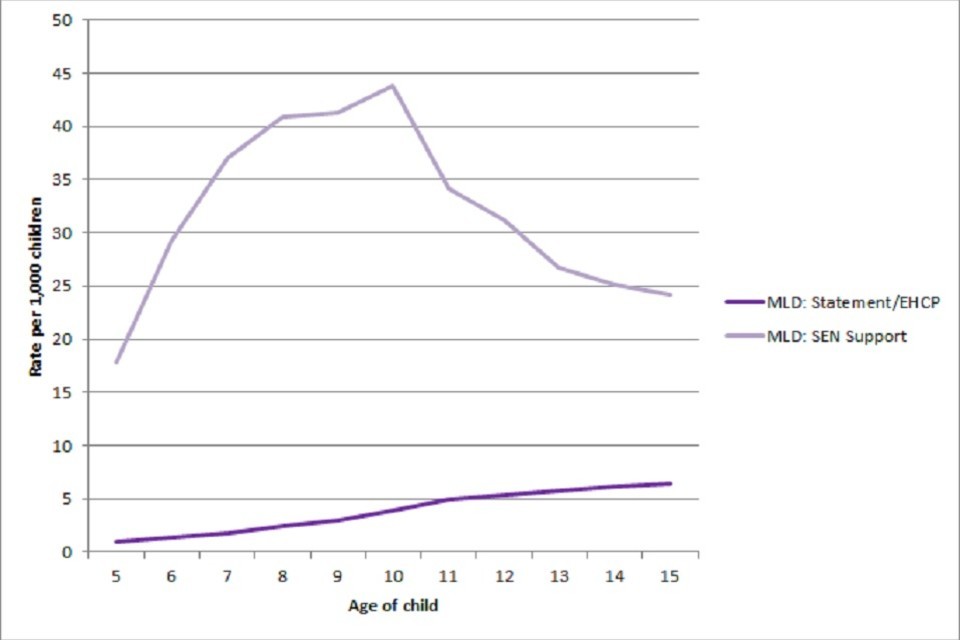
Figure 4: Age-specific identification rate per 1,000 of children with a primary SEN of MLD at SEN support and with statement/EHC plan, 2018
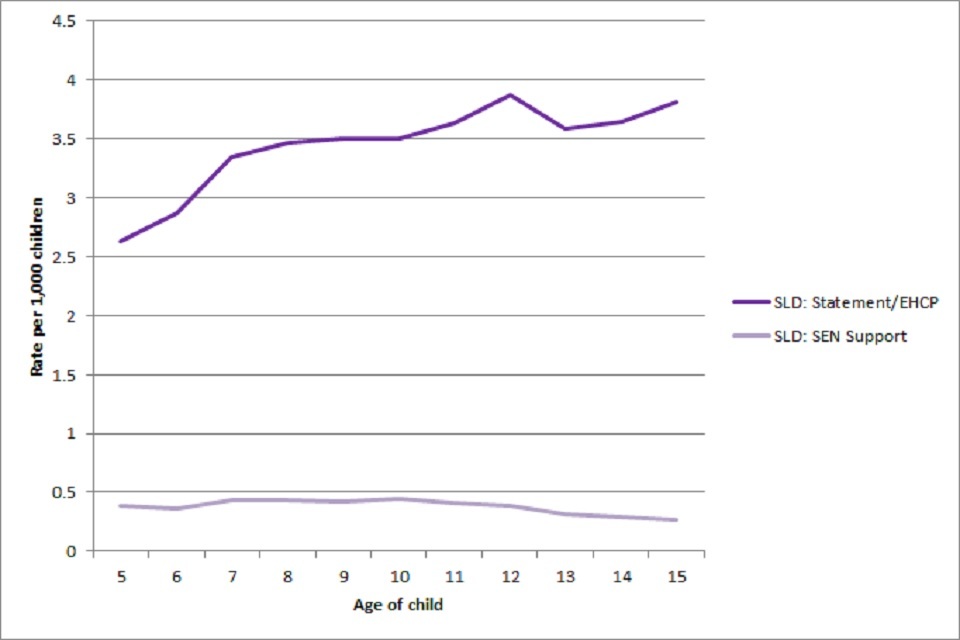
Figure 5: Age-specific identification rate per 1,000 of children with a primary SEN of SLD at SEN support and with statement/EHC plan, 2018
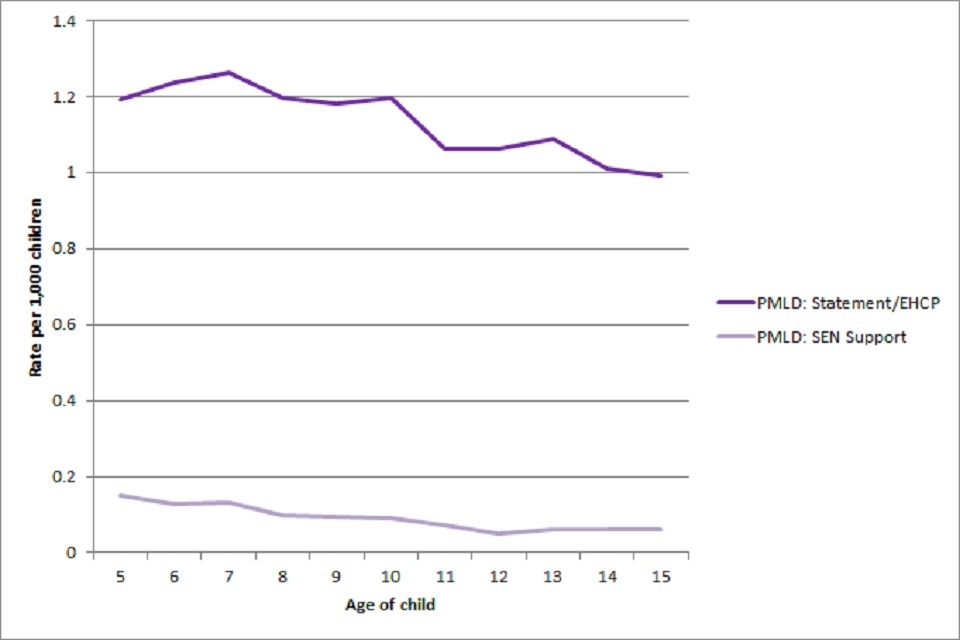
Figure 6: Age-specific identification rate per 1,000 of children with a primary SEN of PMLD at SEN support and with statement/EHC plan, 2018
Poverty
Children from poorer households or who are living in more deprived neighbourhoods are more likely to be identified as having SEN associated with learning disabilities[footnote 11]. In January 2018, 13.6% of pupils of state-funded schools were eligible for and claiming free school meals (see Figure 7). In contrast, rates were elevated among all groups of children with a primary SEN associated with learning disabilities and were highest among children with MLD (27.5% at SEN support, 36.2% with statements/EHC plans), compared to children with SLD (29.1% at SEN support, 34.1% with statements/EHC plans) and children with PMLD (22.0% at SEN support, 28.3% with statements/EHC plans).
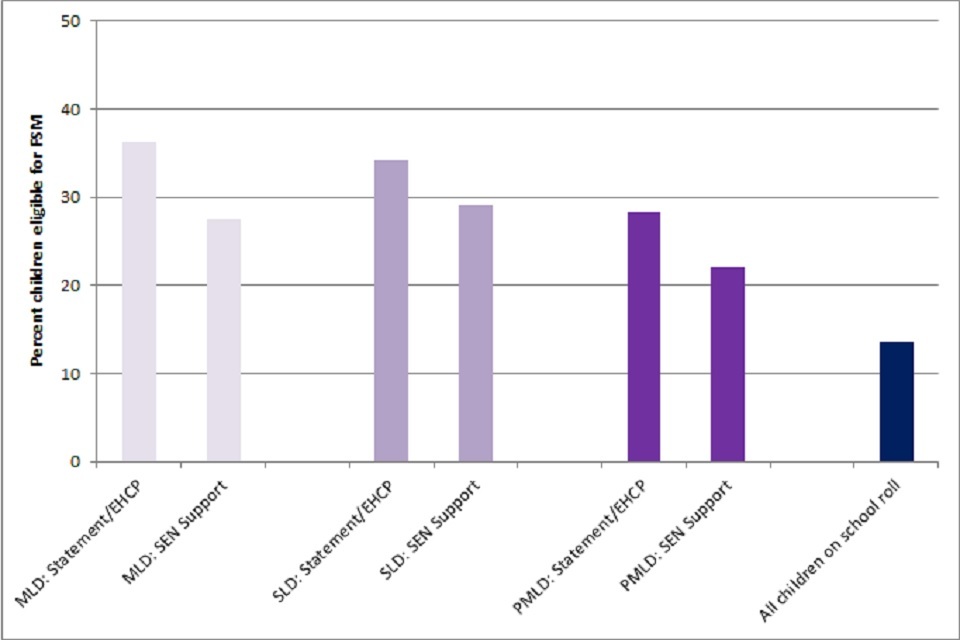
Figure 7: Percentage of children with a primary SEN of MLD, SLD, PMLD at SEN support and with statement/EHC plan eligible for Free School Meals, 2018
Ethnicity
The identification of SEN associated with learning disabilities differs considerably between ethnic groups[footnote 11]. Table 5 in the accompanying PDF document presents detailed information on the prevalence of primary SEN associated with learning disabilities among children in England at SEN support or with a statement/EHC plan in 2018 by ethnicity.
Identification rates of learning disabilities for specific ethnic groups reported to be 25% or more above the national average were recorded among:
- traveller children of Irish heritage (for MLD, SLD and PMLD)
- children of Romany gypsy heritage (for MLD and SLD)
- children of Pakistani heritage (for MLD, SLD and PMLD)
- children of Bangladeshi heritage (for PMLD)
- children of ‘other’ Asian heritage (for PMLD)
- children of black Caribbean heritage (for MLD)
- children of black African heritage (for SLD)
- children of ‘other’ black heritage (for SLD and PMLD)
- children of ‘any other’ ethnic group (for PMLD)
Education in mainstream schools
The ‘Special educational needs in England’ series contains information on the number of children with primary SEN associated with learning disabilities who are educated in mainstream and special schools (see Table 6 in the accompanying PDF file for details)[footnote 12].
In January 2018, 26% of children with a statement or EHC plan and with a primary SEN associated with learning disabilities were being educated in mainstream schools. For those children with a statement or EHC plan, 44% of children with a primary SEN of MLD were being educated in mainstream schools, compared to 12% of children with a primary SEN of SLD and 15% of children with a primary SEN of PMLD.
Figure 8 below (see also Table 6) shows the number of children with a statement/EHC plan and a primary SEN of MLD, SLD or PMLD being educated in mainstream and special schools from 2010 to 2018. For children with a statement/EHC plan and a primary SEN of MLD, the number of children in mainstream schools fell at a faster rate than the number of children in special schools. For children with a statement/EHC plan and a primary SEN of SLD, the number of children in mainstream schools gradually fell while the number of children in special schools increased. For children with a statement/EHC plan and a primary SEN of PMLD, the number of children in both mainstream and special schools increased slightly.
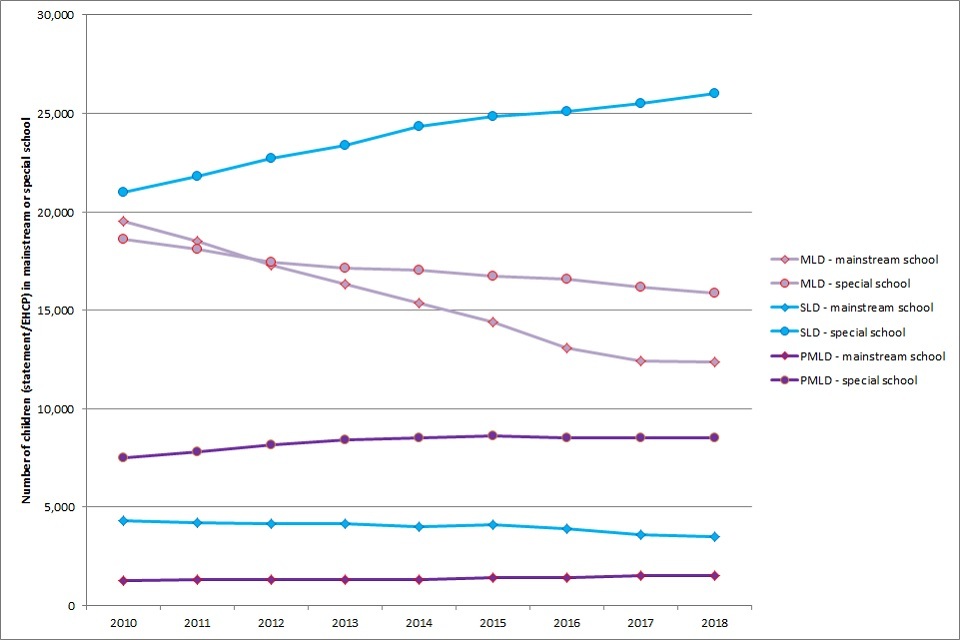
Figure 8: Number of children with a statement/EHC plan and primary SEN associated with learning disabilities being educated in mainstream and special schools, England 2010-2018
Overall, between 2010 and 2018, the percentage of children with a statement/EHC plan and a primary SEN associated with learning disabilities being educated in mainstream schools reduced from 36% to 26% (Figure 9, Table 7). This was primarily accounted for by a reduction in the proportion of children with a primary SEN of MLD and SLD being educated in mainstream schools.
In January 2018, 99.7% of children with a primary SEN associated with learning disabilities at the level of SEN Support only were being educated in mainstream schools; 99.95% of children with a primary SEN of MLD, 86% of children with a primary Sen of SLD and 76% of children with a primary SEN of PMLD.
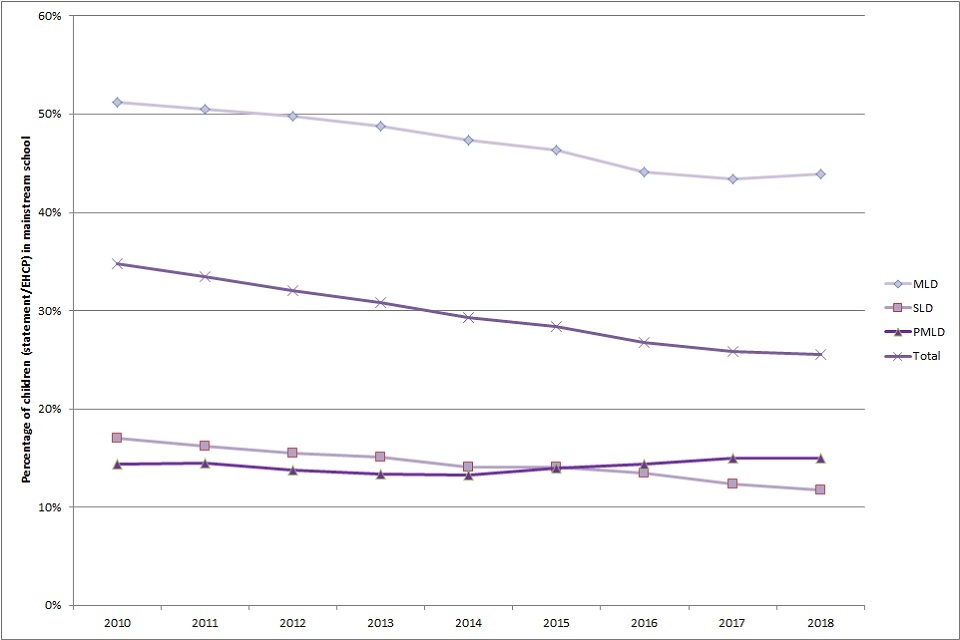
Figure 9: Percentage of children with a statement/EHC plan and primary SEN associated with learning disabilities being educated in a mainstream school, England 2010-2018
National statistics concerning the education of important groups of children with learning disabilities are not currently collected. The number of children with learning disabilities being educated at home or outside any formal education setting is not known. The number of children with learning disabilities in residential educational settings is also not reported within DfE national statistics – recent estimates suggest that the total number of children in residential special schools (including children with other needs than learning disabilities) is 4,878, with a further 1,268 young people in post-16 residential colleges[footnote 13].
There was substantial variation across local authorities and regions in the percentage of children with a primary SEN associated with learning disabilities (SEN support or statement) who were being educated in mainstream schools.
For children with a primary SEN of MLD (see Figure 10), the 10% of councils making most use of mainstream schools placed 99% or more of children with MLD in mainstream schools; the 10% of councils making least use of mainstream schools placed less than 85% of children with MLD in mainstream schools.
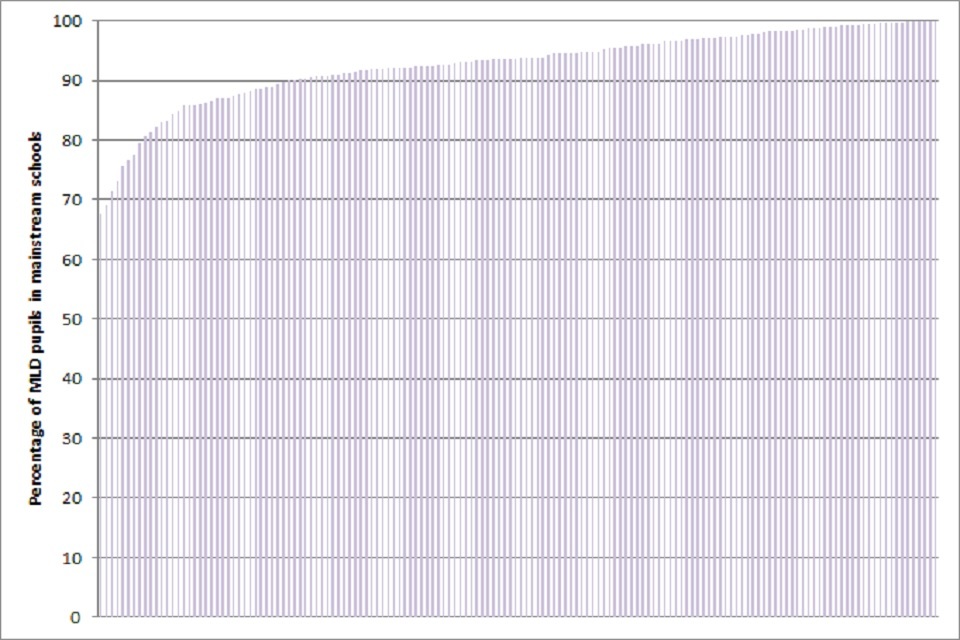
Figure 10: Percentage of children with a primary SEN of MLD (statement/EHC plan and SEN Support combined) in mainstream schools by local authority
For children with a primary SEN of SLD (see Figure 11), the 10% of councils making most use of mainstream schools placed 36% or more of children with SLD in mainstream schools; the 10% of councils making least use of mainstream schools placed less than 7% of children with SLD in mainstream schools.
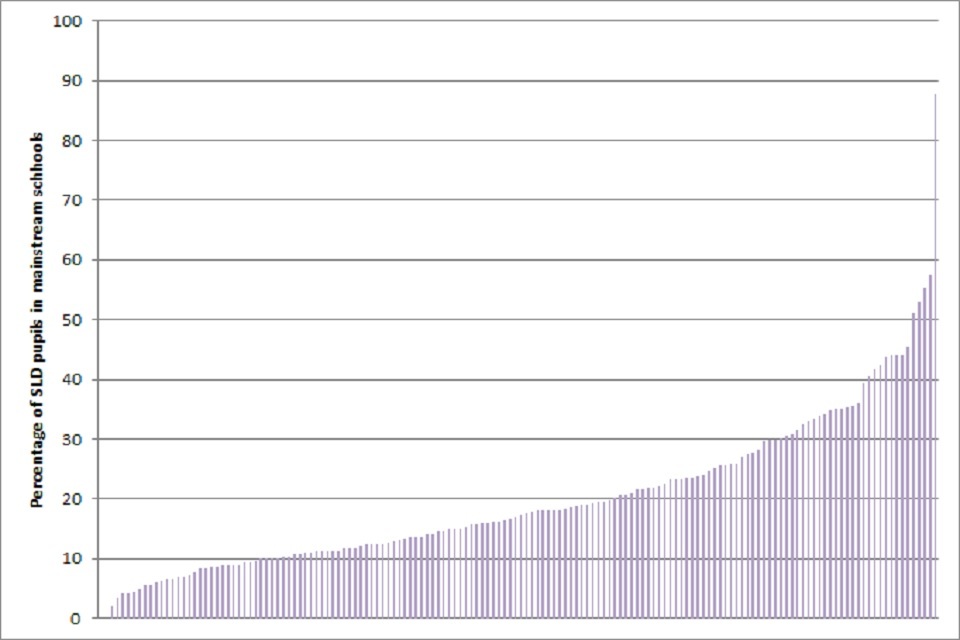
Figure 11: Percentage of children with a primary SEN of SLD (statement/EHC plan and SEN Support combined) in mainstream schools by local authority
For children with a primary SEN of PMLD (see Figure 12), the 10% of councils making most use of mainstream schools placed 37% or more of children with PMLD in mainstream schools; the 10% of councils making least use of mainstream schools placed less than 6% of children with PMLD in mainstream schools.
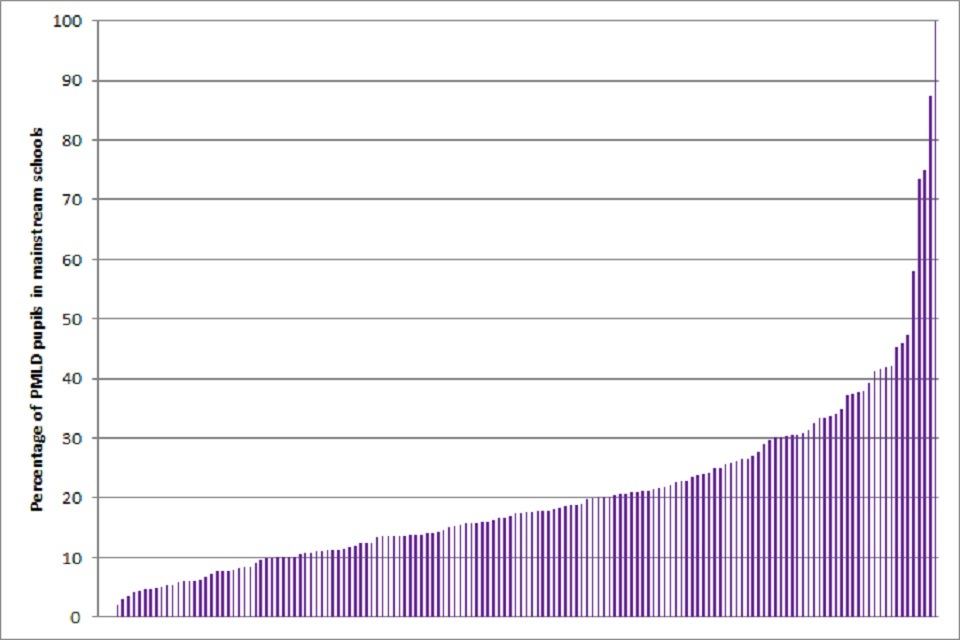
Figure 12: Percentage of children with a primary SEN of PMLD (statement/EHC plan and SEN Support combined) in mainstream schools by local authority
Absence and exclusion
The series ‘Children with special educational needs’ contained detailed information on the school attendance and exclusion of children with and without SEN nationally and, for some indicators, by local authority. For 2013/14, equivalent data is provided by ‘Special educational needs: an analysis and summary of data sources’[footnote 8] and ‘Absence and exclusions additional analysis for pupils with special educational needs (SEN)’[footnote 14]. Less detailed data on absences for 2015/16 and 2016/17 is available in ‘Pupil absence in schools in England: 2015 to 2016; 2016 to 2017’[footnote 15] [footnote 16]. Data on exclusions for 2014/15 and 2015/16 is available in ‘Permanent and fixed-period exclusions in England: 2014 to 2015; 2015 to 2016; 2016 to 2017’[footnote 17] [footnote 18] [footnote 19].
Absence
Absence from school is measured as the average percentage of half-day sessions throughout the year for which the child was absent. Absences are recorded as:
- authorised absence which involves permission from a teacher or other authorised representative of the school for absences for which a satisfactory explanation has been provided
- unauthorised absence which includes all unexplained or unjustified absences; arriving late for school, after the register has closed, is recorded as unauthorised absence
Rates of overall, authorised and unauthorised absence for children with a primary SEN associated with learning disabilities are presented in Figure 13 and Table 8. In terms of authorised absences, in 2016/17 children with a primary SEN associated with learning disabilities were more likely than other children to be absent from school, with children with PMLD on average missing almost one-in-7 half-day sessions due to authorised absences. Levels of unauthorised absences were low for all groups of children, with unauthorised absences slightly more likely for children with a primary SEN of MLD.
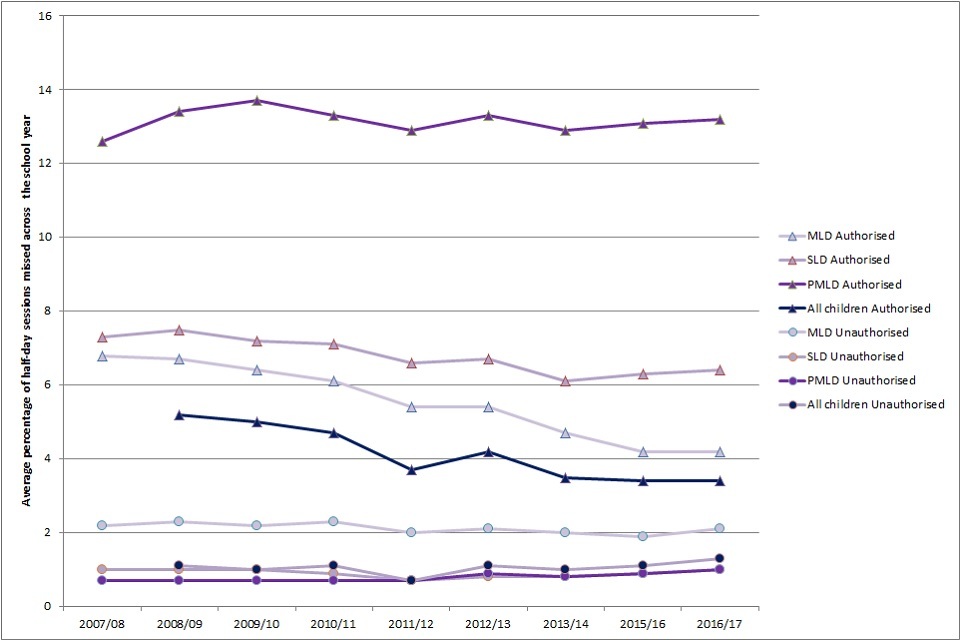
Figure 13: Average percentage of half-day sessions missed due to authorised and unauthorised absences, 2007/8 to 2016/17 (statement/EHCP and School Action Plus to 2014; statement/EHCP and SEN Support minus School Action in 2015/16 and 2016/17)
Reasons recorded for absences for children with a statement of SEN are presented in Table 9 for 2013/14 (the latest year for which data disaggregated by type of SEN is available). Illness and medical or dental appointments accounted for 57% of absences of children with MLD, 72% of absences of children with SLD and 78% of absences of children with PMLD.
Exclusion
Information is available on fixed period and permanent exclusions. A ‘fixed period exclusion’ is recorded when a child is excluded from a school but remains on the register (as they are expected to return once the exclusion period is over). A ‘permanent exclusion’ is recorded when a child is excluded from a school and their name removed from the register.
In 2016/17, children with a primary SEN of MLD were the subject of 465 permanent exclusions and 27,210 fixed-period exclusions (experienced by 11,695 pupils with MLD). Children with a primary SEN of MLD were the subject of 6.0% of all permanent exclusions and 7.1% of all fixed-period exclusions in 2016/17.
Children with a primary SEN of SLD were the subject of 15 permanent exclusions and 825 fixed-period exclusions (experienced by 375 pupils with SLD). For children with a primary SEN of PMLD, there were 5 permanent exclusions and 105 fixed-period exclusions (experienced by 50 pupils with PMLD).
The percentages of children with primary SEN associated with learning disabilities who received one or more fixed-period exclusions and who were permanently excluded within each year are presented in Table 14 from 2006/07 to 2016/17. Children with a primary SEN of MLD were markedly more likely to be excluded (fixed-period exclusion 4.4%; permanent exclusion 0.2%) than children with no SEN (fixed-period exclusion 1.5%; permanent exclusion 0.06%). Children with a primary SEN of PMLD were less likely to be excluded (fixed-term exclusion 0.5%; permanent exclusions 0.04%) than children with no SEN.
The reasons for fixed-period and permanent exclusion in 2013/14 (the most recent published analysis of this data) of pupils with a primary SEN associated with learning disabilities are given in Table 11.
For children without SEN, the most common reasons for fixed-period exclusions were:
- persistent disruptive behaviour (26.9% of exclusions for this group)
- ‘other’ (21.2%)
- physical assault against a pupil (18.8%)
- verbal abuse or threatening behaviour against an adult (16.2%)
For children with MLD, the most common reasons were similar:
- persistent disruptive behaviour (31.2%)
- ‘other’ (19.5%)
- verbal abuse/threatening behaviour against an adult (16.8%)
- physical assault against a pupil (15.9%)
For children with SLD, the most common reasons for fixed-period exclusions were:
- physical assault against an adult (28.2%)
- persistent disruptive behaviour (19.0%)
- physical assault against a pupil (17.8%)
- verbal abuse or threatening behaviour against an adult (14.4%)
The pattern for children with PMLD was similar:
- physical assault against an adult (38.9%)
- physical assault against a pupil (22.2%)
- persistent disruptive behaviour (16.7%)
- verbal abuse/threatening behaviour against an adult (11.1%)
For children without SEN, the most common reasons for permanent exclusions were:
- persistent disruptive behaviour (31.9% of exclusions)
- ‘other’ (18.5%)
- physical assault against a pupil (13.4%)
- drug- and alcohol-related reasons (11.7%)
For children with MLD the most common reasons were broadly similar:
- persistent disruptive behaviour (36.7%)
- ‘other’ (14.4%)
- physical assault against a pupil (13.3%)
- physical assault against an adult (11.1%)
- verbal abuse/threatening behaviour against an adult (10.0%)
The number of exclusions involving children with SLD (20 exclusions (rounded figure)) and children with PMLD (no exclusions) was too small to allow for meaningful analysis of the reasons for permanent exclusions.
Children’s social care
The DfE reports information on 2 aspects of social care relevant to children with learning disabilities: children in need and looked-after children. The previous edition of this digest, People with Learning Disabilities in England 2015[footnote 1], reported that the ‘learning disability’ category used in the ‘Children in need’ statistics reported a much lower prevalence of learning disabilities than any other administrative database, including relevant Special Educational Needs categories in the National Pupil Database.
The DfE has reported an additional analysis of statistics for 2015/16, cross-referencing information on children in need and looked after children by the categories of SEN used in the National Pupil Database[footnote 20].
Under section 17 (10) of the Children Act 1989, a child is a child in need if:
- they are unlikely to achieve or maintain or have the opportunity of achieving or maintaining, a reasonable standard of health or development without the provision for him/her of services by a local authority
- their health or development is likely to be significantly impaired or further impaired, without the provision for him/her of such services
- they are a disabled child
Children may be ‘looked after’ by a local authority for a number of reasons. These include:
- all children who are subject to a care order, interim care order or emergency protection order under the Children Act, 1989, where the local authority has parental responsibility for that child
- children under a criminal law supervision order with a residence need to live in local authority accommodation
- children who have appeared in court and have been bailed to reside where the local authority directs - and are being provided with a local-authority-funded placement
- children who are remanded to the local authority where release on bail has not been granted
- children under a court-ordered secure remand and held in council accommodation
- children who are subject to a secure accommodation order where the local authority is funding the cost of the secure placement
- children accommodated under the Children Act 1989
- children in a placement that is either directly provided by the local authority or by an approved agency on behalf of the local authority
- unaccompanied asylum-seeking children
- children accommodated in health-authority, NHS-trust or education placements that are designed to meet the child’s social as well as their educational or health needs (for example there are child-protection concerns or parenting issues)
The additional analysis from the DfE reports children in need in one of 3 hierarchical, mutually exclusive categories which are:
- Looked After Children (LAC)
- Children on a Child Protection Plan (CPP) – children on a CPP who are also in the LAC category are counted there rather than in this category
- Children on a Children in Need Plan (CINP) which includes Children in Need (CIN), including those referred to child social care and being assessed – children in the CPP and LAC categories are counted there rather than in this category
All these CIN categories are also collated into an ‘All CIN pupils’ category (see Table 12).
Information on children’s learning disabilities are derived from matching with the National Pupil Database, combining children at statement/EHC plan and SEN Support levels in the SEN categories of MLD, SLD and PMLD.
Figure 14 below shows the number of pupils with a primary SEN of MLD, SLD or PMLD (at statement/EHC plan and SEN Support levels combined) who, in 2015/16, were on a CINP, on a CPP or who were in the LAC category.
In total, 18,030 children with a primary SEN need of MLD were children in need or looked after children, compared to 9,650 children with a primary SEN need of SLD and 4,860 children with a primary need of PMLD. Children with a primary need of MLD, SLD or PMLD represented 9.2% of all LAC, 5.6% of all children with a CPP and 8.5% of all children with a CINP.
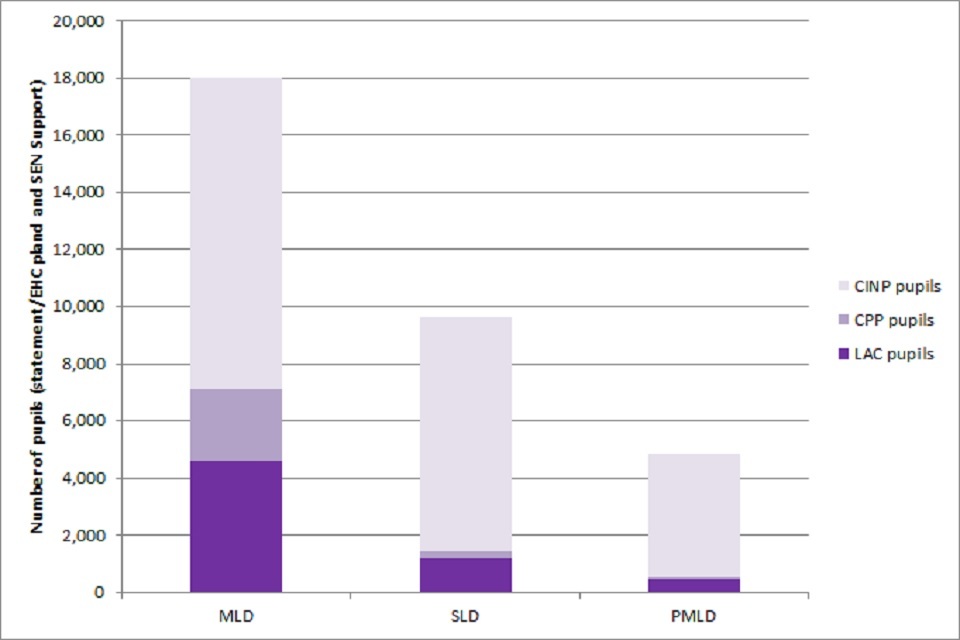
Figure 14: Number of MLD, SLD and PMLD pupils (statement/EHC plan and SEN Support) in Children in Need and Looked After Children categories, 2015/16
Figure 15, below, shows the percentage of children in each SEN category associated with learning disabilities (MLD, SLD, PMLD) who are CIN or LAC, compared to the percentage of all children in these circumstances.
The percentage of all children on the school rolls in 2015/16 who were LAC was 0.8%; these percentages rose across MLD (1.7% of MLD children), SLD (3.7% of SLD children) and PMLD (4.3% of PMLD children). The percentage of children with a CPP was similar for all children (0.6%) and children with primary SEN needs of MLD (0.9%), SLD (0.7%) and PMLD (0.5%). The percentage of children with a CINP was lowest for all children (3.2% of all children) and children with a primary SEN need of MLD (4.0% of all MLD children) but was much higher for children with a primary SEN need of SLD (25.3% of SLD children) and PMLD (39.2% of PMLD children).
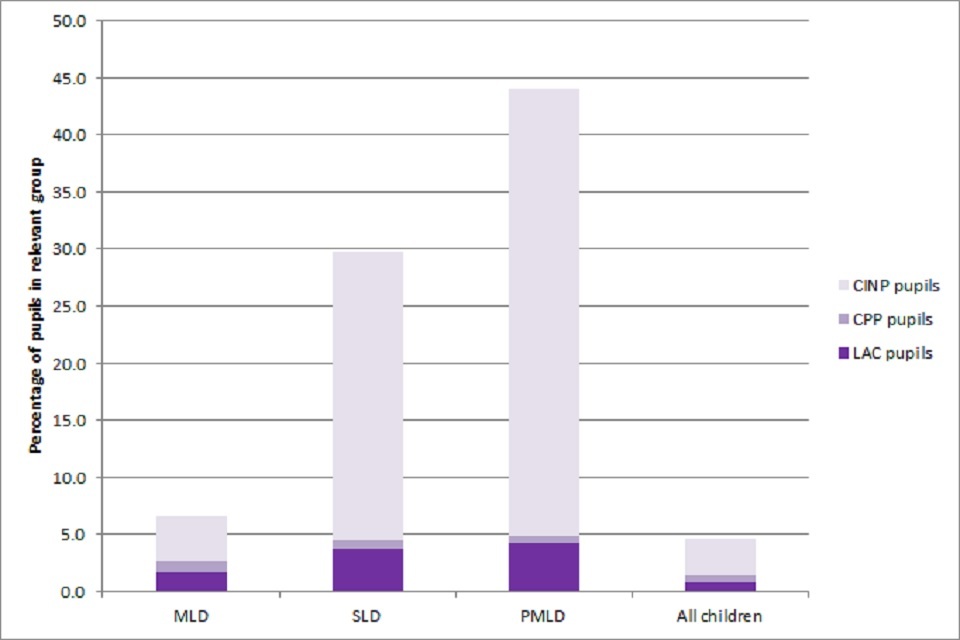
Figure 15: Percentage of MLD, SLD, PMLD pupils (statement/EHC plan and SEN Support) and all children in Children in Need and Looked After Children categories, 2015/16
References
-
Hatton C, Glover G, Emerson E, Brown I. People with Learning Disabilities in England 2015 London: Public Health England; 2016. ↩ ↩2
-
Department for Children Schools and Families. Children with special educational needs 2009: an analysis. London: Department for Children Schools and Families 2009. ↩
-
Department for Education. Children with special educational needs 2010: an analysis. London: Department for Education 2010. ↩
-
Department for Education. Special Educational Needs Information Act: an analysis. London: Department for Education 2011. ↩
-
Department for Education. Children with special educational needs 2012: an analysis. London: Department for Education 2012. ↩
-
Department for Education. Children with special educational needs 2013: an analysis (SFR 42/2013). London: Department for Education 2013. ↩
-
Department for Education. Children with special educational needs 2014: an analysis (SFR 21/2014). London: Department for Education 2014. ↩
-
Department for Education. Special educational needs: an analysis and summary of data sources. London: Department for Education 2015. ↩ ↩2
-
Department for Education. Special educational needs: an analysis and summary of data sources London: Department for Education 2017. ↩
-
Department for Education. Special educational needs: an analysis and summary of data sources London: Department for Education 2018. ↩ ↩2
-
Emerson E. Household deprivation, neighbourhood deprivation, ethnicity and the prevalence of intellectual and developmental disabilities Journal of Epidemiology and Community Health 2012; 66:218 to 224. ↩ ↩2 ↩3
-
Department for Education. Special educational needs in England: January 2018 London: Department for Education 2018. ↩ ↩2
-
Lenehan C, Gergahty M. Good intentions, good enough? A review of the experiences and outcomes of children and young people in residential special schools and colleges. London: Department for Education 2017. ↩
-
Department for Education. Absence and exclusions additional analysis for pupils with special educational needs (SEN). London: Department for Education 2016. ↩
-
Department for Education. Pupil absence in schools in England: 2015 to 2016. London: Department for Education 2017. ↩
-
Department for Education. Pupil absence in schools in England: 2016 to 2017. London: Department for Education 2018. ↩
-
Department for Education. Permanent and fixed-period exclusions in England: 2014 to 2015. London: Department for Education 2016. ↩
-
Department for Education. Permanent and fixed-period exclusions in England: 2015 to 2016. London: Department for Education 2017. ↩
-
Department for Education. Permanent and fixed-period exclusions in England: 2016 to 2017. London: Department for Education 2018. ↩
-
Department for Education. Children in need of help and protection: data and analysis. London: Department for Education 2018. ↩