Annex B: Child poverty contextual indicators
Updated 5 August 2026

© Crown copyright 2026
This publication is licensed under the terms of the Open Government Licence v3.0 except where otherwise stated. To view this licence, visit nationalarchives.gov.uk/doc/open-government-licence/version/3 or write to the Information Policy Team, The National Archives, Kew, London TW9 4DU, or email: psi@nationalarchives.gov.uk.
Where we have identified any third party copyright information you will need to obtain permission from the copyright holders concerned.
This publication is available at https://www.gov.uk/government/publications/our-children-our-future-tackling-child-poverty-monitoring-and-evaluation-baseline-report/annex-b-child-poverty-contextual-indicators
Overview
This annex gives additional detail on the indicators we are using to provide contextual understanding of the drivers of child poverty. The indicators sit underneath the headline metrics, relative low income after housing costs (AHC) and deep material poverty and contribute to our wider driver-level evaluation questions.
These indicators are not intended as measures of success or progress, which will be tracked using our two headline child poverty metrics, and are not designed to monitor policy implementation or the impact of specific policy actions. They instead aim to help explain developments in the headline metrics and reflect the range of policy levers available. We will take a cross-cutting view of progress, recognising that progress does not need to occur evenly across all areas to deliver meaningful change. The goal is to build a deeper understanding of what is driving outcomes to build evidence that helps the Strategy to tackle the structural drivers of child poverty over its 10-year lifespan.
These indicators are focused on the boosting family incomes and driving down the costs of essentials pillars shown in the logic model in the main baseline report as these link most directly to the two headline metrics. The third pillar focuses on the strong immediate support needed for children and families in the prevention and alleviation space and will be picked up through the other evaluation strands on place-based activity and cross-government policy evaluations.
Most of the indicators presented in this section are based on data collected through household surveys, including the DWP Family Resources Survey (FRS)/Households Below Average Income (HBAI) and the ONS Living Costs and Food Survey (LCFS) and are therefore subject to limitations – in particular that estimates are uncertain as they are based on samples. This means that year-on-year changes should be interpreted with caution and considered alongside longer-term trends.
Five of the selected indicators (Indicators 1, 2, 3, 5 and 6) focus on children in the bottom two quintiles of the UK income distribution. Children in the first (bottom) income quintile are those with a net equivalised household income after housing costs (AHC) in the poorest 20% of the population, and those in the second income quintile are those with incomes in the next 20% of the population. With some variation from year to year, most children in relative low income (AHC) are in the first (bottom) income quintile, as are approximately half of children in deep material poverty. Children in the second income quintile are those with incomes around or slightly above the relative low income (AHC) threshold. A further third of children in deep material poverty are also in households in the second income quintile. It should be noted that changes in outcomes for each quintile can reflect composition effects and population churn between quintiles as well as underlying change for quintile members.
The most recent HBAI release featured an improved approach to using administrative data in place of survey responses for information on major state benefits and tax credits. With the most recent release data, from 2021/22 through to 2024/25 has been updated to reflect this approach. This means that data before and after 2021/22 are not directly comparable. This break in the time series is indicated in each chart where relevant. To illustrate the impact, in relevant charts, we are showing results for 2021/22 both with and without the linked administrative data, with the result for the non-linked data represented by a dot. HBAI data for 2020/21 are not shown on the charts as the impact of the coronavirus pandemic on data collection for that year means only headline HBAI measures are typically presented, rather than more detailed breakdowns as used for these indicators.
One other indicator (Indicator 7) focuses on “low-income” households with children in the bottom three deciles of the UK income distribution. This indicator is based on the LCFS which has a smaller sample size than HBAI, which means quintile analysis is not robust. Instead households in the bottom three deciles, (people who have a net equivalised household income in the poorest 30% of the population) are used to provide sufficiently robust estimates from this survey.
Boosting family incomes
Increasing family income is central to tackling child poverty. Low household income can contribute to poorer outcomes for children, including school readiness, health and economic outcomes, as well as directly impacting upon the headline metrics relative low income (AHC) and deep material poverty for children.
Indicator 1: Net income before housing costs for children in the bottom two income quintiles
The indicator uses net weekly household income, after adjusting for household size and composition (equivalisation), to assess children’s material living standards - the level of consumption of goods and services that they could attain given the income of the household in which they live. It uses total household income net of Income Tax, National Insurance contributions, Council Tax, and certain other payments such as student loan repayments. It assumes that all individuals in the household benefit equally from the combined net income of the household. Estimates are adjusted for inflation.
Net income for children in low-income families is central to the Strategy’s two headline metrics. Increases in real net income can contribute to fewer children in deep material poverty by boosting their material living standards. Increases in net income can also contribute to fewer children in relative low income (AHC) if incomes for children in lower-income families increase faster than the overall median.
This indicator uses net income before housing costs (BHC) to assess changes in family income independent of housing costs. Housing costs are covered later in the section on “Driving down the costs of essentials”.
Figure 1: Median weekly net equivalised household income before housing costs for children in the first (bottom) and second income quintiles, 2024/25 prices, United Kingdom, 2010/11 to 2024/25[footnote 1]
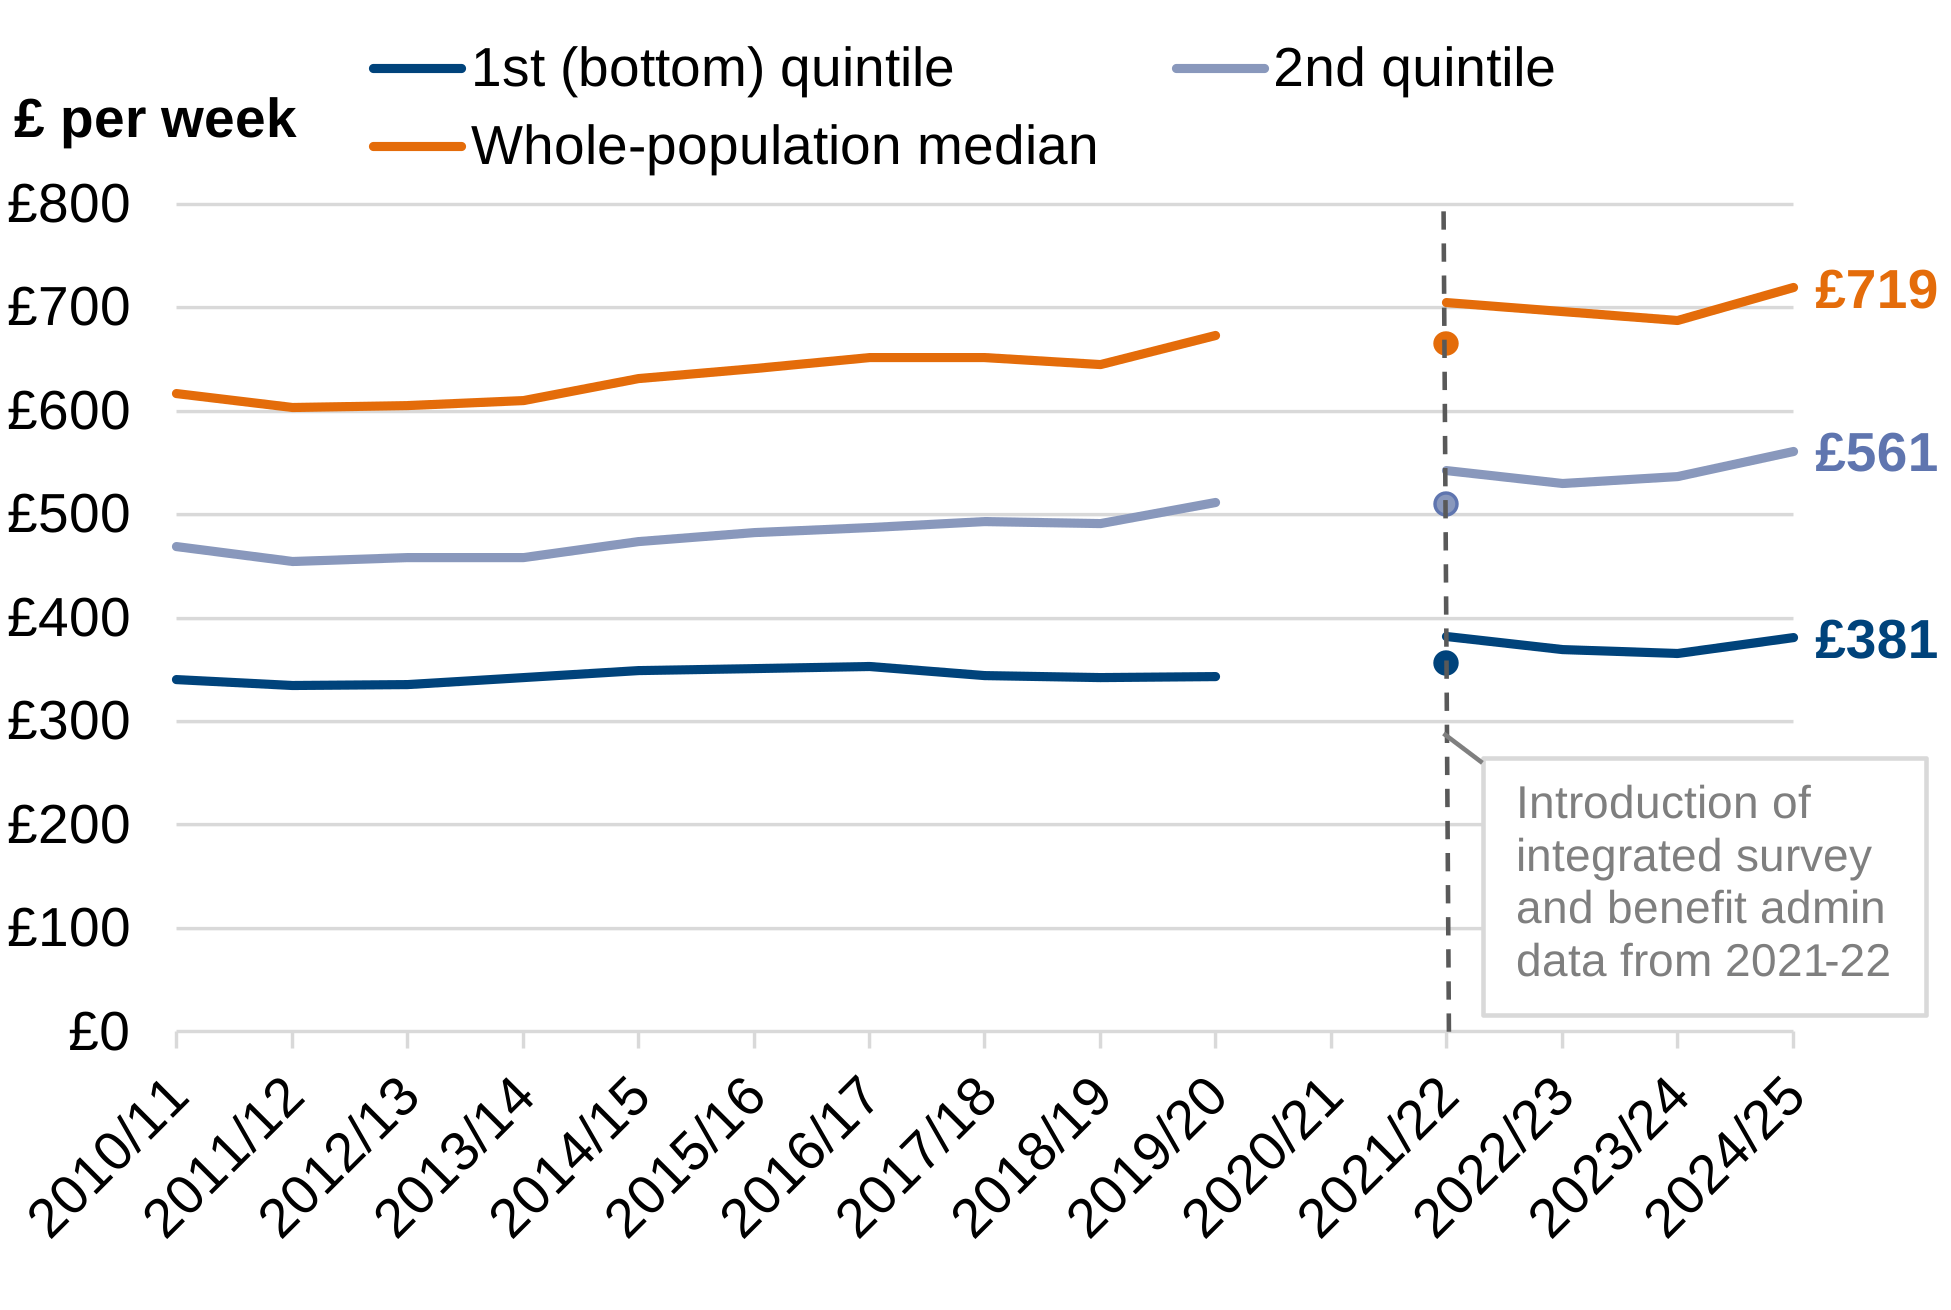
Notes: Household income includes net earnings from employment, profit or loss from self-employment, state support (all benefits and tax credits), income from occupational and private pensions, income received from dividends, investment income, child maintenance payments, income from educational grants and scholarships, and the cash value of certain forms of income in kind. Income quintiles are based on the distribution of net household income (AHC). “Whole-population median” refers to the median weekly net equivalised disposable household income (BHC) for the whole population (all ages).
Between 2010/11 and 2021/22, median real net income for children in households in the first (bottom) income quintile grew by 5%. This is a slower rate of growth than for children in the second income quintile (9% over the period) and for the average (median) individual in the population (8% over the period).
Between 2021/22 and 2024/25, children in households in the first income quintile saw no growth in median real net income. Children in the second income quintile saw median real net income grow by 3%, and the average (median) individual in the population saw median real net income grow by 2%.
Baseline position
For the 2024/25 baseline year, children in the first (bottom) income quintile had a median net income (BHC) of £381 per week. Children in the second quintile had a median net income (BHC) of £561 per week. The overall population median was £719 per week.
Parental employment
Employment is an important source of income for low-income families with children and earnings account for over half of total household income for households with children in the first (bottom) income quintile.
Earnings can be increased by starting employment and/or increasing the amount earned whilst in existing employment through increased hours or wage rates. The following two indicators assess change for these two factors.
Increases in earnings for parents in lower-income families will generally increase real net income, contributing to fewer children in deep material poverty. Increases in earnings can also contribute to fewer children in relative low income (AHC) if they help incomes for children in lower-income families increase faster than the overall median.
Indicator 2: Employment rates for parents in the bottom two income quintiles
Figure 2: Employment rates for parents in the first (bottom) and second income quintiles, United Kingdom, 2010/11 to 2024/25[footnote 2]
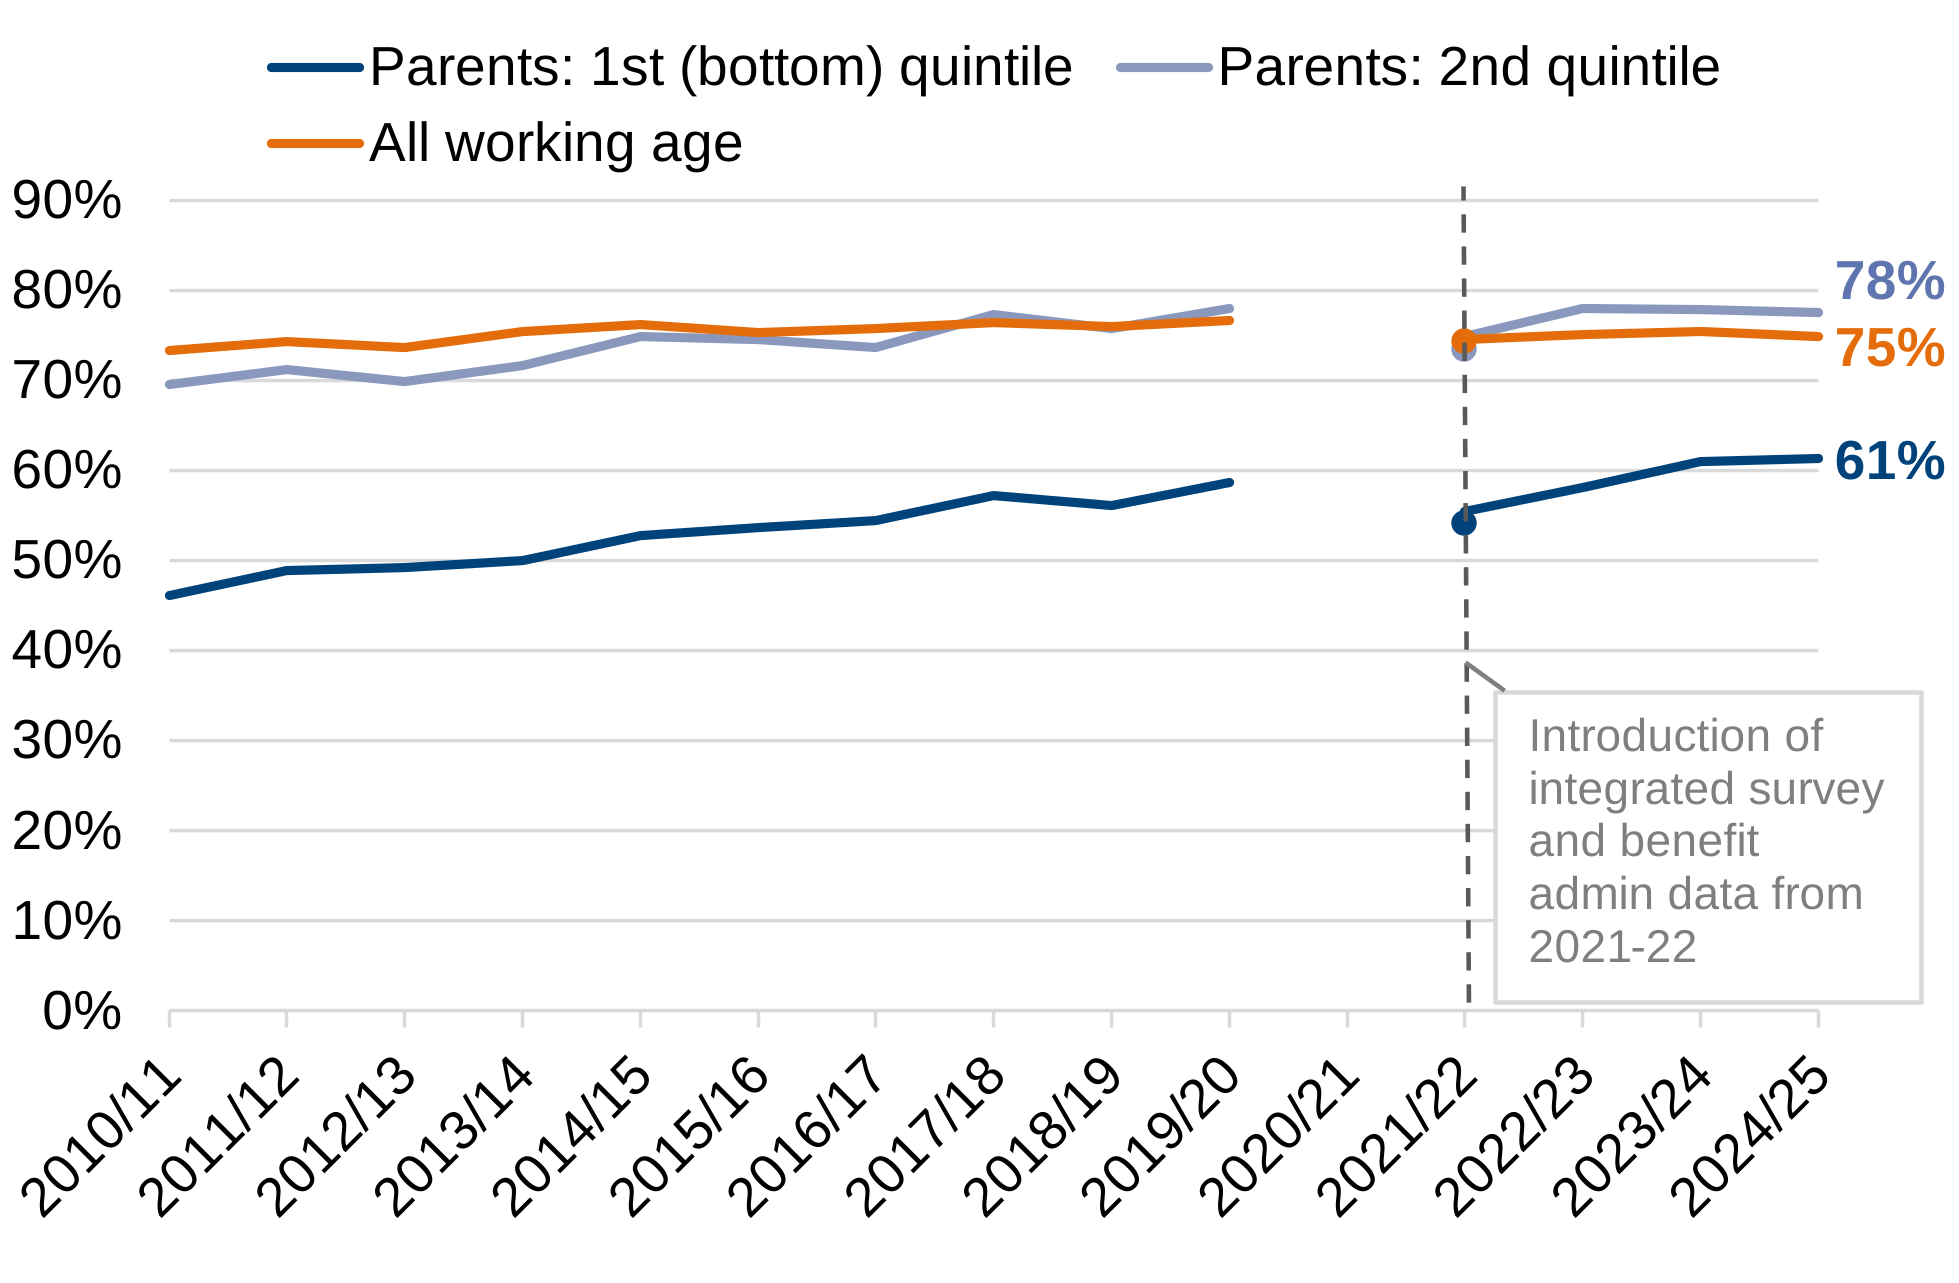
Notes: “Parents” refer to adults in a benefit unit with at least one dependent child. “Employment” refers to an economic status as an employee (full-time or part-time) or self-employed (full-time or part-time). Income quintiles are based on the distribution of net household income (AHC).
Between 2010/11 and 2021/22, the employment rate for parents in the first (bottom) income quintile increased by 8 percentage points, from 46% to 54%, while the rate for parents in the second income quintile increased by 4 percentage points, from 70% to 73% (difference does not sum due to rounding). Over the same period, the employment rate for the whole working-age population increased by 1 percentage point, from 73% to 74%.
Between 2021/22 and 2024/25, the employment rate for parents in the first (bottom) income quintile increased by 6 percentage points, from 55% to 61%, while the rate for parents in the second income quintile increased by 3 percentage points, from 75% to 78%. Over the same period, the employment rate for the whole working-age population was unchanged at 75%.
Baseline position
Despite strong growth, employment rates for parents in the first (bottom) income quintile remain lower than those for parents in the second quintile and for the working-age population in general. In 2024/25, the baseline year, the employment rate for parents in the first (bottom) income quintile was 61%, compared to 78% for parents in the second quintile, and 75% for the whole working-age population.
Indicator 3: Median weekly earnings for employed parents in the bottom two income quintiles
Figure 3: Median real gross weekly earnings for employed parents in the first (bottom) and second income quintiles, 2024-25 prices, United Kingdom, 2010/11 to 2024/25[footnote 3]
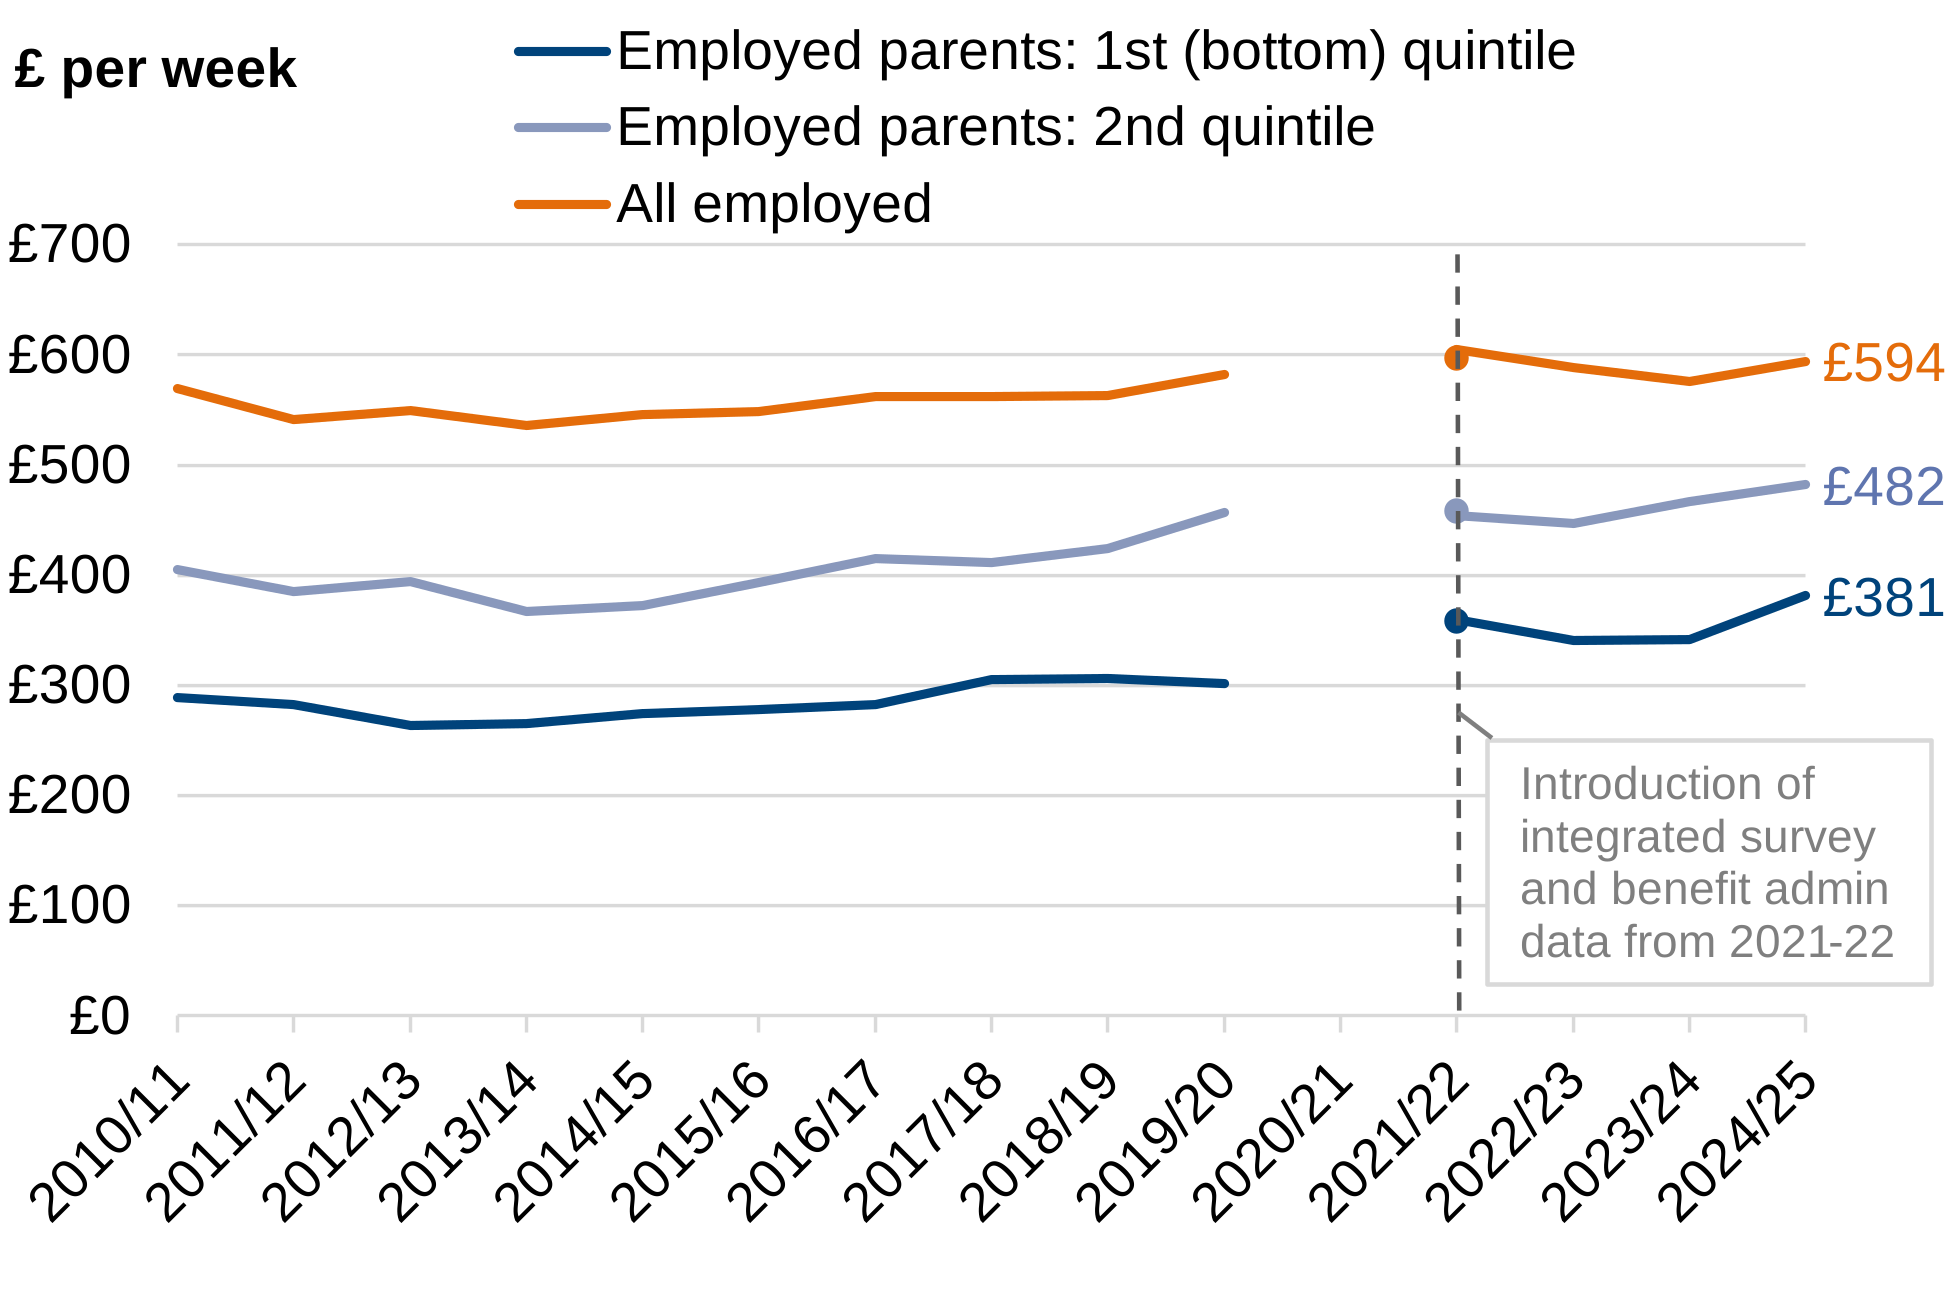
Notes: “Parents” refer to adults in a benefit unit with at least one dependent child. “Employed” refers to an economic status as an employee (full-time or part-time) or self-employed (full-time or part-time). Income quintiles are based on the distribution of net household income (AHC). Gross weekly earnings includes total income from employment (all jobs) and gross earnings from self-employment based on profit or income/drawings.
Between 2010/11 and 2021/22, median real earnings for employed parents in the first (bottom) income quintile increased by 24%, while median real earnings for parents in the second income quintile increased by 13%. Over the same period, median real earnings for all employed increased by 5%.
Between 2021/22 and 2024/25, median real earnings for employed parents in the first (bottom) and second income quintiles increased by 6%. Over the same period, median real earnings for all employed decreased by 2%.
Baseline position
Earnings for employed parents in lower-income households remain lower than for the employed population in general. In the baseline year 2024/25, median real earnings for employed parents in households in the first (bottom) income quintile were £381, compared to £482 for parents in households in the second income quintile, and £594 for all employed.
Social security
Indicator 4: Real value of the Universal Credit standard allowance
Benefits are a key source of income for low-income families and most children in poverty are in families claiming Universal Credit (UC). Increases in the real value of UC allowances can contribute to increases in real household income for children in low-income families and to reductions in child relative low income (AHC) and deep material poverty.
This indicator models the real value of the UC standard allowance – the basic foundational amount of a household UC claim. Claimants may get additional amounts on top of the standard allowance if they are entitled to elements for children, housing, or disability or health conditions. The UC standard allowance varies depending on claimant age and whether they live with a partner. Here, data refer to the standard allowance available to claimant who is single and age 25 or over.
This indicator refers to UC as it applies in Great Britain. UC policy in Northern Ireland broadly mirrors that in Great Britain with most rules applied on a parity basis.
Figure 4: Real weekly value of the UC standard allowance, 2026/27 prices, 2019/20 to 2026/27 (projected)[footnote 4]
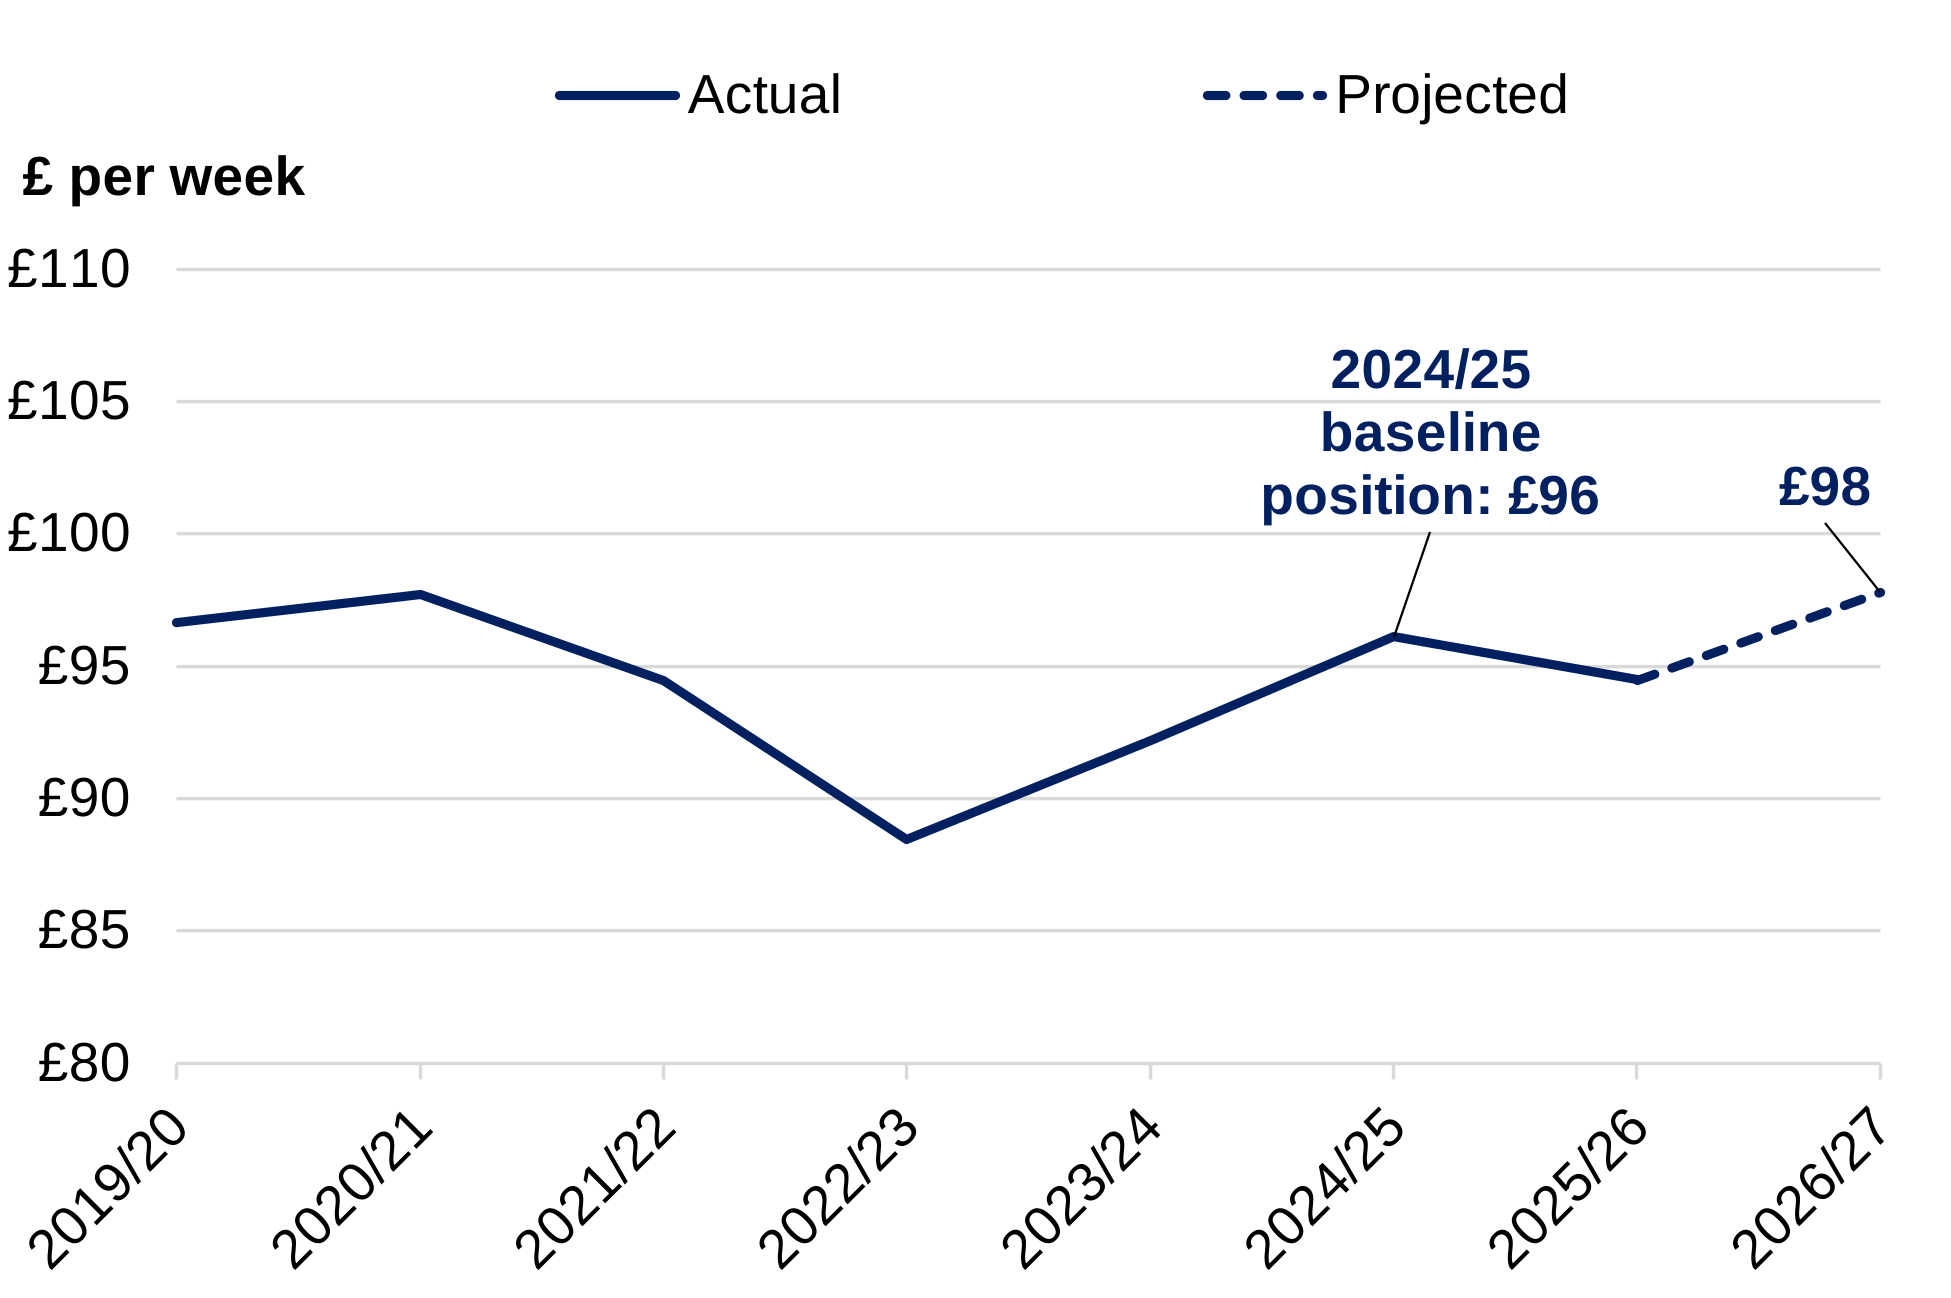
Notes: Data refer to the UC standard allowance rate for a single claimant age 25 or over. Data do not include the temporary Coronavirus (COVID-19) pandemic increase from April 2020 to October 2021 or the extra payments available to help with the cost of living (Cost of Living Payments) from July 2022 and February 2024. The amount of benefit received by claimants can be affected by how much they or their partner earn and whether they have amounts taken off due to deductions, sanctions or the benefit cap. In Northern Ireland, Welfare Supplementary Payments are provided automatically to families with children impacted by the Benefit Cap. Values are deflated using the Consumer Price Index (CPI) for the relevant financial year. Data for 2026/27 is a projection based on forecasts for CPI inflation published by the Office for Budget Responsibility (OBR) in March 2026.
Baseline position
In 2024/25, the baseline year, the inflation-adjusted value of the UC standard allowance for a single claimant age 25 or over was £96 per week. This was £1 per week less than in 2019/20 (£97 per week in 2026/27 prices).
Change since baseline
In 2026/27, the UC standard allowance for a single claimant age 25 or over is £98 per week. After adjusting for inflation, this is £2 per week higher than in the baseline year (2024/25, £96 per week).
Financial security
As set out in the Evidence Pack, families in low income tend to have lower savings and are more likely to incur problem debts. This can leave them vulnerable to financial shocks.
Indicator 5: Household savings over £850 for children in the bottom two income quintiles
The percentage of children in households with savings over £850 in the bottom two income quintiles captures the prevalence of savings for poor families and their vulnerability to shocks. Emergency savings help families weather financial shocks and avoid getting into debt. While not linked to relative low income (AHC), which is determined solely by household income and housing costs, increased savings could help reduce deep material poverty if they help families overcome financial shocks without cutting back on material essentials.
The £850 threshold has been chosen to align with an existing measure from the ONS Opinions and Lifestyle Survey and in line with that measure will remain fixed in nominal terms. However, this represents a somewhat arbitrary threshold and we will consider different thresholds and trends in relation to future reporting on this indicator. However, our initial analysis suggests relative trends between groups remain broadly similar when applying different thresholds.
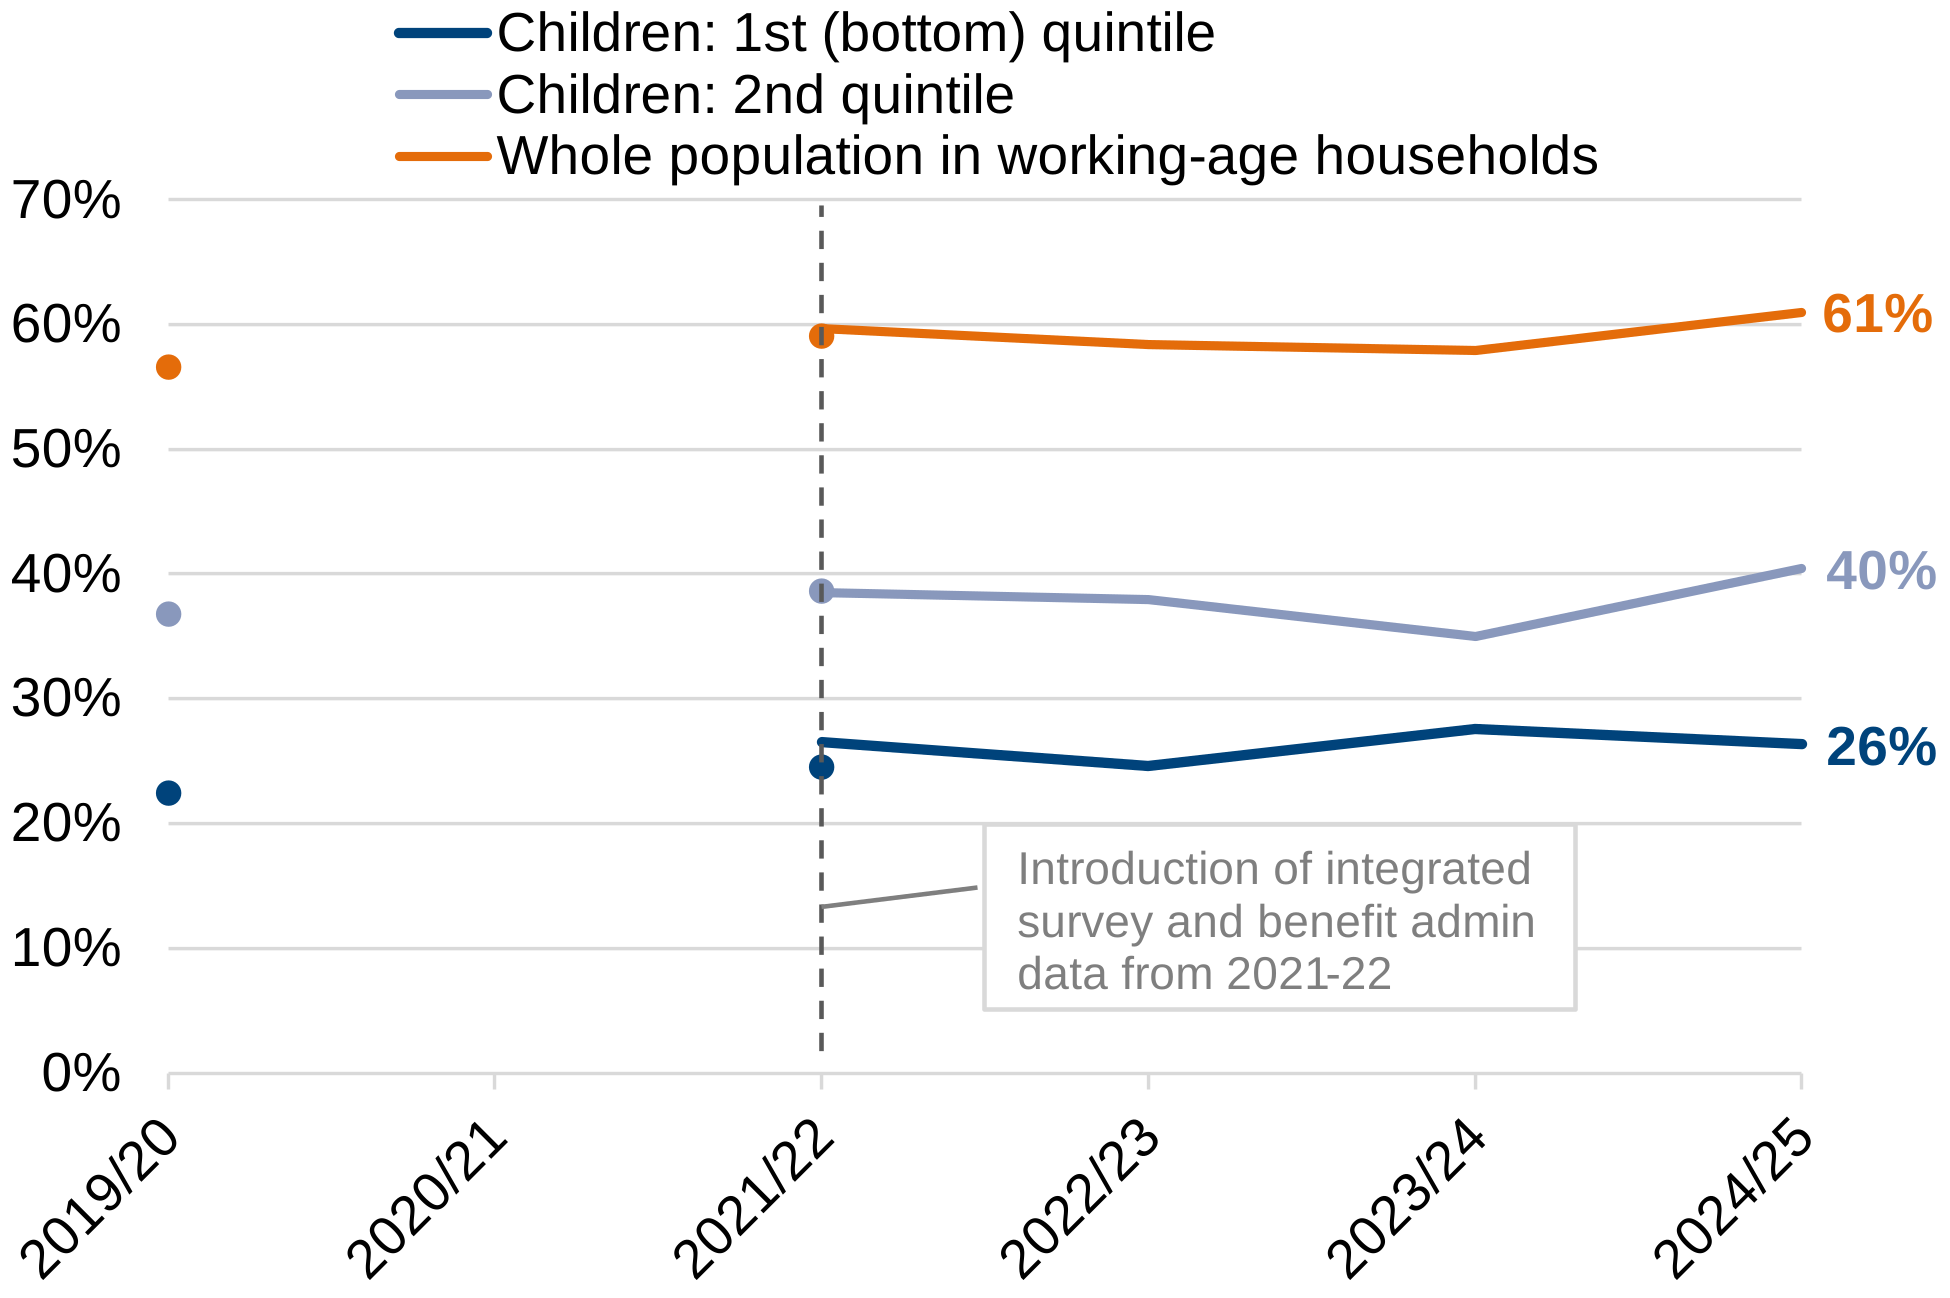
Figure 5: Percentage of children in working-age households in the first (bottom) and second income quintiles whose household has savings over £850, United Kingdom, 2019/20 to 2024/25[footnote 5]
Notes: Income quintiles are based on the distribution of net household income (AHC).
Since 2021/22, the likelihood of living in a household with savings over £850 has increased slightly for children in working-age households in the second quintile (up 2 percentage points) and for the whole population in working-age households (up 1 percentage point). It has remained flat for children in working-age households in the first (bottom) income quintile.
Baseline position
Children in lower-income working-age households remain less likely than the general working-age population to live in households with savings over £850. In the baseline year 2024/25, 26% of children in working-age households in the first (bottom) income quintile lived in households with savings over £850, compared to 40% of children in working-age households in the second income quintile, and 61% for the whole population in working-age households.
Indicator 6: Household arrears on bills for children in the bottom two income quintiles
A failure to pay bills can indicate insufficient income and debt accumulation can reduce families’ abilities to purchase material essentials. Increases in household arrears on bills can both reflect an increase in relative low income (AHC) and can increase deep material poverty if it further reduces budgets available for material essentials.
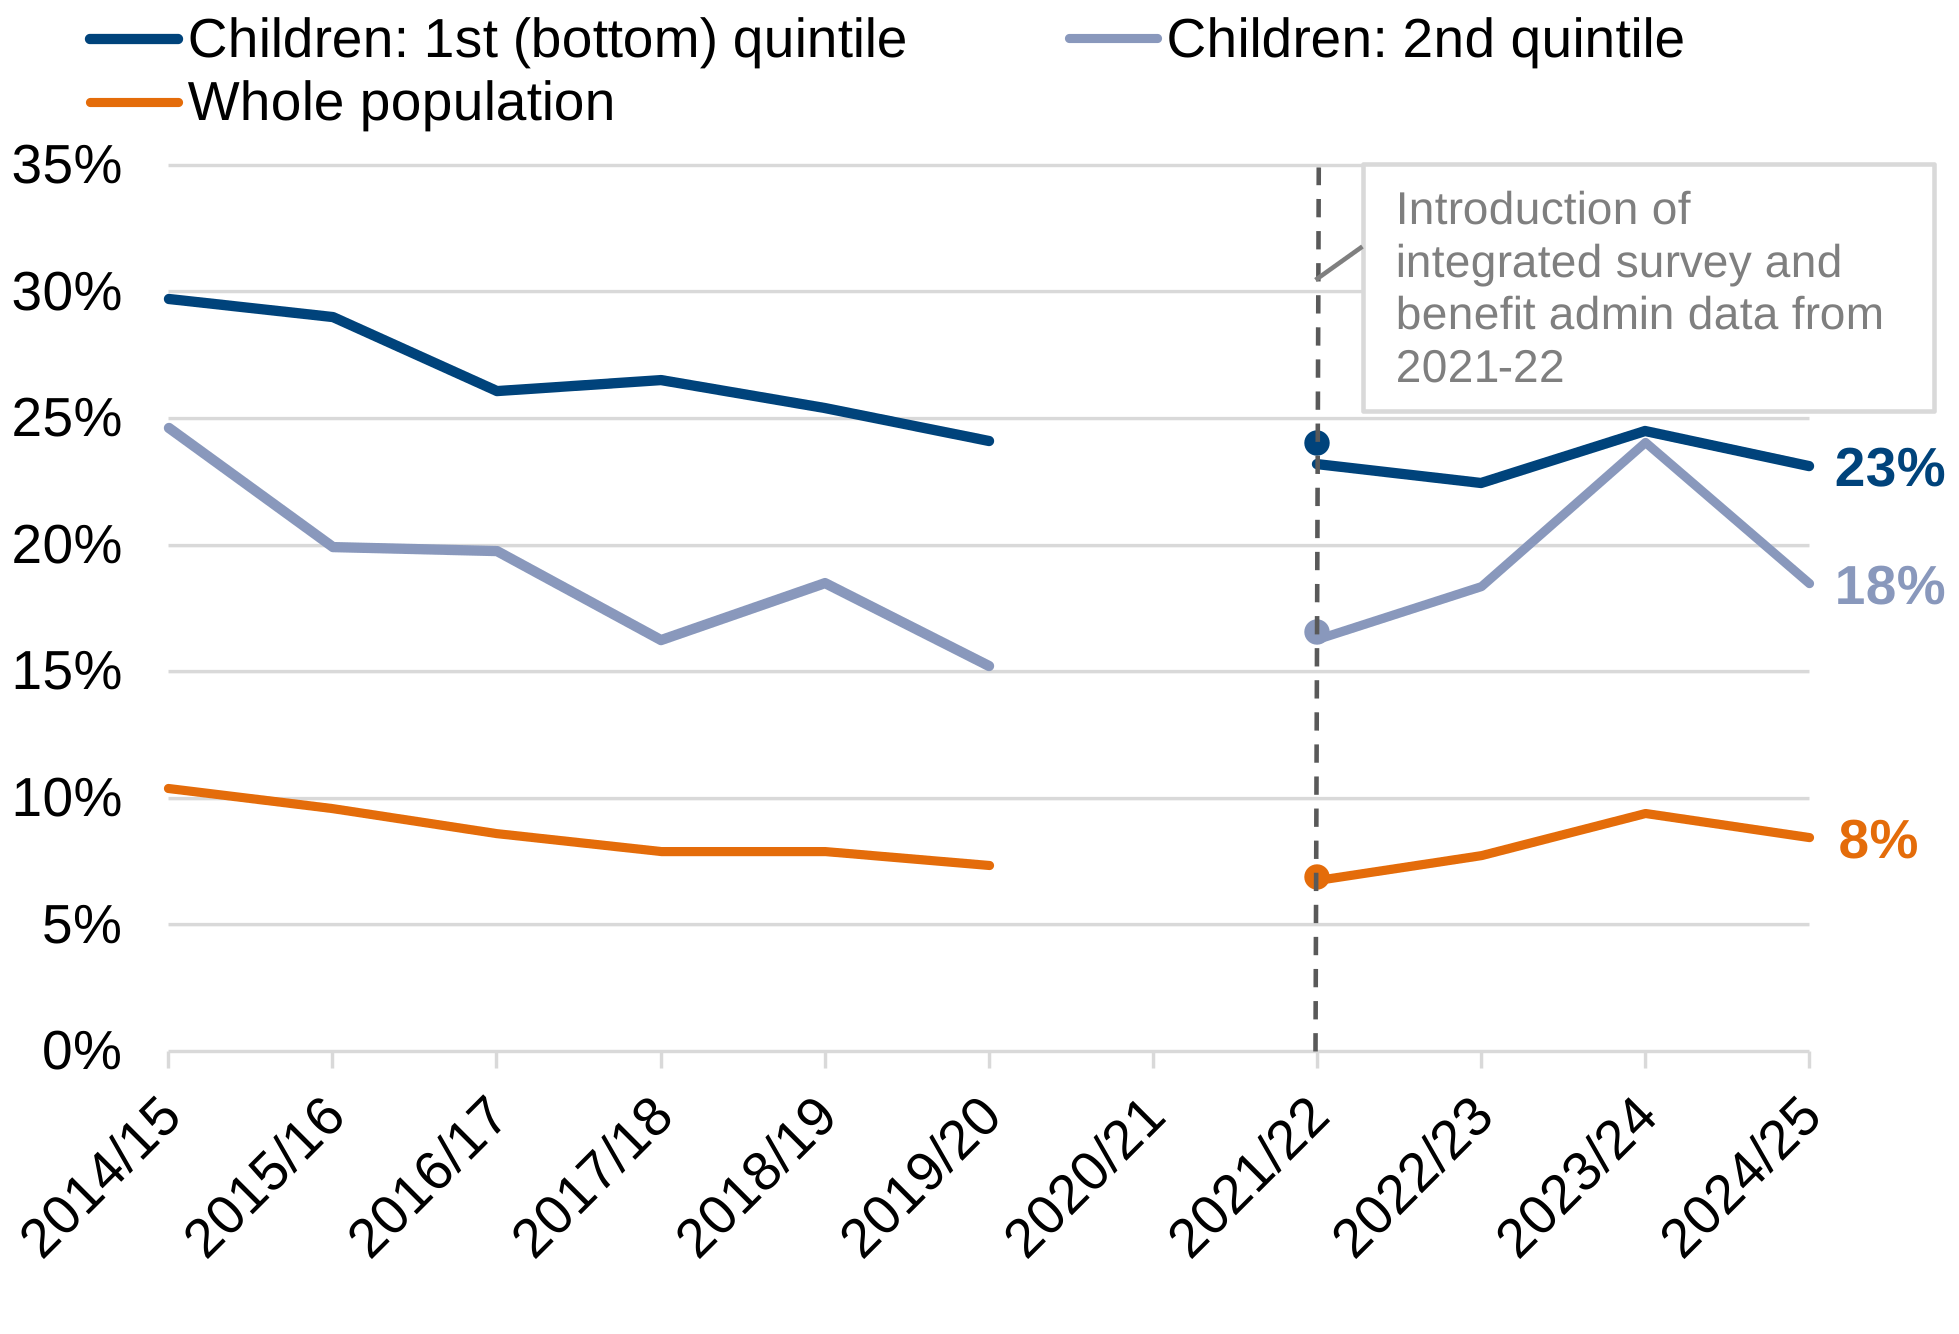
Figure 6: Percentage of children in households in the first (bottom) and second income quintiles whose household reports having been behind on household bills in the past year, United Kingdom, 2014/15 to 2024/25[footnote 6]
Notes: “Behind on household bills” refers to households reporting have been behind on at least one of the following bills at any point in the previous 12 months: electricity, gas, other fuels (e.g. coal or oil), Council Tax, water, rent and mortgage payments. Income quintiles are based on the distribution of net household income (AHC)
Between 2014/15 and 2021/22, the percentage of children in the first (bottom) income quintile that also lived in households falling behind on bills decreased by 6 percentage points, from 30% to 24%. The percentage for children in the second quintile fell by 8 percentage points, from 25% to 17%. Over the same period, the percentage for the whole population fell by 4 percentage points, from 10% to 7% (difference does not sum due to rounding).
Between 2021/22 and 2024/25, the percentage in households behind on bills remained steady for children in the first (bottom) income quintile. For children in the second income quintile, it increased sharply from 16% in 2021/22 to 24% in 2023/24, before decreasing to 18% in 2024/25. For the whole population, over the same period, the percentage increased slightly by 2 percentage points.
Baseline position
For the 2024/25 baseline year, 23% of children in first (bottom) income quintile households were in households that also reported being behind on bills, compared to 18% for children in households in the second income quintile, and 8% of the whole population.
Driving down the costs of essentials
Increases in the costs of essentials can hit low-income families harder than others. As set out in the Evidence Pack, low-income families with children spend a larger share of their expenditure on essentials, like food and fuel, and typically have fewer resources available to manage increasing or volatile costs.
Bringing down the share of income that families in poverty spend on essentials is an explicit aim of the Strategy.
Indicator 7: Household spending on essentials for low-income households with children
This indicator measures the share of overall spending going to “essentials” for low-income households with children, with essentials defined as items classified in Classification of Individual Consumption According to Purpose (COICOP) categories 01 (Food and non-alcoholic beverages), 03 (Clothing and footwear), 04 (Housing, water, electricity, gas and other fuels), 05 (Furnishings, household equipment and routine household maintenance), 07 (Transport), and 08 (Communication). Low-income households with children are those with equivalised disposable incomes in the bottom three deciles of the income distribution. Data for middle- (middle-four decile) and high-income (top-three decile) households with children are provided for reference.
This indicator is closely linked to the deep material poverty headline metric, where spending on essentials reflects what families need to spend to meet their material needs. Increases in the percentage of spending on essentials can be linked to increased deep material poverty as household budgets become squeezed and some households are unable to meet their housing, food, energy and other essentials needs.
This indicator uses data from the ONS Household Cost Indices, which are labelled as “official statistics in development”. Information about these statistics and their development can be found here: Household Costs Indices for UK household groups - Office for National Statistics.
Figure 7: Percentage of household spending on essentials by income level, households with children, United Kingdom, 2010-2024[footnote 7]
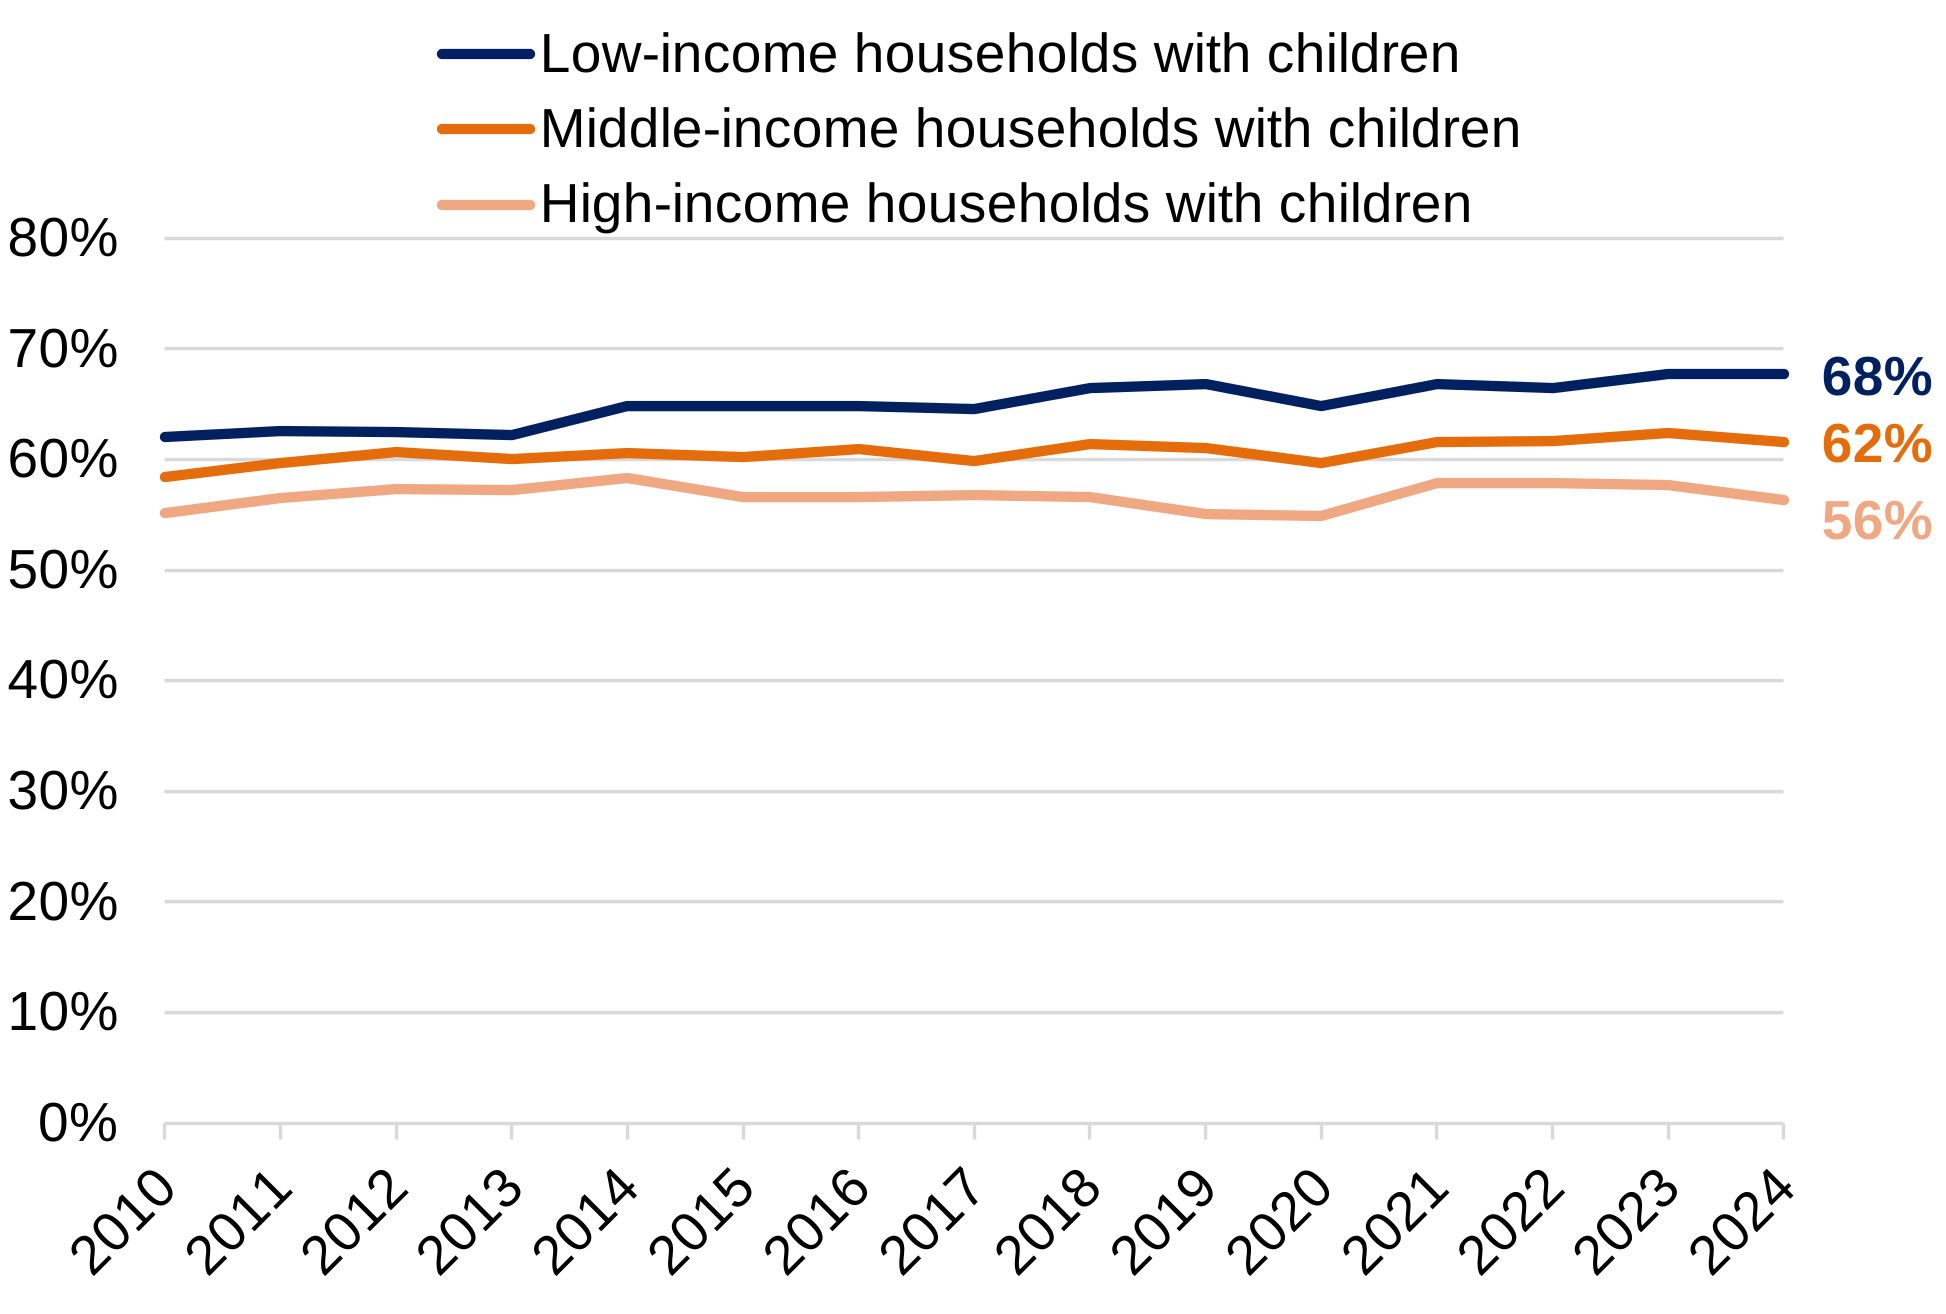
Since 2010, the share of spending on essentials has increased for all households with children but at a faster rate for low-income households with children than for middle- and high-income households with children. The share of spending on essentials for low-income households with children has increased by 6 percentage points since 2010, from 62% to 68%. Over the same period, middle-income households with children have seen the share of spending on essentials increase by 3 percentage points, and high-income households with children by 1 percentage point.
Baseline position
In 2024, 68% of overall spending in low-income households with children went on essentials. This is 6 percentage points higher than for middle-income households with children (62%), and 11 percentage points higher than for high-income households with children (56%).
Indicator 8: Children in relative low-income living in homes not meeting the Decent Homes Standard
The government’s vision for a housing system is one that provides affordable, safe, and secure housing for all, including children in low-income families. This indicator captures the frequency with which children in low income also live in homes that are “non-decent”, meaning a home that does not meet the Decent Homes Standard with respect to hazards and risks (e.g. fire and severe damp), state of repair, facilities and services, and thermal comfort. Children in low-income families are those in relative low income after housing costs based on equivalised disposable income.
Increases in the share of children in non-decent homes can be linked to and reflect increases in deep material poverty.
Data for this indicator are from the English Housing Survey and cover England only. We are working with the Scottish Government to produce the closest equivalent data for Scotland. No similar data are available for Wales, and no data are available for Northern Ireland due to insufficient sample sizes for robust estimation.
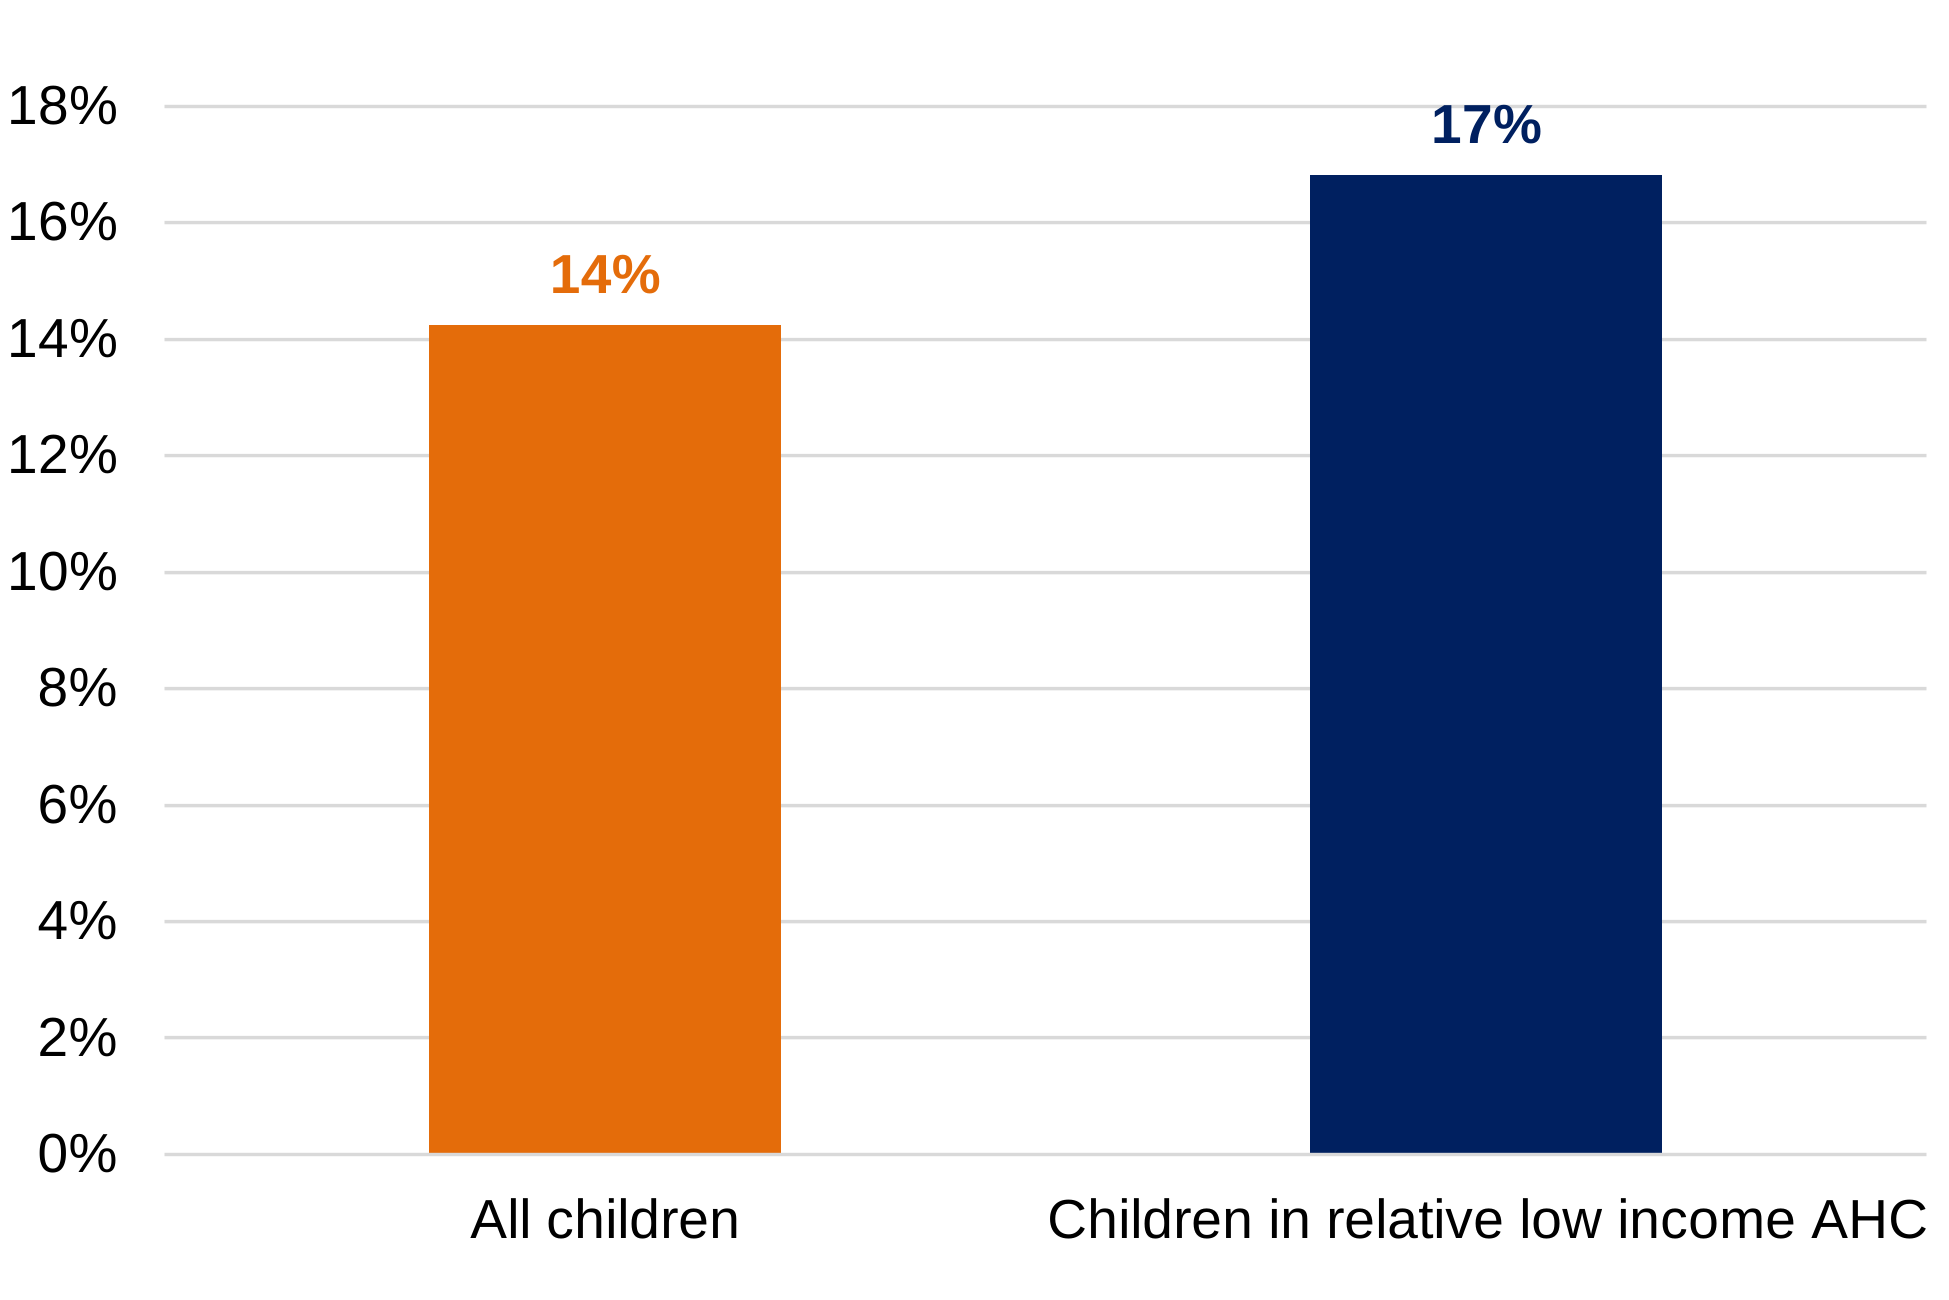
Figure 8: Percentage of children in homes not meeting the Decent Homes Standard by relative low income AHC status, England, 2023-24[footnote 8]
Notes: Children in low-income families refers to children in relative low income AHC. Homes not meeting the Decent Homes Standard are those that do not meet the basic legal health and safety standards for housing, are not in a reasonable state of repair, do not have reasonably modern facilities and services, and/or have insulation or heating that is not effective.
Baseline position
Children in relative low income (AHC) are slightly more likely to live in homes not meeting the Decent Homes Standard than all children. In 2023-24, 17% of children in relative low income (AHC) were in non-decent homes, compared to 14% of all children.
-
Source: Department for Work and Pensions analysis based on Department for Work and Pensions (2026). Households Below Average Income (HBAI) statistics. ↩
-
Source: Department for Work and Pensions analysis based on Department for Work and Pensions (2026). Households Below Average Income (HBAI) statistics. ↩
-
Source: Department for Work and Pensions analysis based on Department for Work and Pensions (2026). Households Below Average Income (HBAI) statistics; and Department for Work and Pensions (2026). Family Resources Survey. ↩
-
Source: Department for Work and Pensions calculations based on Department for Work and Pensions (2026). Abstract of DWP benefit rate statistics 2025.; Office for National Statistics (2026). Consumer price inflation tables.; Office for Budget Responsibility (2026). Economic and fiscal outlook – March 2026. ↩
-
Source: Department for Work and Pensions analysis based on Department for Work and Pensions (2026). Households Below Average Income (HBAI) statistics; and Department for Work and Pensions (2026). Family Resources Survey. ↩
-
Source: Department for Work and Pensions analysis based on Department for Work and Pensions (2026). Households Below Average Income (HBAI) statistics; and Department for Work and Pensions (2026). Family Resources Survey. ↩
-
Source: Office for National Statistics (2026). Household Cost Indices for UK household groups by children status and income group: February 2007 to June 2025.. ↩
-
Source: Ministry of Housing, Communities and Local Government (2025). English Housing Survey 2023-24.. ↩