How to analyse budgeting data and download reports
Published 5 August 2025

© Crown copyright 2025
This publication is licensed under the terms of the Open Government Licence v3.0 except where otherwise stated. To view this licence, visit nationalarchives.gov.uk/doc/open-government-licence/version/3 or write to the Information Policy Team, The National Archives, Kew, London TW9 4DU, or email: psi@nationalarchives.gov.uk.
Where we have identified any third party copyright information you will need to obtain permission from the copyright holders concerned.
This publication is available at https://www.gov.uk/government/publications/oscar-guidance-for-budgeting-plans-and-outturn/how-to-analyse-budgeting-data-and-download-reports
There are several ways that users can review the overall position for control totals within budgeting. This guidance focuses on data that is in the live budgeting system (e.g. the last five available outturn years and five plans years).
There are methods to review data from snapshots e.g. to see data as at a certain publication time (for Estimates) or to review older outturn data no longer in the live system. More information is available about this here.
This page focusses on the following:
- Downloading the ‘Extract - DAR Daily’ report
- Reviewing data within the Data Input ‘Control Totals’ tab
- Reviewing data within the Data Input ‘Control Totals Adjustment Tracker’ tab
- Downloading Estimates reports
1. Downloading the ‘Extract - DAR Daily’ report
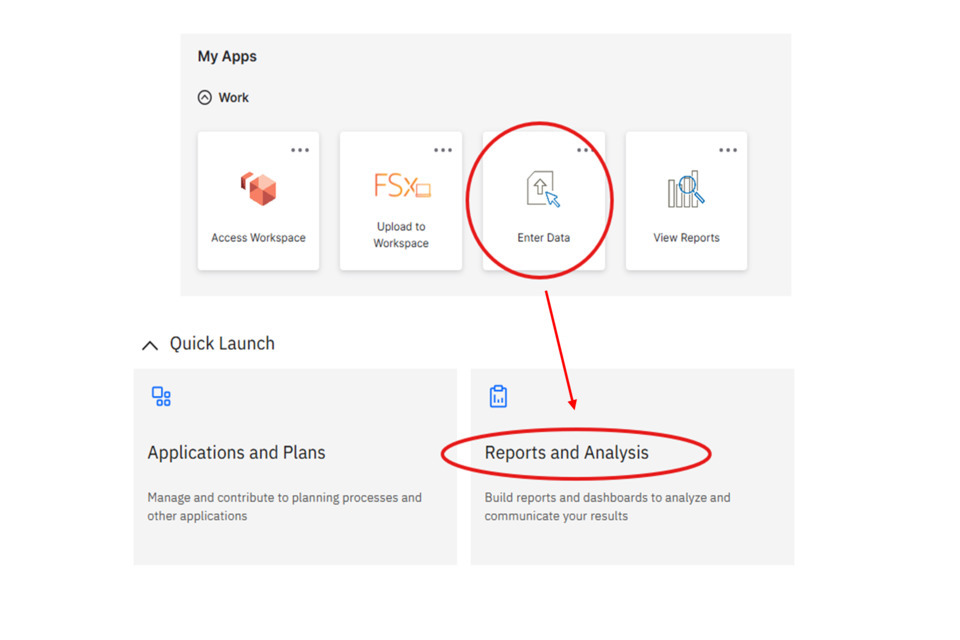
1) When logged onto OSCAR, click ‘Enter Data’, following by ‘Reports and Analysis’:
2) Click Budgets & Estimates, followed by ‘Data Input’
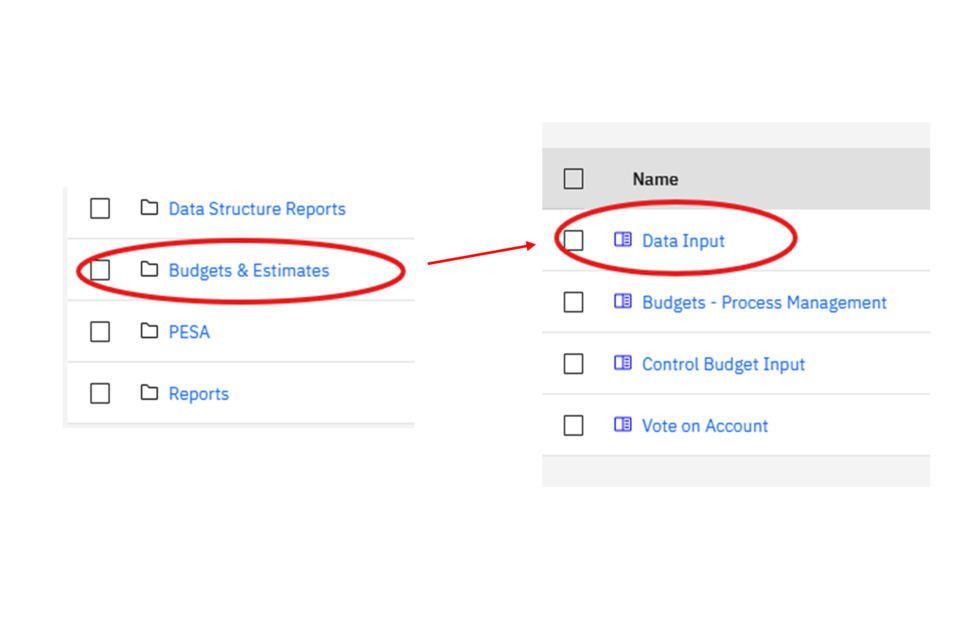
You can review your submitted data, and the overall impact it can have on your confirmed control totals by running a DAR report. Click on the ‘Extract – DAR DAILY’ tab:
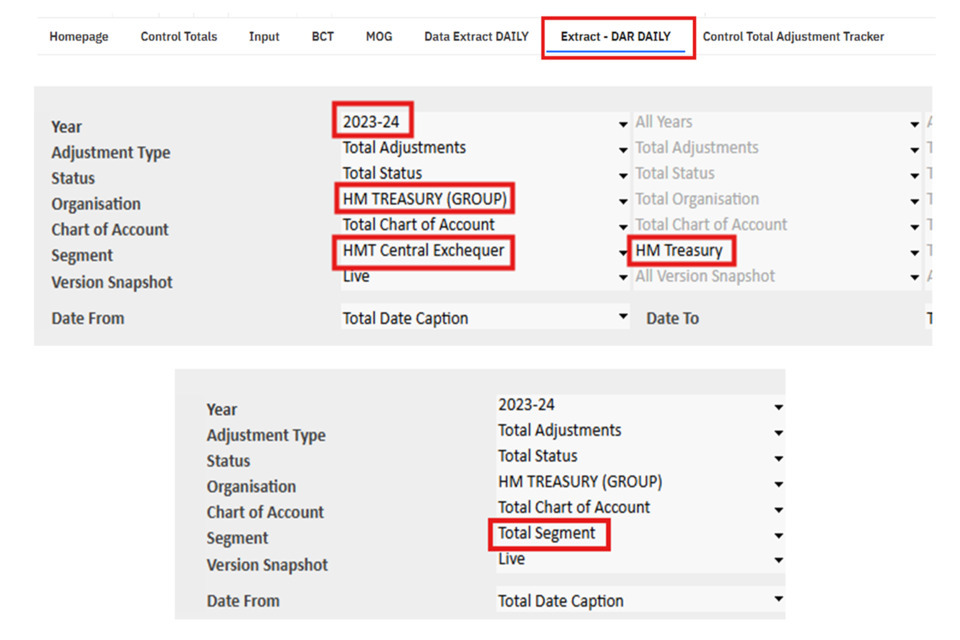
3) Select the fields relevant to the report you would like to run. Note that download speed improves if just selecting one year at a time. The department should be selected in the ‘Organisation’ box. Most users will have to select two options for the ‘Segment’ box - one option for ‘HMT Central Exchequer’ and select the department in the second box. This makes sure any adjustments loaded centrally are captured within the reports. Some users with additional permissions will be able to select a ‘Total Segment’ option:
You should notice that data appears in the view below once all fields have been populated:
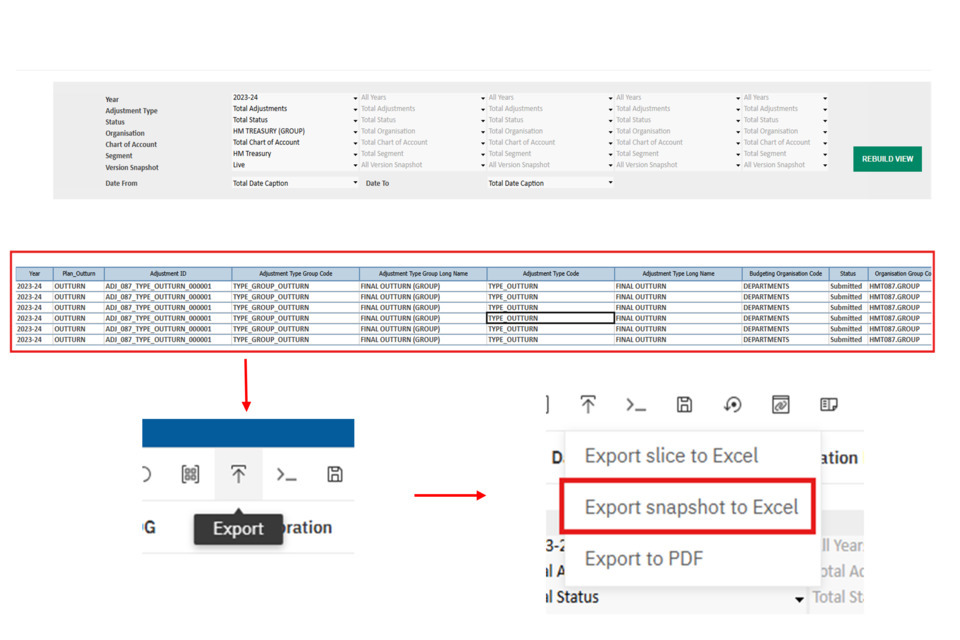
- Once the selections have been made, click anywhere in the data set that has appeared (in the red box from the screenshot above).
- Then click on the export button at the top bar of the page.
- Click ‘Export Snapshot to Excel’. Do not click the ‘Slice’ option (this won’t download the data correctly).
- A long list of options with selection boxes will appear. You do not need to click on any of them. Scroll to the bottom of the list and click ‘Ok’:
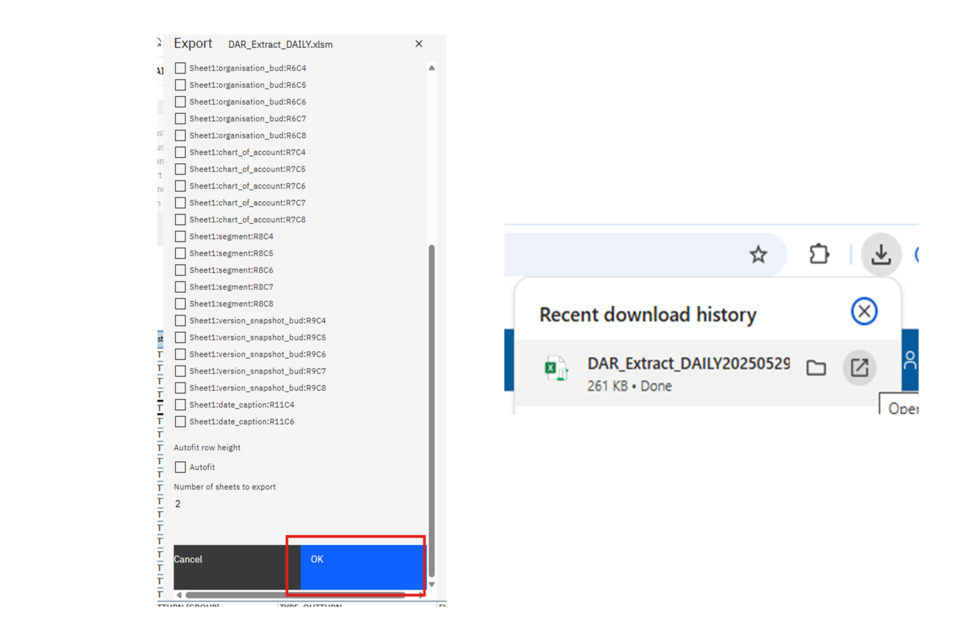
The box above will disappear, and OSCAR will give no indication that the report is running. But within a couple of minutes, your report should download within your browser (as shown above).
4) Once you have downloaded the report, you can then create a PivotTable to review your data. If you are unfamiliar with PivotTables you can follow these steps. If you are familiar with creating and using PivotTables, you can skip to Step 7:
Click enable editing, and then click anywhere within the data (from row 37 down). Then press ctrl + A to select the entire table. The click on the ‘insert’ tab and click on the ‘PivotTable’ button (not the arrow, just the button itself):
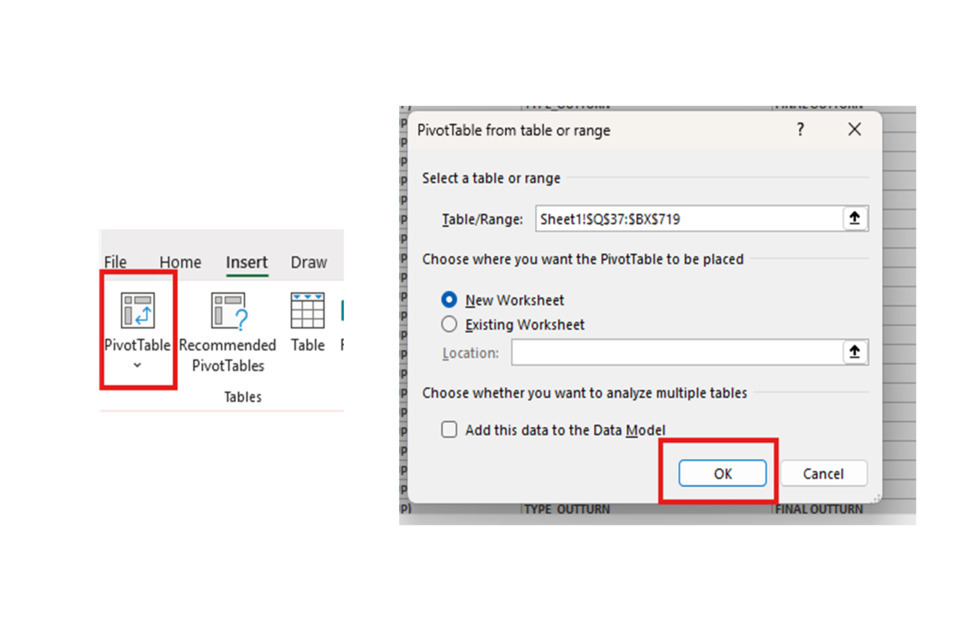
A box should appear, which is showing you the data it has selected for the PivotTable (which was previously selected by pressing ctrl + A). Just click ‘ok’.
5) Once you have created a PivotTable, this will create a new tab. With the PivotTable field box showing on the right hand side, drag and drop the following fields into the following boxes:
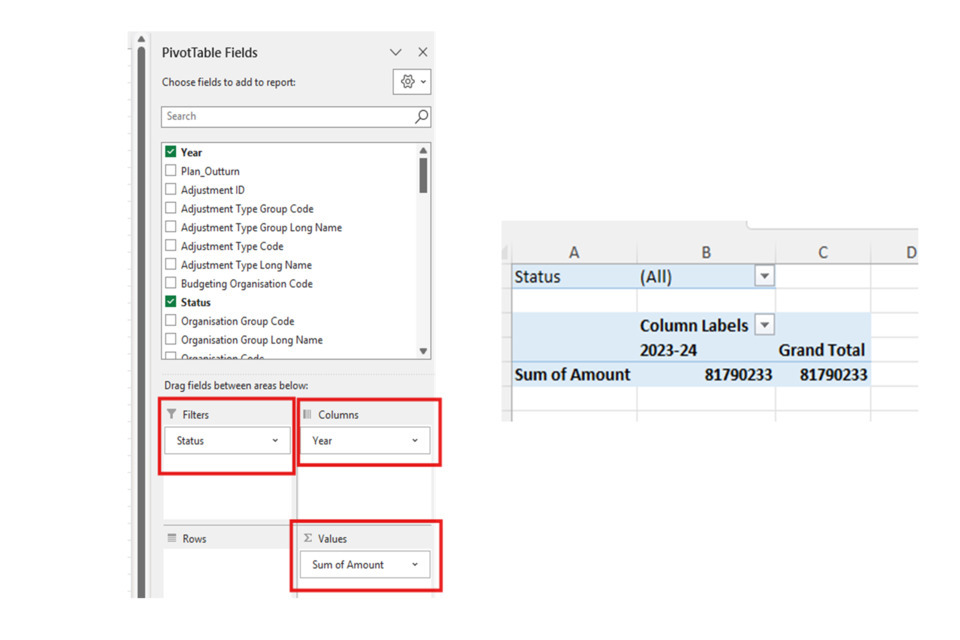
This should result in your PivotTable populating with some data, similar to the above screenshot.
6) To make your PivotTable more readable, you can take the following steps.
- Highlight the number values (in this screenshot columns B and C) and click on the home tab. Click on the arrow next to the ‘Number’ option:
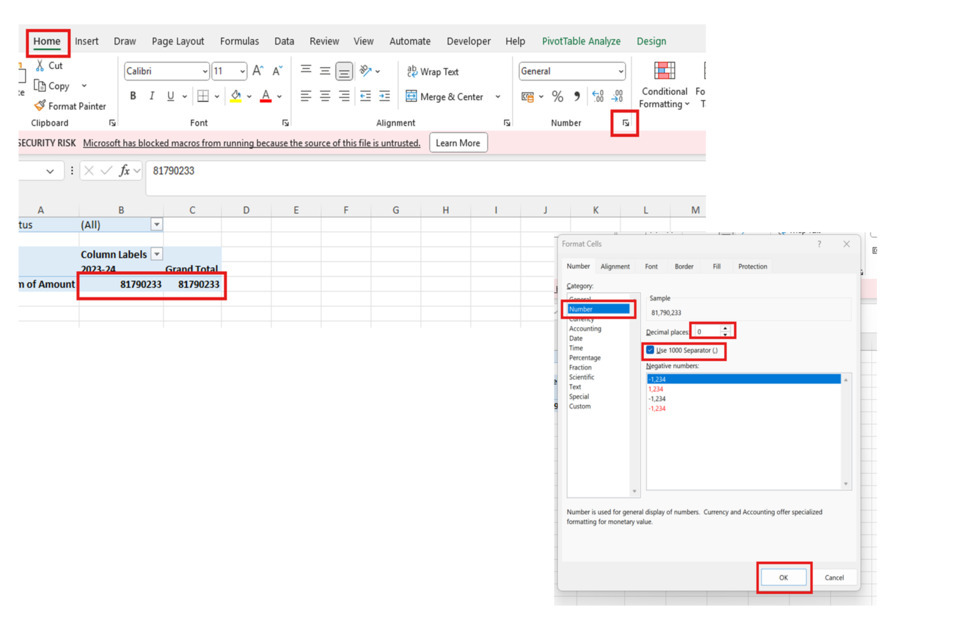
Click on the number option on the left, remove the decimal places (as Budgeting does not have any decimals), and add a thousand separator. Click ‘ok’.
- Right click on the pivot table, and click on ‘PivotTable Options’:
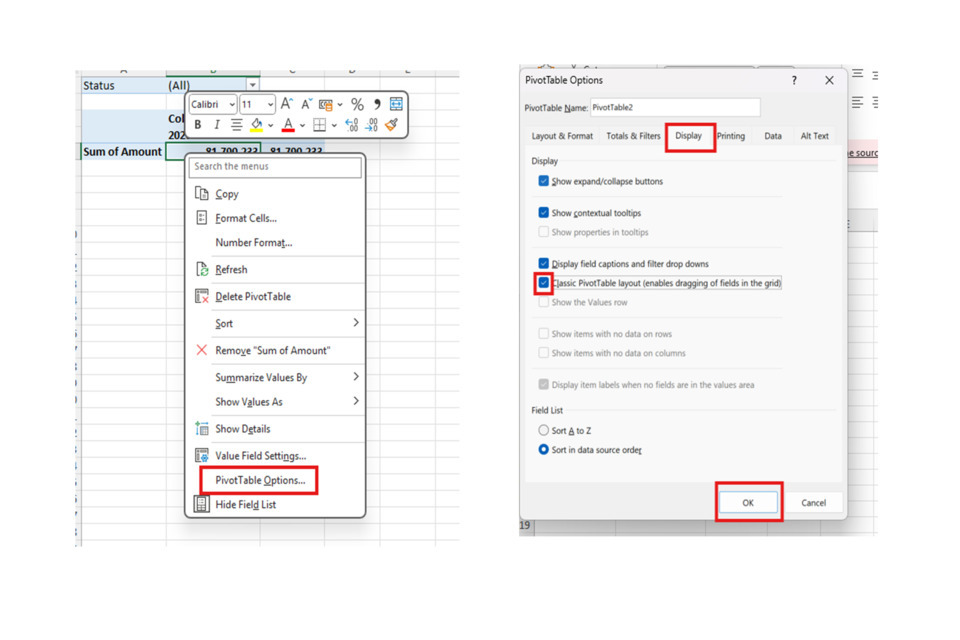
In the Display tab, click on the box for the Classic PivotTable layout, and then click ‘ok’.
- If you click on the PivotTable a ‘Design’ tab should appear, which has lots of options for customisation.
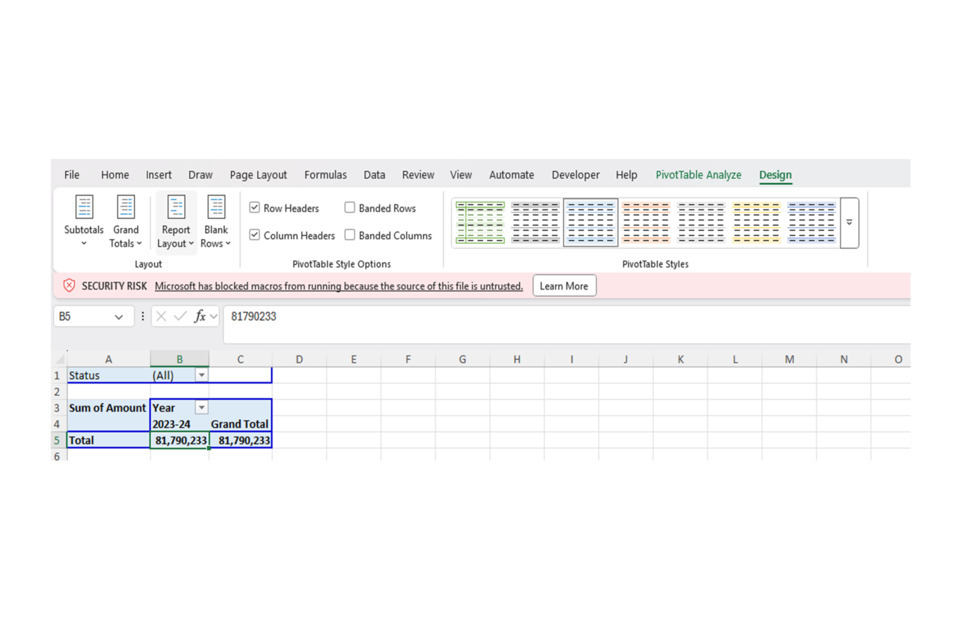
Here, the following steps would be recommended:
- Subtotals: Do Not show Subtotals
- Grand Totals: On for Columns only
- Report Layout: Repeat all item labels
7) In the Rows field for the PivotTable options, drag and drop the following fields:
- Economic Budget Code
- Control Budget Code
- Control Budget Detail Code
- Economic Ringfence Code
This will populate the pivot table with the main control totals:
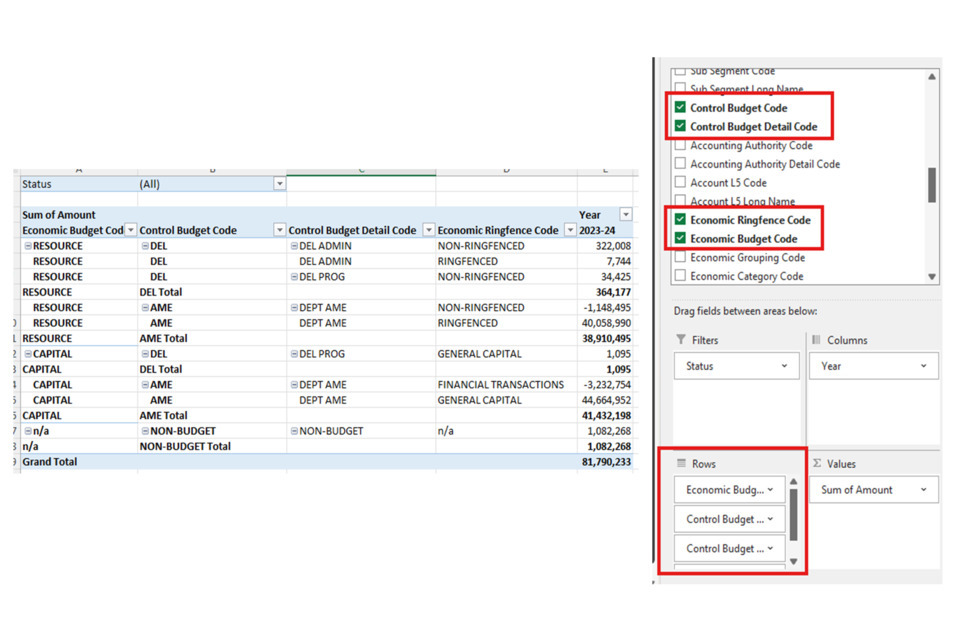
Note: this view has been updated by moving the order of the resource/capital rows, and adding subtotals for the control budget code by right clicking and adding the option.
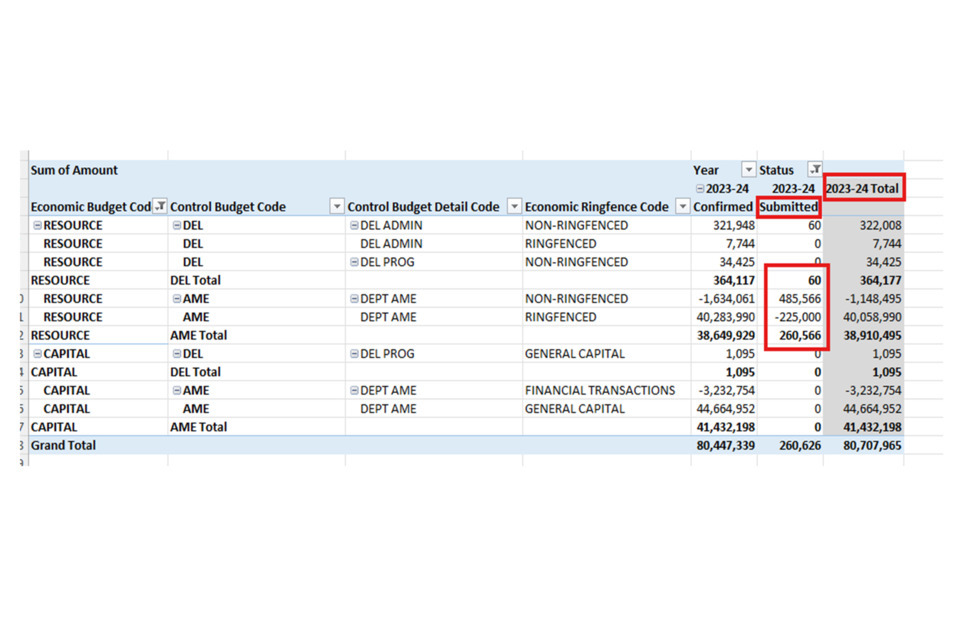
8) Next, drag and drop the status field into the column field, under year:
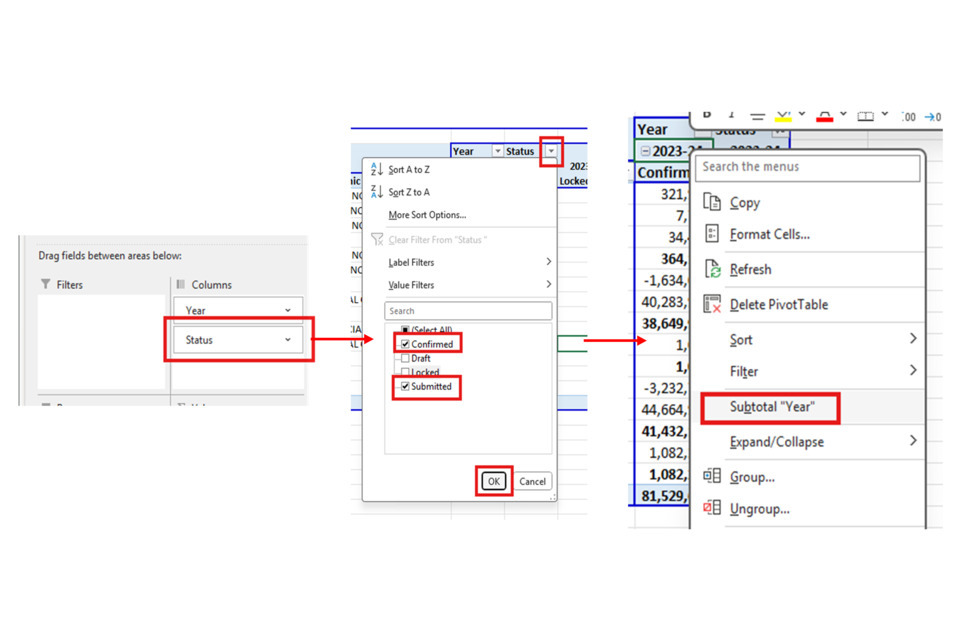
This will show you the status fields appear separately. Filter for just Confirmed and Submitted (although you can also do this for locked data if you wish to view before submitting). As shown above, right click on the year, and click ‘Subtotal Year’.
9) This then allows you to see the overall totals in the submitted status added to the confirmed adjustments, and review what the overall impact of the submitted adjustment would be:
There are also lots of other fields within the DAR that you can drag in to view lower-level fields within the data, such as account code, sub-segments, economic categories, etc.
2. Reviewing data within the Data Input ‘Control Totals’ tab
1) When logged onto OSCAR, click ‘Enter Data’, following by ‘Reports and Analysis’:
2) Click Budgets & Estimates, followed by ‘Data Input’
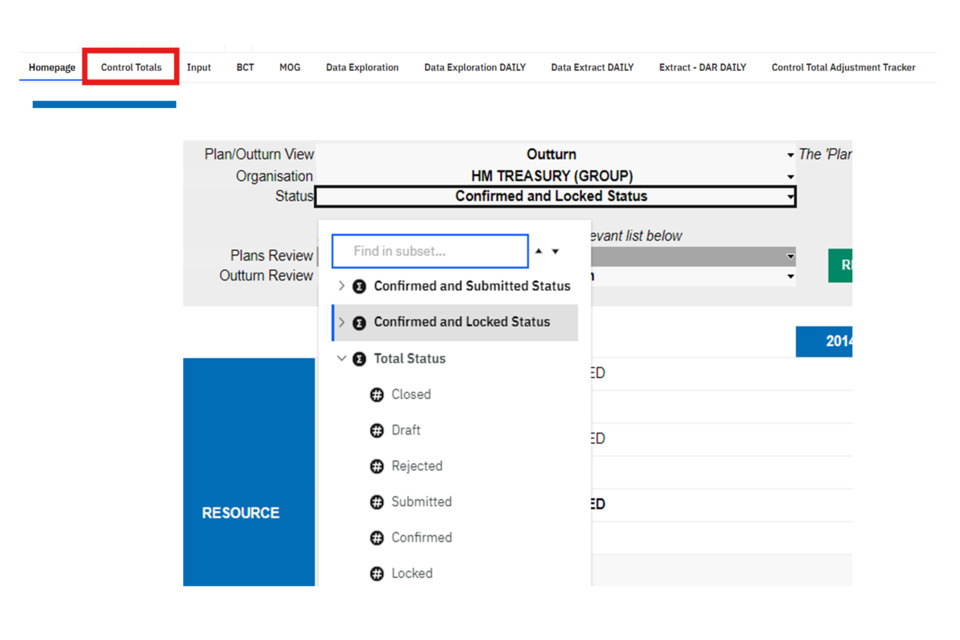
3) Navigate to the ‘Control Total’ tab. The selections will automatically be set to a default view of plans for your selected department, as ‘Confirmed and Locked Status’:
2.1 Statuses
4) The selection of different statuses will change the view users can see. The key statuses to note are:
- Confirmed: Will shown all outturn data that has been submitted by departments and confirmed by spending teams
- Submitted: Will shown all outturn data that has been submitted by departments and is waiting on Spending Team approval
- Locked: will shown outturn data that has been locked by a department but not submitted
Combined totals can be viewed to understand what the revised outturn position will be when added to the totals already confirmed. This includes:
- Confirmed and Locked: To view confirmed + locked data (yet to be submitted by departments)
- Confirmed and Submitted: To view confirmed + submitted data (yet to be confirmed by spending teams)
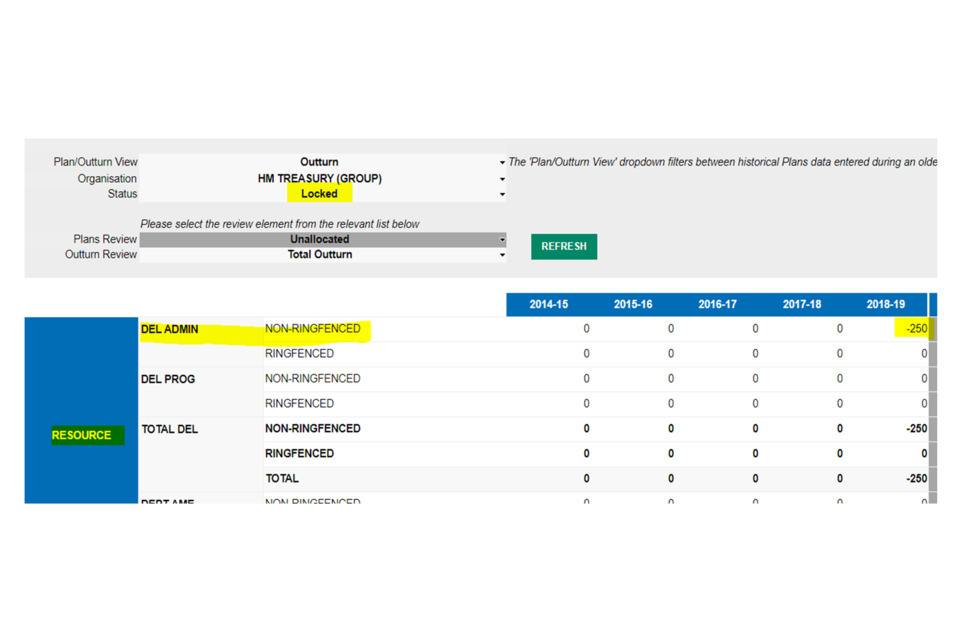
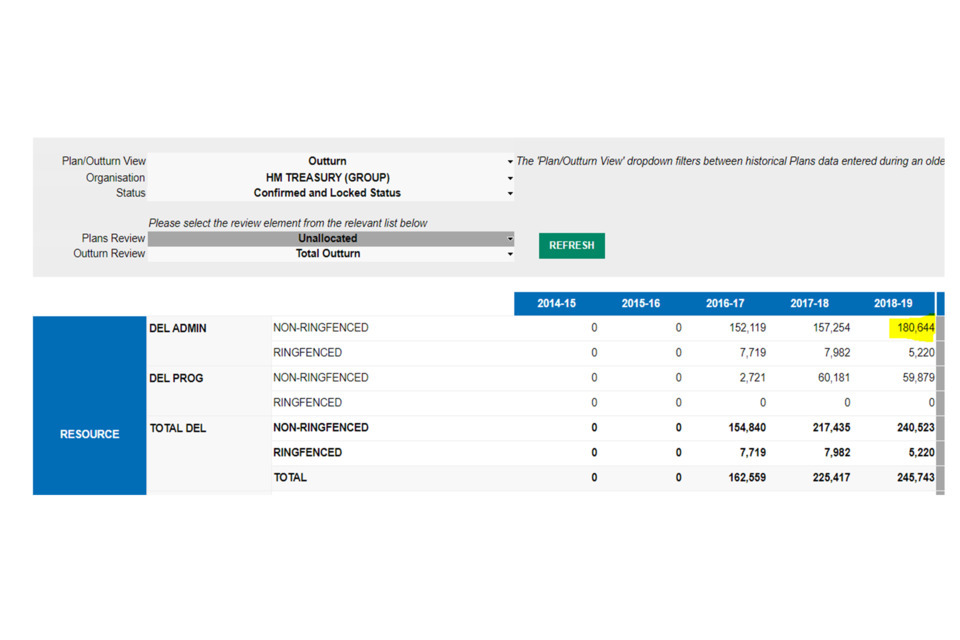
For example:
Locked’ status shows -250 for RDEL Admin in 2018-19:
Confirmed status shows the totals already confirmed (180,894 for RDEL Admin in 2018-19):
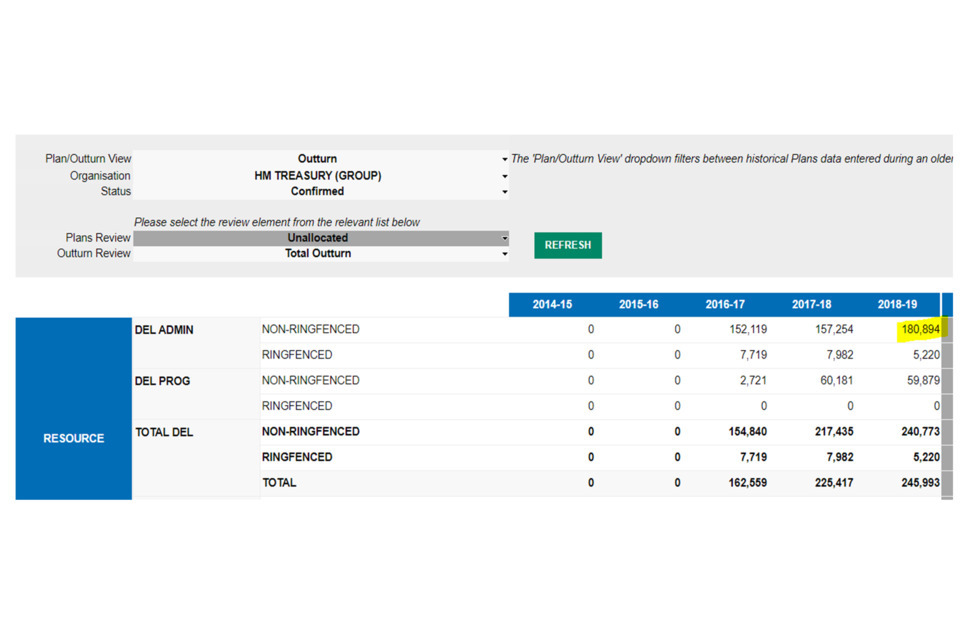
Confirmed and Locked status shows a total of 180,644 (the confirmed total of 180,894 less 250):
2.2 Outturn
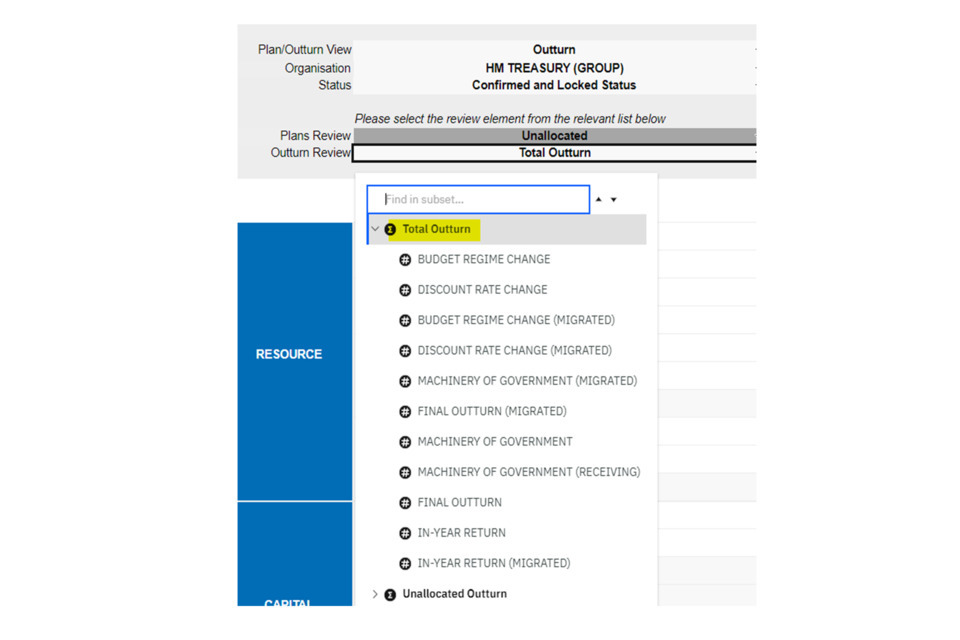
5) Select ‘Outturn’ from the Plan/Outturn View dropdown:
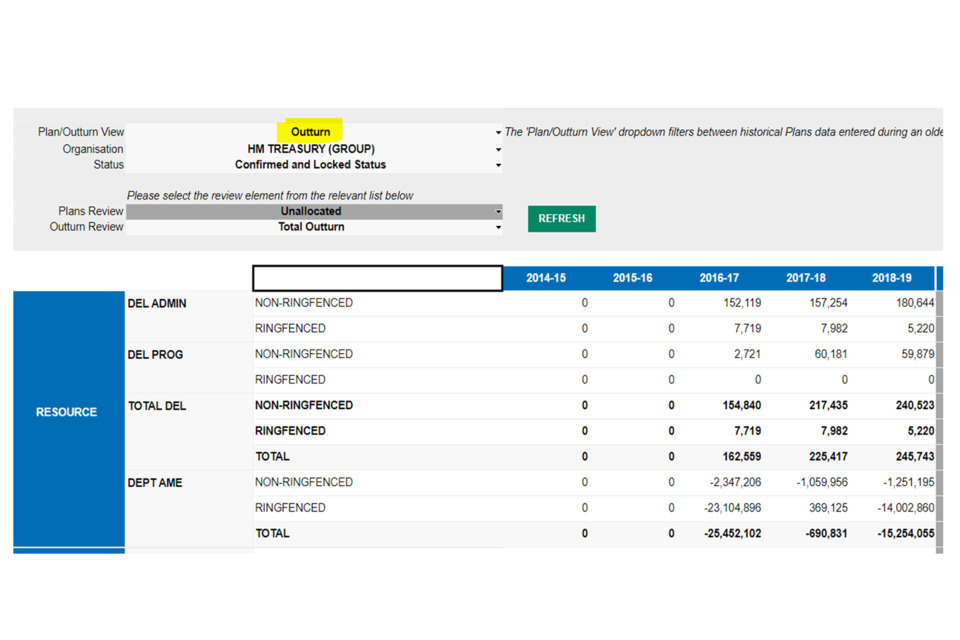
Please note that the ‘Total Outturn’ filter should remain selected to see the overall outturn position.
If users are looking for separate in-year and final outturn totals, they can select from a range of options from this dropdown:
2.3 Plans
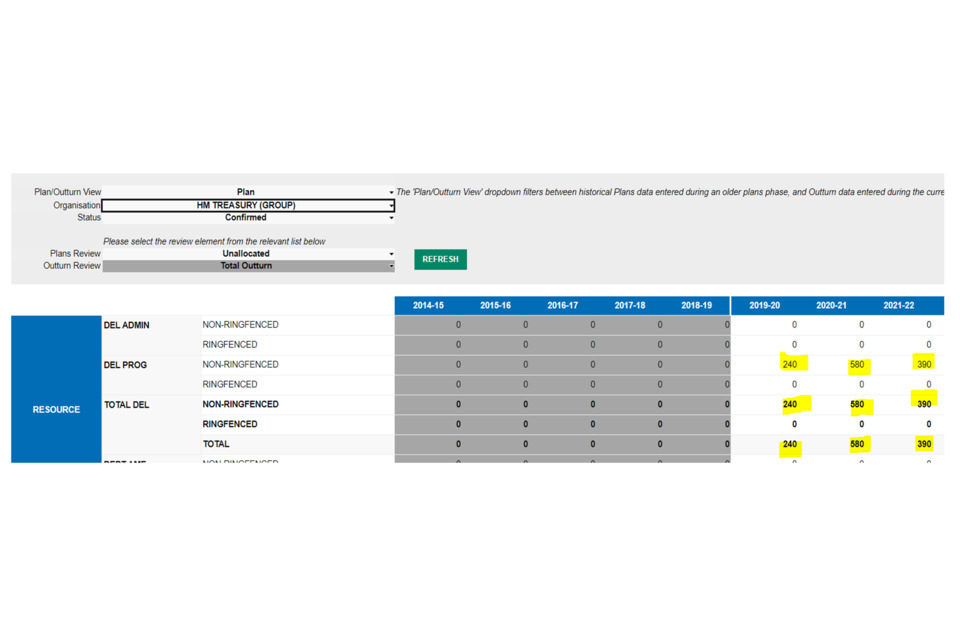
6) To view plans data, select the ‘Plan’ option from the Plan/Outturn View dropdowns
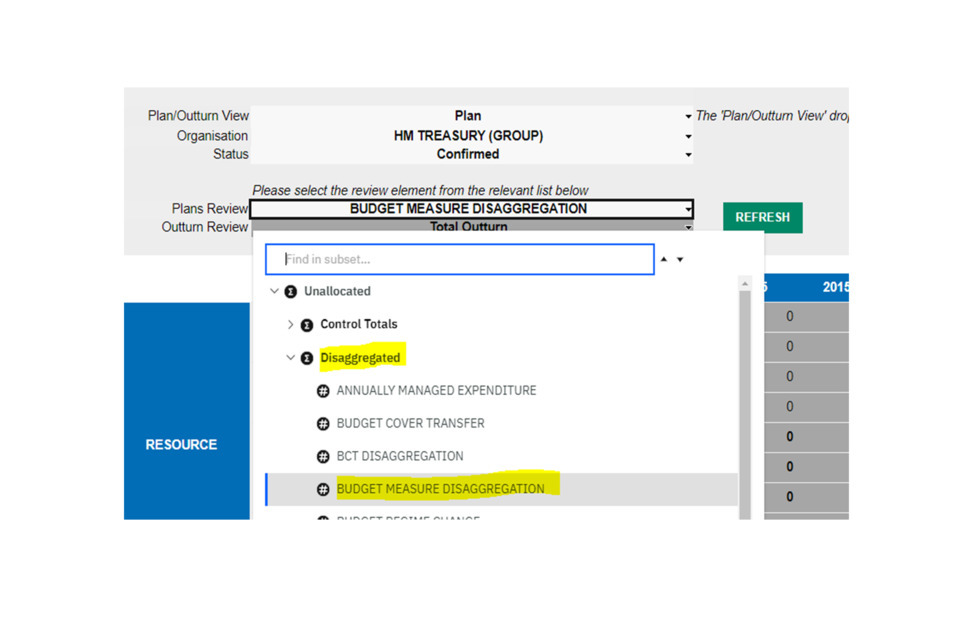
If there is any data that needs to be disaggregated, this will appear under the view when selected the status as ‘Confirmed’ and the Plans Review dropdown as unallocated:
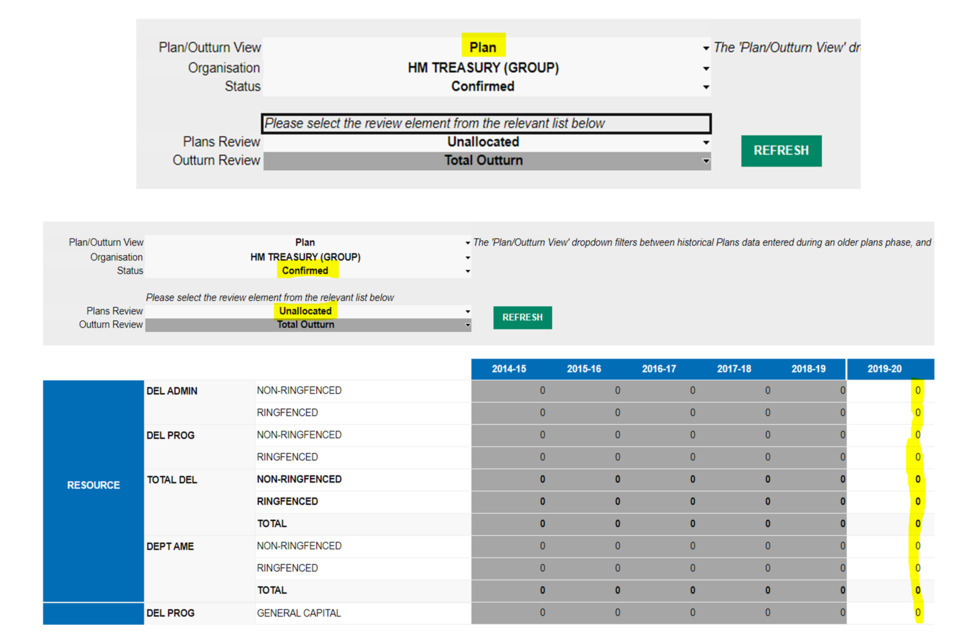
If there is no data to be disaggregated, all columns would appear with 0s.
If there is data to be disaggregated, the total amount will display in the view:
7) Underneath the plans review dropdown, there are two overall totals:
- Unallocated > ‘ Control Totals’ = shows the view of the unallocated totals + disaggregated totals
- Unallocated > ‘Disaggregated’ = shows the view of disaggregated totals only
If you subtract the ‘Disaggregated Totals’ from the ‘Control Totals’ data, this will leave you with the total amount of data that needs to be disaggregated. For example:
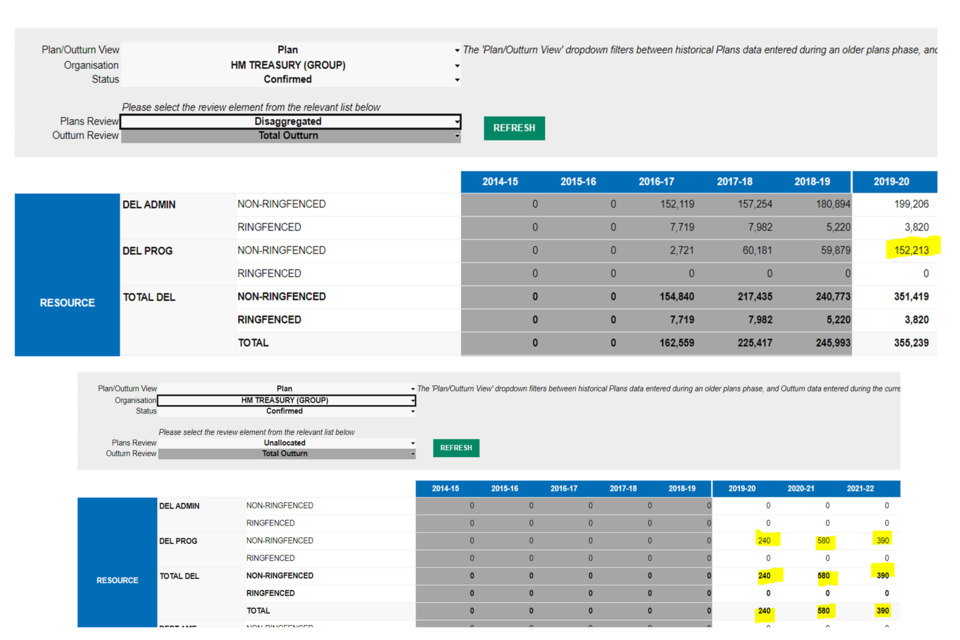
The control totals view shows a value of 152,453 in 2019-20 for RDEL Programme Non-Ringfenced data:
The disaggregated view shows a value of 152,213 in 2019-20 for RDEL Programme Non-Ringfenced data:
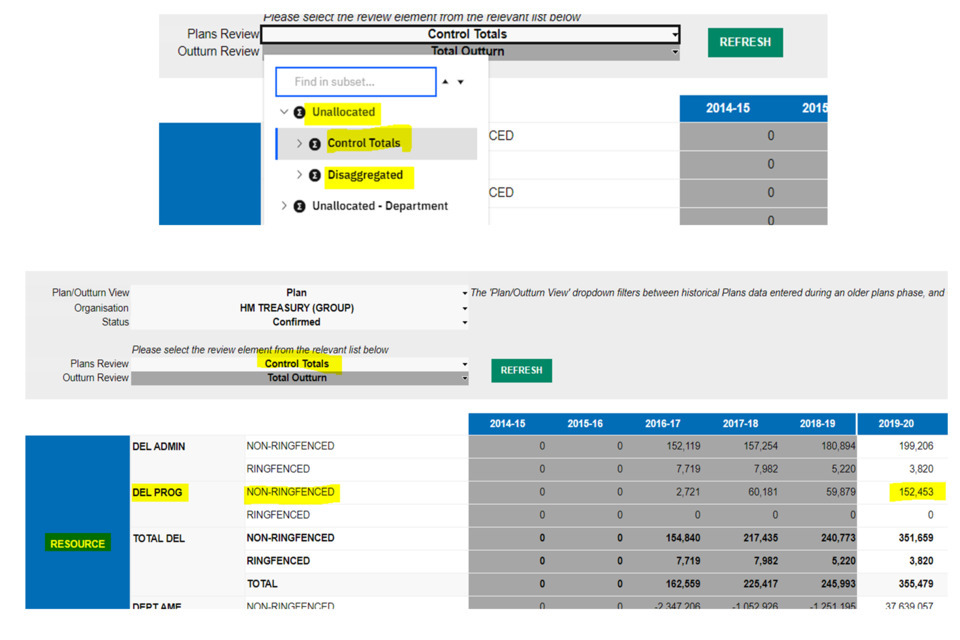
This amount is equal to ‘240’, which is the overall total as shown in the Unallocated View (as shown above).
2.4 Adjustment types
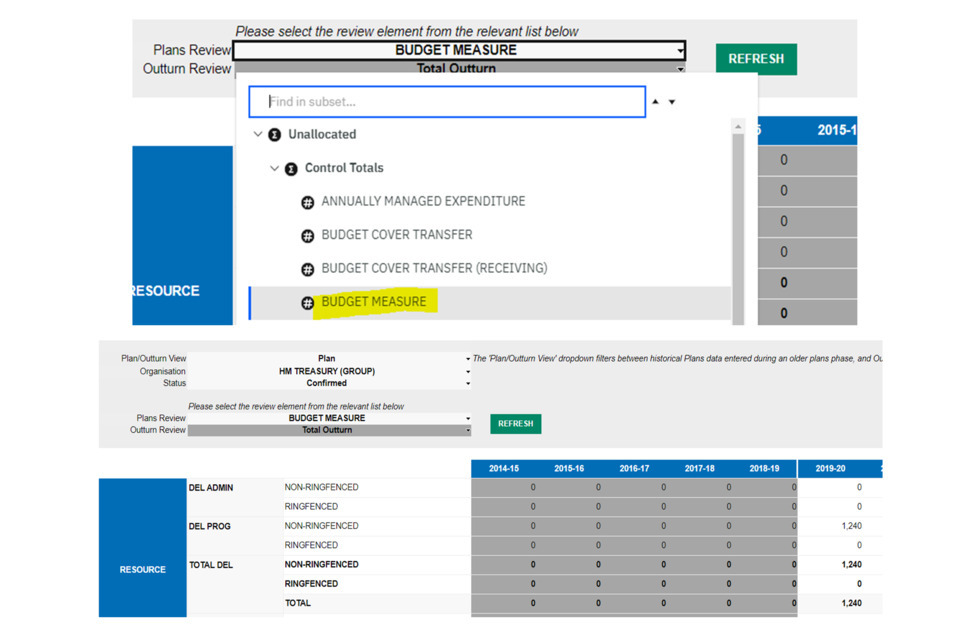
8) You can view the totals by adjustment type within the control total under the disaggregated/control total dropdowns. For example, by selecting ‘Budget Measure’ from the Control Totals dropdown the unallocated data for this adjustment is shown:
Similar to the layout as explained in the Control Totals and Disaggregated Totals section, when selecting ‘budget measure disaggregation’ under the ‘Disaggregated’ heading, there is a difference in data of 240. This is because there is an amount of 240 that needs to be disaggregated against a budget measure disaggregation type:
Note that the total unallocated amount could be the sum of unallocated amounts from different adjustment types. For example:
| Adjustment type | Unallocated Amount |
|---|---|
| BCTs (Receiving) | 100 |
| Budget Measures | 100 |
| Reserve Claims | 40 |
| Total | 240 |
In the above example, three separate disaggregation adjustment types would be needed to allocate all data on OSCAR. If a user attempted to disaggregate all data under one adjustment type, validation errors would appear as the amount against that adjustment type would be wrong.
3. Reviewing data within the Data Input ‘Control Total Adjustment Tracker’ tab
The Control Total Adjustment Tracker is a report designed to show users the data uploaded centrally by HM Treasury. The report is filtered specifically for Budget Measures, Spending Review Settlements, Reserve Claims and Budget Exchanges only. The report offers a quick glance at the adjustments that have been loaded, sorted by date order (with the most recently loaded adjustments presented at the top of the report).
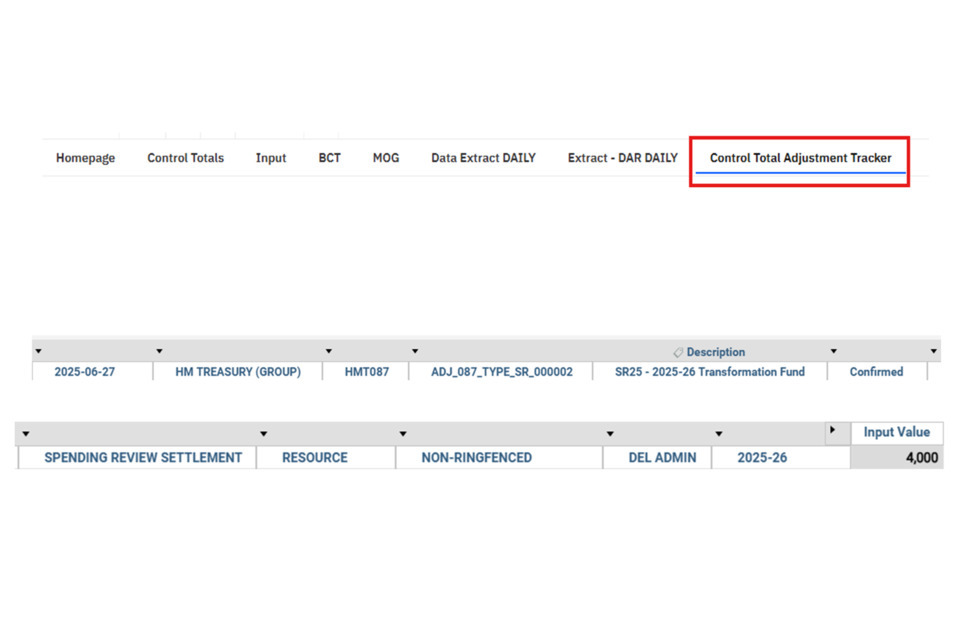
The first column of the report shows the date that the adjustment was loaded, followed by the department group and code (this is more beneficial for those users with access to multiple departments). The fourth column shows the Adjustment ID in which the data was loaded in, followed by the adjustment ID description (which may provide detail as to what the data loaded is for or refers to). The adjustment status has been filtered for confirmed data only.
After the status column, the report shows the full name of the adjustment type (in this example ‘Spending Review Settlement’). This would mean that the data loaded for this adjustment would need to be disaggregated as a Spending Review Settlement Disaggregation adjustment type within the ‘Input’ tab (more information on loading adjustments is available here.
This is then followed by the economic budget code (whether the expenditure is Resource or Capital), the economic ringfence code (e.g. whether the expenditure is ringfenced, non-ringfenced, general capital, financial transactions), and the control budget detail code (whether the expenditure is DEL Admin or DEL Prog). Lastly, the year of the adjustment is given before the amount (in £’000s) is presented within the ‘Input Value’ column.
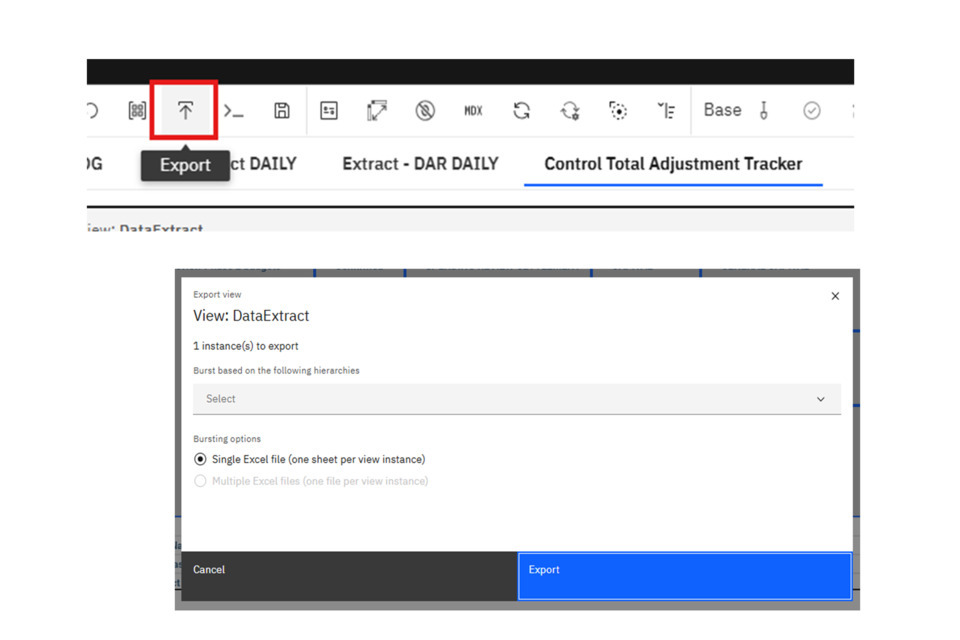
If you wish to download the report, you can do so by clicking anywhere within the report to make the ‘Export’ button on the top bar appear. Click it, and then click ‘Export’. The report should then download within Excel.
4. Downloading Estimates Reports
Estimates reports are available to download directly from OSCAR, based on Live data or data available within snapshots. Note that if the Live system is pointing towards Mains, the Supplementary Report cannot be run for Live (it will return an empty report). The same applies to Mains when the Live system is pointing to Supplementary Estimates. However, reports can always be run against available snapshots for previous years.
To note that the formatting and content of the OSCAR reports differ to the final reports ready for printing, which incorporate text (such as ambits) and additional formatting where the OSCAR reports are different. It’s advised that these reports are used to analyse the data position only, which should align to any data adjustments loaded to the budgeting system.
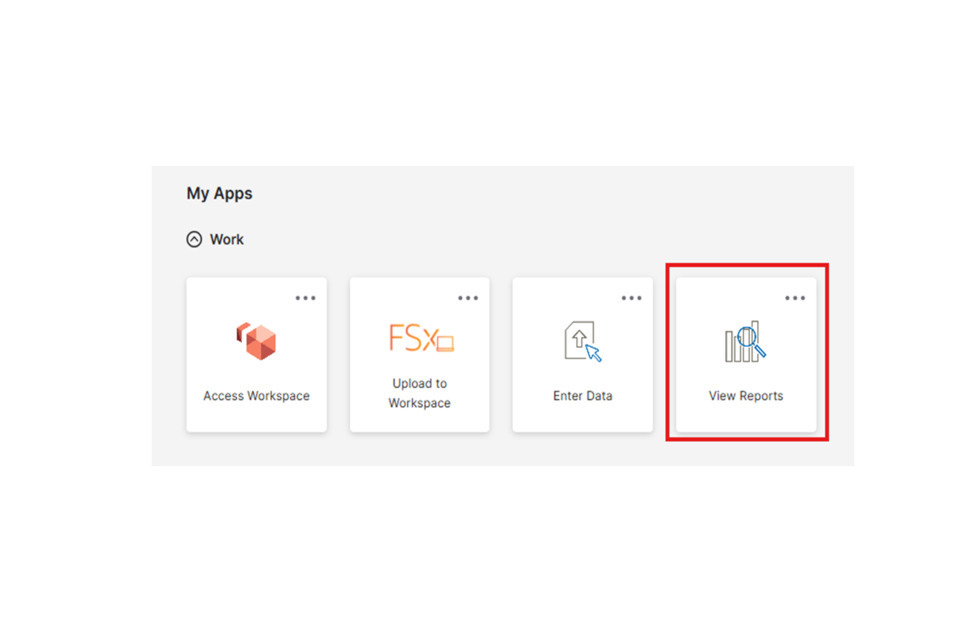
1) Once logged onto OSCAR, click on ‘View Reports’
2) This will land on the IBM Cognos Analytics page. In the top left corner, click on the three horizontal bars (the menu button) and click ‘Content’.
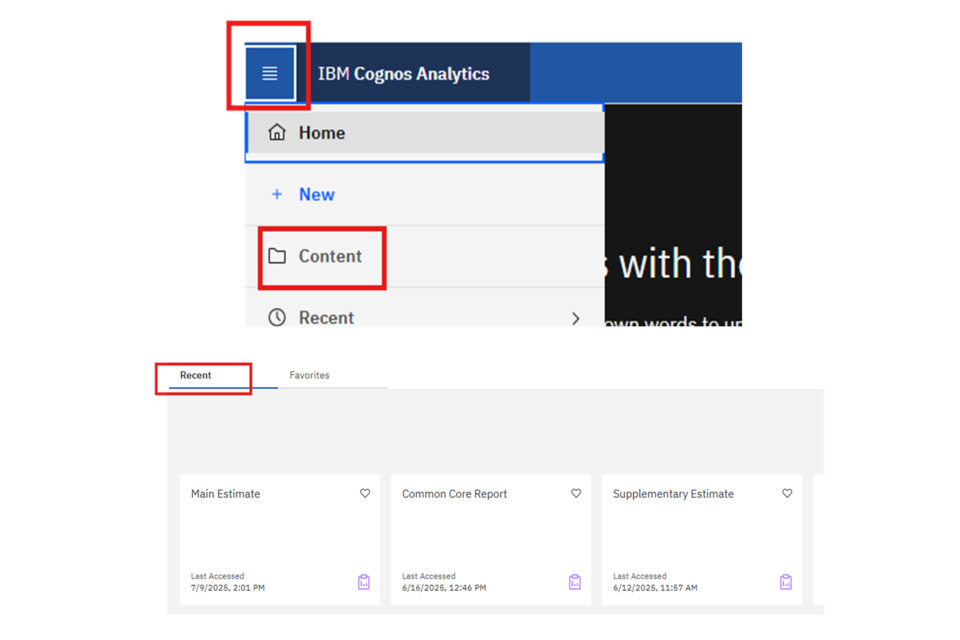
To note, users that have previously run reports will see options at the bottom of the screen to quickly access their recently used reports (as shown in the above image). Users can click directly on these reports and follow the guidance from step X below to download reports if preferred.
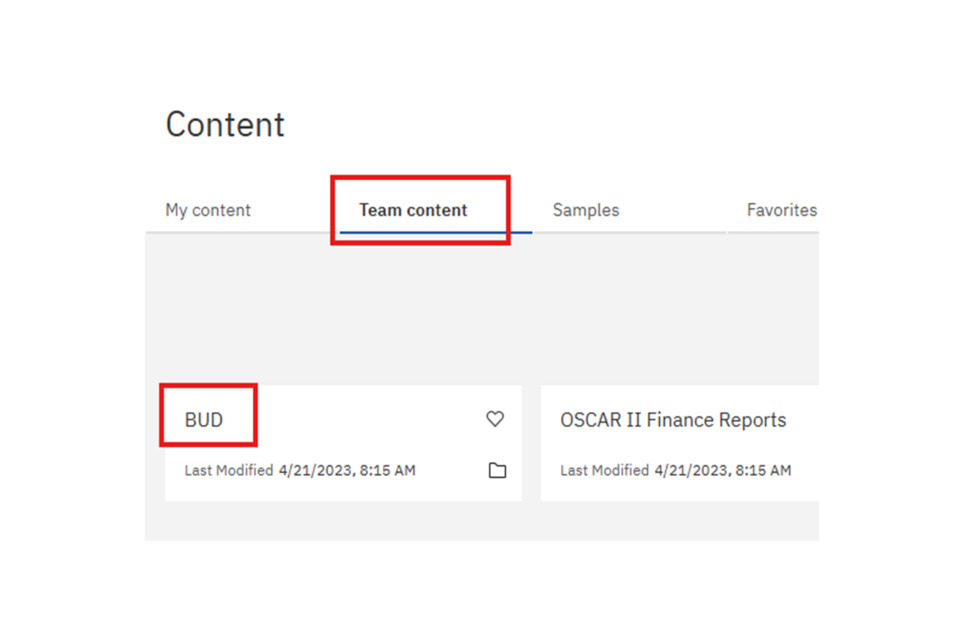
3) On the content page, make sure that you are within the ‘Team content’ tab, before clicking on ‘BUD’:
4) Click on ‘Publication Reports’. Here, you will then have an option to either run a Main Estimates report or a Supplementary Estimate report. The steps are the same for both types of report, but this guidance uses Main Estimates as an example. Click on Main Estimates/Supplementary Estimates.
On the next page there will be a number of options, including bespoke reports that are built for DfE and MHCLG. For users looking to run these reports, the steps are the same as set out in this guidance. For all other departments, the report to run will be the Main Estimate/Supplementary Estimate report.
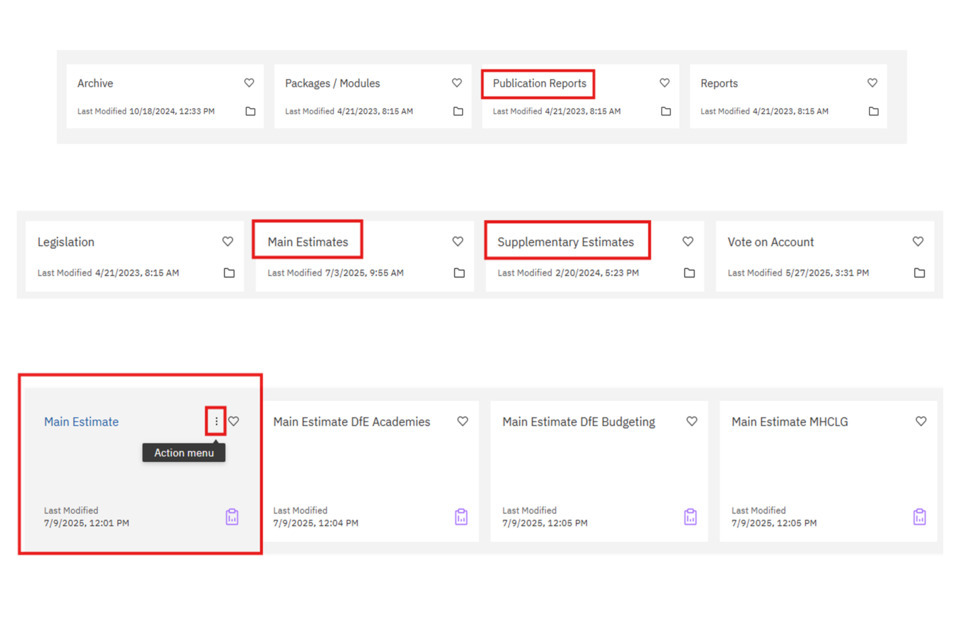
5) Hover over the Main Estimate (or Supplementary Estimate) box so that the ‘Action menu’ appears (three vertical dots). Click the Action menu, and click ‘Run as’ as shown above.
6) Click on the ‘Excel’ option to run the report within Excel. Do not click the ‘Excel Data’ option, as this won’t return any figures. Next click ‘Run’ in the bottom right corner of the page.
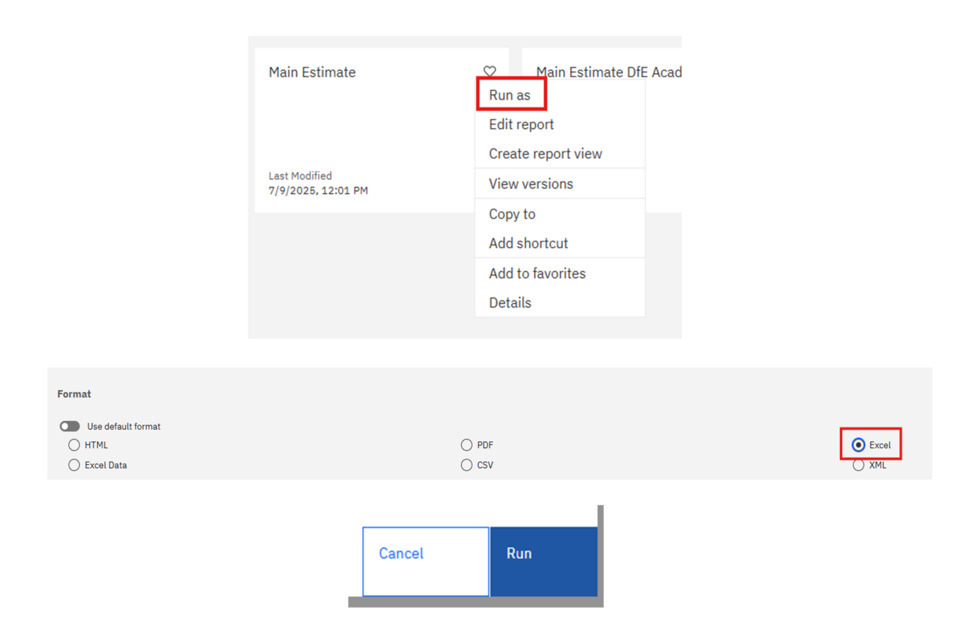
To note: other formats of running reports are available. For example, you can run to view the report in HTML to view it on screen, without downloading the report.
7) On the next page, a few different selections are required for the report.
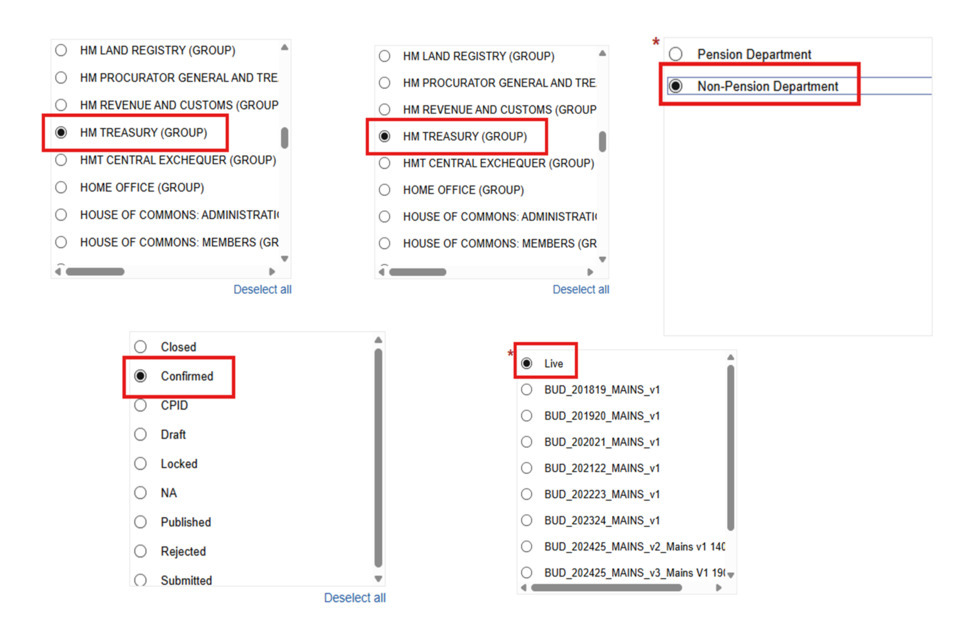
- In the first two boxes (top left and top centre), the Department you are looking to run the Estimate report for should be selected. Most users will only have one option, but users with multiple departments will be able to see a list of all departments they have access to. In this example HM Treasury is selected.
- In the top right box, there is a selection for a Pension or Non-Pension Department. All departments will be Non-Pension unless they are a pension estimate[footnote 1]. The pension option produces a different version of Note A.
- In the bottom left box, the status should be selected. Ordinarily this would be confirmed, to see the current data position. But other statuses such as locked or submitted will allow users to see where any unconfirmed data will display within reports. Note that the option for users to run reports with a combination of statuses is being considered.
- In the bottom right box, the version should be selected. If the report is being run based on Live data, ‘Live’ should be selected. However, there are options for snapshots which will show Main Estimate or Supplementary Estimate reports for previous years.
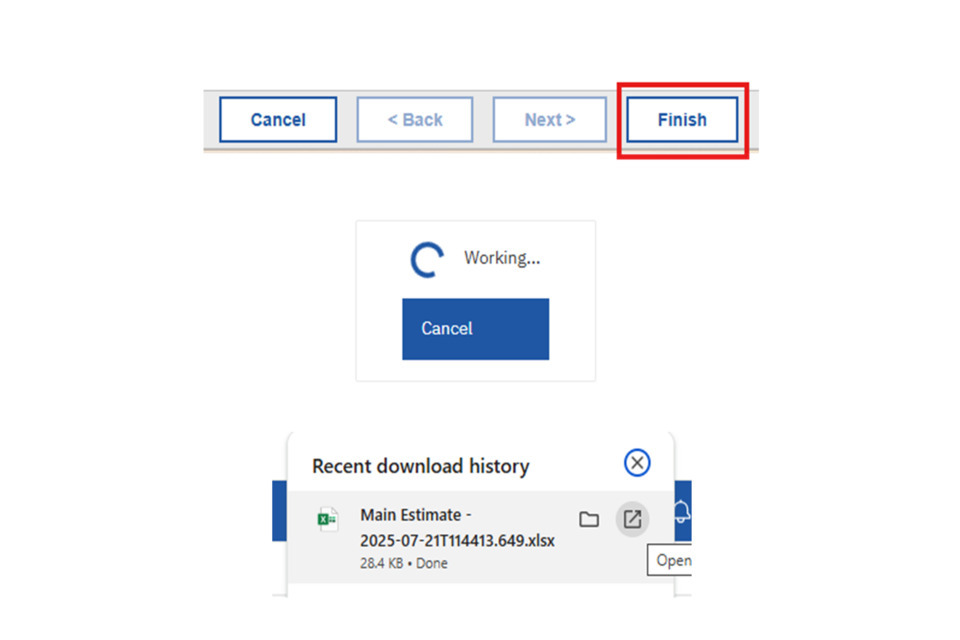
8) When all selections have been made, click Finish (shown in the bottom bar to the left). A pop-up will appear to show that the report is running. Once completed, the report should download in Excel within your browser.
10) Within the estimate report, the first tab will show information about the report, such as the user who ran it, the date and time it was run, and the options for the version and the department.
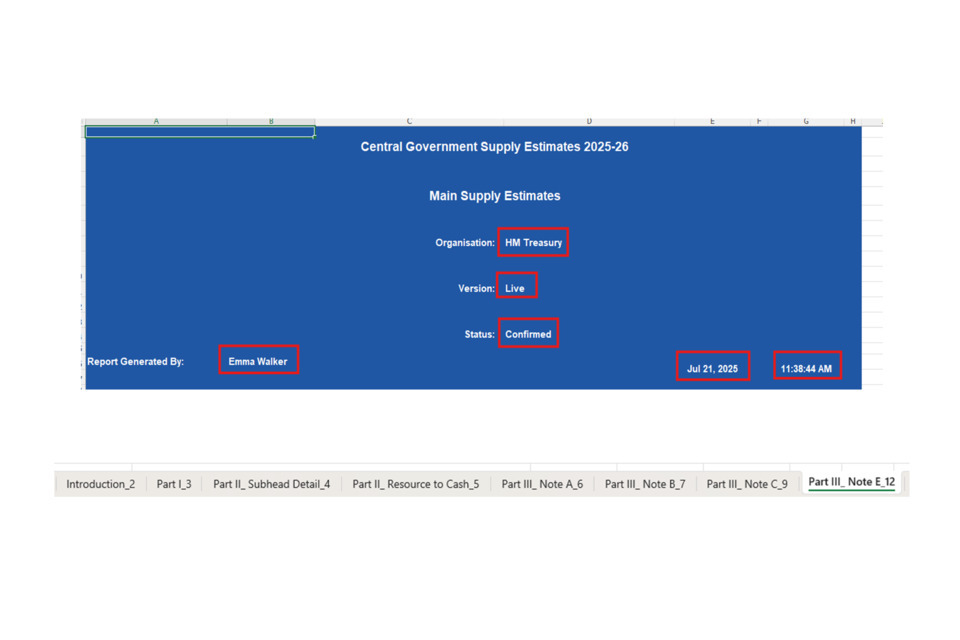
The above image shows the tabs which will contain data within the estimates reports:
- Part I
- Part II Subhead Detail (Main Estimates only)
- Part II Changes Proposed (Supplementary Estimates only)
- Part II Revised Subhead Detail (Supplementary Estimates only)
- Part II Resource to Cash table
- Part III Note A (SoCNE)
- Part III Note B (Income)
- Part III Note C (CFERs)
- Part III Note E (ALBs)
There are additional tabs that will just show text/remain empty. If there is no data available for any of the above tabs, the table will be empty/show no data.
Reports can be re-run to show any updates as adjustments are loaded to OSCAR.
-
Armed Forces Pension Scheme, Cabinet Office: Civil Superannuation, Foreign, Commonwealth and Development Office: Overseas Superannuation, Ministry of Justice: Judicial Pension Scheme, National Health Service Pension Scheme, Royal Mail Statutory Pension Scheme, Teachers’ Pension Scheme (England and Wales), and United Kingdom Atomic Energy Authority Pension Schemes. ↩