Older people’s hospital admissions in the last year of life
Published 25 February 2020

© Crown copyright 2020
This publication is licensed under the terms of the Open Government Licence v3.0 except where otherwise stated. To view this licence, visit nationalarchives.gov.uk/doc/open-government-licence/version/3 or write to the Information Policy Team, The National Archives, Kew, London TW9 4DU, or email: psi@nationalarchives.gov.uk.
Where we have identified any third party copyright information you will need to obtain permission from the copyright holders concerned.
This publication is available at https://www.gov.uk/government/publications/older-peoples-hospital-admissions-in-the-last-year-of-life/older-peoples-hospital-admissions-in-the-last-year-of-life
1. Introduction
The analysis of hospital admissions and how these vary amongst people in their last year of life can give a better understanding of their requirements for palliative and end of life care.
The NHS is seeking to minimise the number and length of hospital admissions for all age groups in the coming years, as part of the NHS Long Term Plan. In particular, the NHS aims to reduce avoidable hospital admissions and increase the level of care provided in the community for older people towards the end of life.
This report explores the relationship between hospital admissions and age, sex, cause of death in people aged 75 years and older, who comprise the majority (~69%) of all people who die. The hospital admissions considered include emergency admissions, planned admissions and day cases. It describes:
- number and type of admissions
- proportion of admissions that were emergency admissions within 30 days of a previous discharge
2. Main findings
Principle findings in this report include:
- there were 817,714 hospital admissions during the last year of life for the 341,621 people aged 75 years and older who died in 2017 (69% of all deaths)
- these admissions involve a total of 7.5 million days in hospital
- just under a quarter of admissions and just over two-fifths of days spent in hospital in people aged 75 years and older occurred during their last year of life
- 81% of people aged 75 years and older had at least one hospital admission in their last year of life and 96% of these people had at least one emergency admission
- during the last year of life, 71.8% of hospital admissions were emergency admissions and 89.7% of the days spent in hospital were after an emergency admission
- among people aged 75 years and older with any admission in their last year of life:
- a third have a single admission
- 16% have 5 or more admissions
- 15% spent for 2 days or less in hospital
- 34% spent over 4 weeks in hospital
3. Hospital admissions for people aged 75 years and older in the last year of life
In England in 2017, there were 16.6 million hospital admissions for people of any age (Figure 1). Of these, 3.5 million (22.2%) were amongst people aged 75 years and older, despite this age group only representing 8.2% of the population. There were a total of 0.8 million admissions for people aged 75 years and older in the last year of life. These admissions accounted for 23.7% of all admissions for people aged 75 years and older, and 5.0% of all admissions of people of any age.
7.5 million days were spent in hospital in 2017 for people aged 75 years and older in their last year of life, accounting for 41.1% of all days spent in hospital for people aged 75 years and older, and 17.2% of days for people of any age. People age 75 years and older had longer stays than younger age groups.
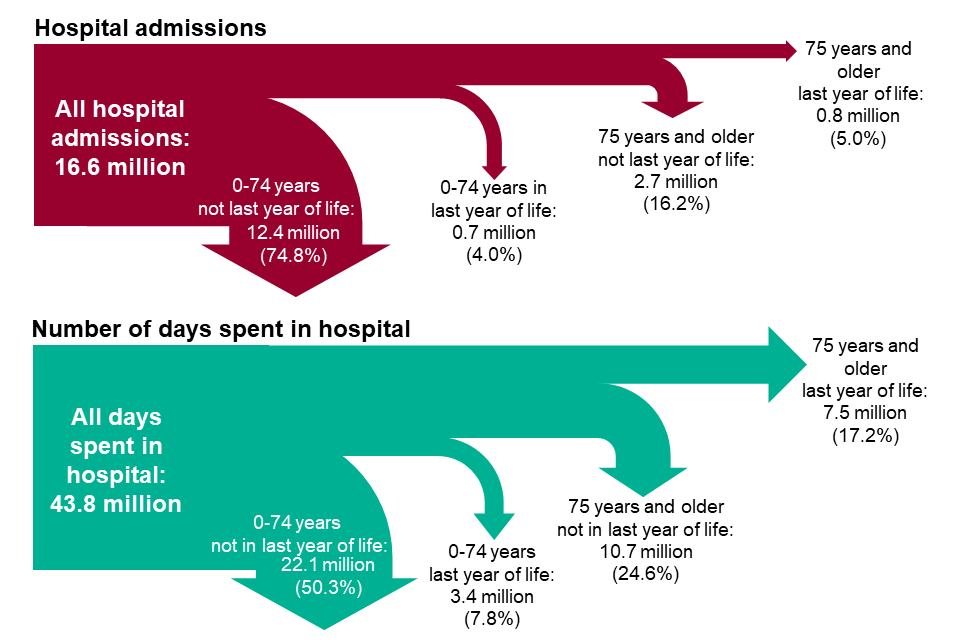
Figure 1: proportion of all hospital admissions and days spent in hospital in 2017 that were amongst people aged 75 years and older in the last year of life (excluding admissions and days spent in hospital by regular attenders).
4. Number of hospital admissions and total number of days spent in hospital in the last year of life
341,621 people aged 75 years and older died in 2017, 80.8% (276,191) of these people had at least one hospital admission during their last year of life for example, approximately one-fifth (19.2%) died without ever having been admitted to hospital during the last year of life.
Table 1 is a description of last year admissions by type of admission; it includes figures for people who have at least one admission, by type of admission. People can be included in more than one of these totals if they had admissions of more than one type in their last year of life, so the total of percentages of people with a day case, emergency, and planned admissions add to greater than 100%.
The proportion of people who died having been admitted to hospital at least once in the last year was lower for women (146,999 people, 77.5% of 189,668 deaths) than for men (129,192 people, 85.0% of 151,953 deaths).
Table 1: Summary of hospital admissions for people in the last year of life and who died aged 75 years or older in England, 2017.
| Admission type | People (admitted at least once) | People as a % of all 342,621 deaths | People as a % of the 276,191 seen in hospital | Number of admissions | Admissions as % of all admissions | Days spent in hospital | Days as a % of all days in hospital |
|---|---|---|---|---|---|---|---|
| Any admissions | 276,191 | 80.8 | 100.0 | 817,714 | 100.0 | 7,512,544 | 100.0 |
| No admission | 66,430 | 19.2 | - | - | - | - | - |
| Day case | 63,502 | 18.6 | 23.0 | 173,503 | 21.2 | 3,236 | 0.0 |
| Emergency | 264,932 | 77.6 | 95.9 | 587,094 | 71.8 | 6,738,587 | 89.7 |
| Planned | 41,655 | 12.2 | 15.1 | 57,117 | 7.0 | 770,721 | 10.3 |
Almost all the people admitted to hospital had at least one emergency admission (95.9%, 77.6% of all deaths), about a quarter (23.0%) had at least one day case admission and about 1 in 6 (15.1%) had at least one planned admission.
The total number of admissions varied by age and sex (Figure 2 top left panel). Amongst people 75 to 89 years of age, men had the greatest number of hospital admissions. However, for people aged 90 years and older, women represented most of hospital admissions. This can partly be explained by the higher proportion of women who live to older ages and die in the oldest age group.
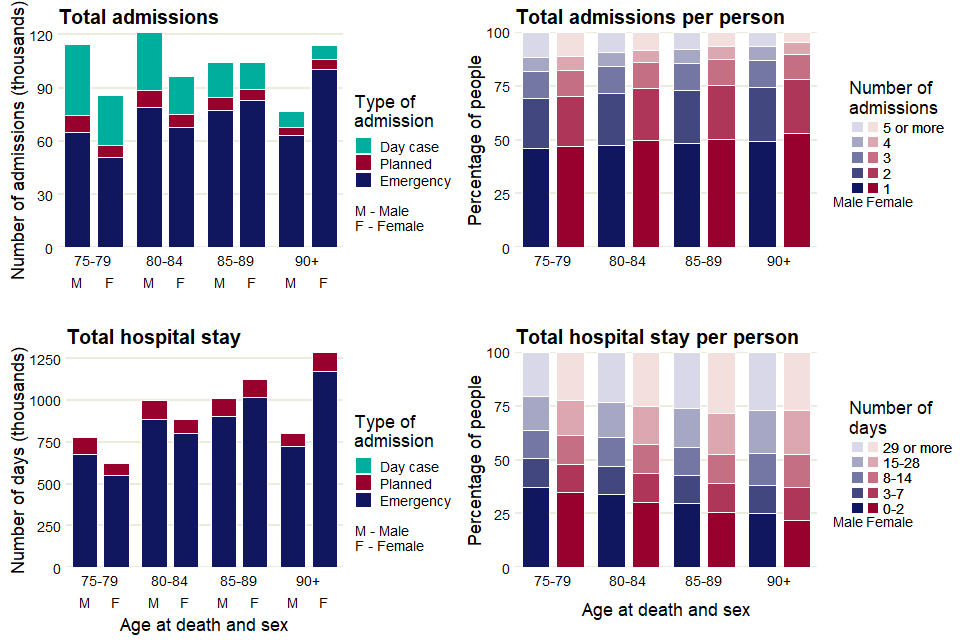
Figure 2: number of hospital admissions and total number of days spent in hospital in the year preceding death, and variation in number of admissions and number of days spent in hospital per person admitted, by age and sex, for people aged 75 years and older who died in England in 2017.
The proportion of admissions that are emergency admissions, on average 71.8% of all admissions, is highest for the 90 years and older age group.
Day case admissions (planned admissions for a specific intervention) account for nearly a third of all admissions for those aged 75 to 79 years (females 32.9%, males 34.7%) but substantially less for those aged 90 years and older (females 7.1%, males 11.5%).
About half the people admitted to hospital has just a single admission (Figure 2 top right panel). The proportion of people with a single admission increases with age, from 46.3% for males and 46.9% for females for those ages 75 to 79 years to 49.3% for males and 53.2% for females for those aged 90 years or older. The percentage of people who have 5 or more admissions is lowest among the oldest people, those age 90 years or older (males 6.6%, females 4.8%) and highest among the youngest age group, 75 to 79 years (males 11.4%, females 11.2%). **
In general, the total number of days spent in hospital increased with age. This is due to the higher number of people dying in older age groups (Figure 2 bottom left panel). At ages 75 to 84, the majority of all days spent in hospital were for men, and the opposite was true for women aged 85 years and older. This is due to men dying at a younger age than women.
Nearly a third of those admitted into hospital had a total stay (in all their admissions in their last year of life) of 2 days or less (males 32.0%, females 27.3%). The bottom right panel in Figure 2 shows this proportion was highest for those aged 75 to 79 years (males 37.5%, females 35.1%) and lowest for the most elderly, 90 years or older (males 25.1%, females 22.1%). About a quarter (25.2%) of those admitted stayed in hospital for a total of 29 days or longer. Generally, this proportion increased with age and was higher for females than males, although the proportion was highest (28.2%) for females aged 85 to 89.
Amongst all people aged 75 years and older who died in 2017, people who died from cancer had the largest total number of admissions (266,214 admissions) in the last year of life (Figure 3 top panel); this was also the leading underlying cause of death amongst this age group.
Cancer (38.8%) and liver disease (28.8%) showed the highest proportion of day case admissions. For the other cause of death groups this proportion was between 5.8% and 18.8%. There was a substantial number of admissions for people who had an underlying or contributory cause of death of dementia (141,833 admissions) or chronic obstructive pulmonary disease (COPD) (101,222 admissions).
The largest total number of days spent in hospital (1,760,801 days) was in people who died from an underlying or contributory cause of death of dementia (Figure 3 bottom panel).
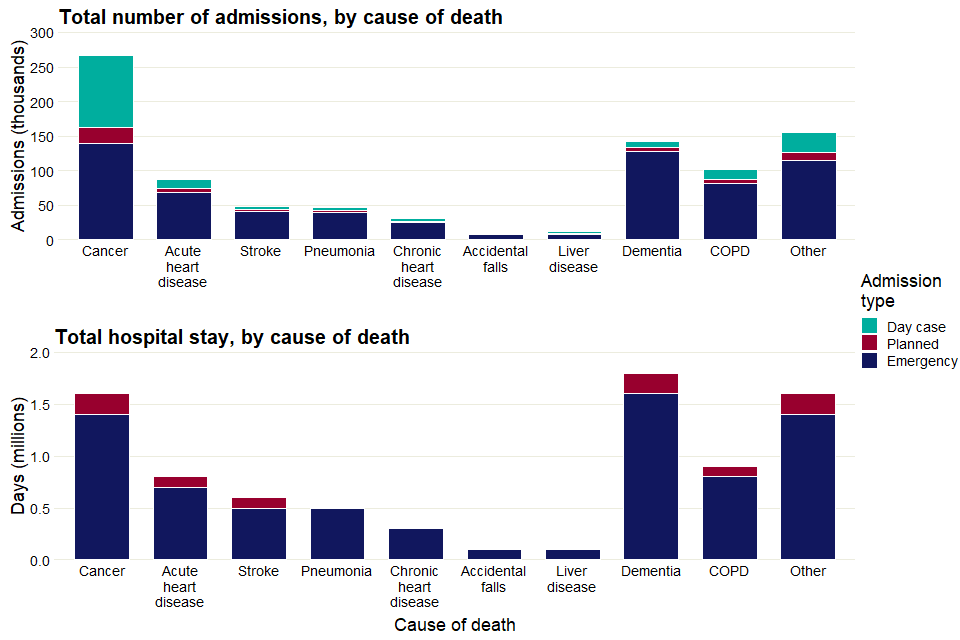
Figure 3: total number of hospital admissions and total number of days spent in hospital in the year preceding death by underlying cause of death (dementia and COPD groups defined by also including people with the condition as a contributory cause), people aged 75 years and older who died in England in 2017.
People who died from liver disease, cancer or COPD had the smallest proportion with only one admission (about a quarter in each case) and the largest proportion with 5 or more admissions (between a quarter and a fifth in each case, Figure 4 upper panel). The groups with the largest proportion with only a single admission was dementia (41.2%) and accidental falls (40.1%).
There is subtle variation between cause of death groups in the distribution of the total time each person stays in hospital (calculated as days in hospital per person with at least one hospital admission, Figure 4 (lower panel)). The proportion of people who were in hospital for 2 days or fewer is highest for acute heart disease (19.4%) and lowest for COPD and liver disease (both 11.9%). The cause of death groups with the highest proportion of total stays of 29 days or longer is stroke (37.7%) and chronic heart disease (36.8%), those with the lowest proportion were accidental falls (29.4%) and cancer (29.7%).
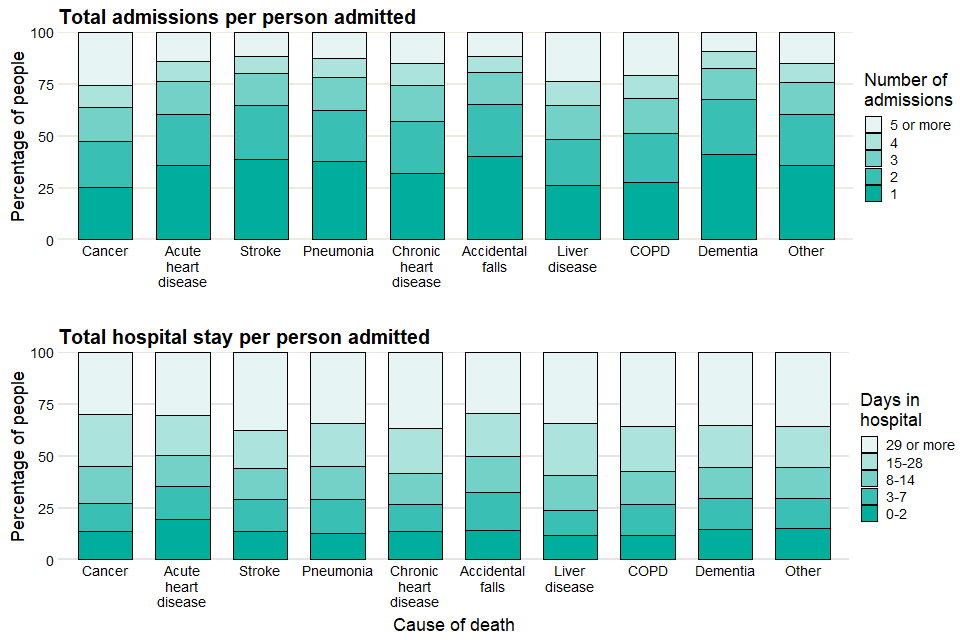
Figure 4: variation in number of hospital admissions and total number of days spent in hospital per person admitted in the year preceding death by underlying cause of death (dementia and COPD groups defined by also including people with the condition as a contributory cause), people aged 75 years and older who died in England in 2017.
5. Methods
Produced by Public Health England, adapted from data provided by:
- Hospital Episode Statistics (HES), NHS Digital © Copyright 2019, Re-used with the permission of NHS Digital. All rights reserved .
- Linked HES-ONS Mortality extract, Office for National Statistics (ONS) © Crown copyright 2019, NHS Digital © Copyright 2019, Re-used with the permission of NHS Digital. All rights reserved.
The principal cohort was identified as residents of England who died aged 75 years or older and whose death was registered in 2017 and who had at least one admission into hospital. These admissions will include planned, emergency and day cases. The analyses did not include hospital admissions categorised as regular attendances.
The cohort for the section “Hospital admissions for people aged 75 years and older in the last year of life” was defined differently, taking all the hospital admissions in 2017 (again not including those categorised as regular attendances) and using mortality records to identify those who were in the last year of life.
For each admission, the days in hospital was calculated as the difference between the date of discharge and the date of admission. In general each day case admission counts as zero days. Conceptually, the number of days in hospital can be thought of as the number of nights spent in hospital.
ICD (International Classification of Diseases) is the foundation for the identification of health trends and statistics globally, and the international standard for reporting diseases and health conditions.
These are the specific ICD-10 categories used to classify the following cause of death for this analysis (number of total deaths aged 75 or older in 2017 in brackets):
- cancer (74,112): C00-C97
- acute heart disease (AHD) (43,358): I20-I25, I39, I40-I41, I46-I49, I51
- stroke (23,742): I60-I69
- pneumonia (21,213): J12-J18
- chronic heart disease (CHD) (13,989): I05-I11, I13, I31, I34-I36, I38, I42, I50, I70, I95
- liver disease (3,685): B15-B19, K70-K77, C22
- accidental falls (4,192): W00 – W19
- dementia (87,199): F00-F04, G30-G31
- chronic obstructive pulmonary disease (COPD) (36,501): J40-J44
These categories include the most common causes of death in England in adults.
Deaths were counted in the dementia and COPD categories were counted if these conditions were recorded as underlying or contributory causes of death.
Deaths were counted in the pneumonia, cancer, chronic heart disease, acute heart disease, stroke and liver disease categories if these conditions were recorded as underlying cause of death. For this reason, some deaths may fall into multiple categories (for example, if a person’s underlying cause of death was cancer, but dementia was also a contributory cause of death).
Liver cancer (ICD code C22) is counted in both the liver disease and the cancer categories.
Deaths from ‘other’ causes are deaths which did not fall into any other category.
6. Other resources
PHE’s National End of Life Care Intelligence Network has published previous reports in this Palliative and end of life care report series:
- Death in people aged 75 years and older in England in 2017
- Palliative and end of life care: hospital deaths 2006 to 2017
- Older people who died in hospital: England 2017
PHE’s National End of Life Care Intelligence Network also develops Palliative and end of life care profiles, providing information on end of life care indicators for various geographies in England.
PHE’s Atlas of variation for palliative and end of life care allows users to explore local variations in death and end of life care, and is available either as a report, via the Atlas of Variation page on PHE Fingertips (available under the “Themed Atlases” subsection, published in 2018), or as an interactive Instant Atlas on NHS Rightcare.
Authors: Ursula Dalrymple, Ashley Makwana, Andy Pring, Nicola Bowtell, Julia Verne
For more information, please contact: neolcin@phe.gov.uk