Older people who died in hospital: England 2017
Published 11 October 2019

© Crown copyright 2019
This publication is licensed under the terms of the Open Government Licence v3.0 except where otherwise stated. To view this licence, visit nationalarchives.gov.uk/doc/open-government-licence/version/3 or write to the Information Policy Team, The National Archives, Kew, London TW9 4DU, or email: psi@nationalarchives.gov.uk.
Where we have identified any third party copyright information you will need to obtain permission from the copyright holders concerned.
This publication is available at https://www.gov.uk/government/publications/older-people-who-died-in-hospital-england-2017/older-people-who-died-in-hospital-england-2017
1. Introduction
In 2017, 230,428 people died in hospital (representing 46.2% of all deaths). Of all people dying in hospital, 155,899 (approximately two-thirds) were older people aged 75 years and older at the time of their death, reflecting the proportion of people who die aged 75 years and older in the general population.
Understanding the characteristics of people who die in hospital aids a better understanding of their requirements for end of life care, providing the opportunity for advance care planning. Although many people express a wish not to die in hospital, it is recognised that for some patients hospital is the correct place for care, particularly for patients who have an uncertain prognosis or symptoms that are difficult to manage.
The NHS is seeking to minimise the number and length of hospital admissions and increase care in the community for all age groups in the coming years, as part of the NHS Long Term Plan. Many of the planned changes will seek to reduce avoidable hospital admissions in older people, including through the establishment of acute frailty services, improvement of links between primary care networks and local care homes, and through improvement of the response to dementia and pneumonia, illnesses that disproportionately affect older people.
In this report, the number of older people who died in hospital in England in 2017 is investigated, and differences by age, sex, deprivation and cause of death are examined. Additionally, the length of hospital admissions ending in death is examined, to provide information on which groups of people have the shortest and longest admissions before death.
2. Main findings
45.6% of people aged 75 years and older died in hospital. This varied by demographic and cause of death as described below:
Age and sex
- a higher number of deaths occurred in hospital with increasing age, but the proportion of all deaths occurring in hospital decreased with increasing age
- a higher proportion of men than women died during an admission that lasted 8 days or longer, across all age groups
- males had a higher proportion of people with an admission ending in death that lasted 8 days or longer than women, across all age groups
Deprivation
- 50.3% of people from the most deprived areas died in hospital, compared with 43.9% of people from the least deprived
Cause of death
- the most common underlying cause of death for people aged 75 years and older who died in hospital in 2017 was cancer, followed by heart disease and pneumonia
- for most people aged 75 years and older who died in hospital, their underlying cause of death was not the same as the primary diagnosis at the point of admission to hospital in the hospital in which they died
- pneumonia and infections were recorded as the primary reason for admission in a large proportion of hospital admissions that ended in death (18.2% and 12.9% respectively)
Length of hospital admissions that ended in death
- 51.5% of people aged 75 years and older died in hospital during an admission lasting 8 days or longer
3. Number and proportion of deaths in hospital by age, sex and deprivation quintile
For women, the number of deaths in hospital in 2017 rose with age, from 13,267 deaths aged 75 to 79 years to 26,240 deaths aged 90 years and older. For men, the number of deaths in hospital peaked at ages 80 to 84 years at 20,981 deaths, in part reflecting the longer life expectancy for women compared to men. For both men and women, the proportion of all deaths that occurred in hospital decreased with age, although this decrease was more pronounced for women, which may be due to a higher proportion of women in the oldest age groups dying in care homes, as described in Death in people aged 75 years and older in England in 2017, a previous report from Public Health England. Across all age groups, a significantly lower proportion of women died in hospital than men (Z-test for proportional data, Z=-58.32, p=<0.01) The top row of graphics in Figure 1 shows the number and proportion of deaths that occurred in hospital by age and sex for people aged 75 years and older who died in 2017.
Social inequality is an important factor in determining whether people die in hospital. In terms of raw numbers of deaths, a higher number of people from each of the middle deprivation quintiles died in hospital (31,889, 33,632, and 32,765 in quintiles 2, 3 and 4 respectively) than quintile 1 (the most deprived quintile; 27,366 deaths) or quintile 5 (the least deprived quintile; 30,133 deaths). This reflects the lower overall number of deaths in people aged 75 years and older in the most and least deprived quintiles in 2017 as described in a Death in people aged 75 years and older in England in 2017, a previous report from Public Health England. When considered instead as the proportion of all deaths within the quintile, the proportion of deaths that occurred in hospital was highest in people from the most deprived quintiles, and decreased with decreasing deprivation, with the most and least deprived quintiles significantly different from one another (Z-test for proportional data, Z=-22.29, p=<0.01). The bottom row of graphics in Figure 1 shows the number and proportion of deaths that occurred in hospital by deprivation quintile for people aged 75 years and older who died in 2017.
Figure 1: Number of and proportion of deaths in hospital amongst people aged 75 years and older in England in 2017, by age, sex, and deprivation quintile

Number of and proportion of deaths in hospital amongst people aged 75 years and older in England in 2017, by age, sex, and deprivation quintile
4. Number of people who died in hospital by cause of death and by reason for admission to hospital
Cause of death is an important determinant of whether or not a person dies in hospital. Cause of death can be combined with the primary reason for admission during the hospital admission in which a person dies in order to understand more about people who die in hospital.
In this section, deaths are reported using the underlying cause of death only. Deaths from a diverse range of other causes collectively contributed to the largest category of death for people aged 75 years and older who died in hospital in 2017. Amongst the underlying causes of death listed in this analysis, cancer was the most common, followed by deaths acute heart disease, and pneumonia. For many deaths, the underlying cause of death was the same as the diagnosis at the point of admission, although the only cause of death where the same admission diagnosis constituted the majority of deaths was stroke.
Pneumonia represented a large proportion of diagnoses at the point of admission across all causes of death, as did infections. Amongst people who died in hospital from acute heart disease, 17.4% of people had a primary diagnosis of chronic heart disease at the point of admission.
Figure 2 below shows the number of deaths in hospital in 2017 amongst people aged 75 years and older, categorised by underlying cause of death. Deaths from each cause are further subdivided by the primary diagnosis at the point of admission to hospital during the hospital stay in which the person died.
Figure 2: Number of deaths in hospital amongst people aged 75 years and older in England in 2017, by underlying cause of death, categorised by primary diagnosis at point of admission to hospital

Number of deaths in hospital amongst people aged 75 years and older in England in 2017, by underlying cause of death, categorised by primary diagnosis at point of admission to hospita
Amongst the specific causes of death investigated in this report, pneumonia was the most common primary reason for admission amongst hospital spells ending in death, representing 26,110 (18.2%) of all admissions ending in death. People who were admitted to hospital with a primary diagnosis at admission of cancer, acute heart disease, liver disease, stroke, dementia or chronic obstructive pulmonary disorder (COPD) who died in that admission frequently had the same underlying cause of death as their primary diagnosis at admission. People who were admitted with a primary cause for admission of chronic heart disease or pneumonia often had a different underlying cause of death recorded. Figure 3 shows the number of hospital admissions ending in death for people aged 75 years and older by primary reason for admission to hospital, where each bar is categorised by the underlying cause of death that was ultimately recorded on each person’s death certificate.
Figure 3: Number of hospital admissions ending in death for people aged 75 years and older in England in 2017, by primary reason for admission, categorised by underlying cause of death

Number of hospital admissions ending in death for people aged 75 years and older in England in 2017, by primary reason for admission, categorised by underlying cause of death
5. Length of hospital admissions ending in death for people aged 75 years and older who died in hospital in 2017
In 2017, there were 142,533 people aged 75 years and older who died in hospital for whom the length was known of their hospital admission that ended in death (representing 91.4% of all deaths in hospital in this age group, with most of the remaining deaths occurring in Accident & Emergency or assessment wards). Of these people:
- 40,796 (28.6%) died after a hospital admission lasting between 0 and 3 days
- 28,378 (19.9%) died after a hospital admission lasting between 4 and 7 days
- 73,359 (51.5%) died after a hospital admission lasting 8 days or longer
In this section and the next section, deaths from dementia and COPD were defined as people who died with either of these causes of death as an underlying or contributory cause of death, to reflect the importance of these 2 illnesses on end of life care for older people. All other causes of death were defined as underlying cause of death only. Cause of death was found to affect the length of hospital admissions that ended in death. Amongst people dying in hospital after an admission lasting between 0 and 3 days, the highest number of deaths were from the large number of causes included in the “other” category, and not one of the main groups we have used in this report. The second highest number of deaths was from dementia, followed by acute heart disease.
For people dying in hospital after an admission lasting 8 days or longer, the highest number of deaths was due to cancer, followed by other causes and dementia. The fact that many of these causes of death are the highest in all 3 categorisations of length of admission reflects the large number of people dying in hospital from these causes of death. The top panel of Figure 4 shows the number of hospital admissions ending in death by cause of death, separated by the length of the hospital admission.
The number of admissions ending in death that lasted between 0 and 3 days, 4 and 7 days and 8 days or longer also differed by age, sex and deprivation quintile, reflecting the number of admissions in different age and sex groups and different deprivation quintiles. The number of admissions ending in death by age and sex, separated length of hospital admission, can be found in the central panel of Figure 4, and the number of admissions ending in death by deprivation quintile, separated length of hospital admission, can be found in the bottom panel of Figure 4.
Figure 4: Number of people dying in hospital by length of final admission, separated by cause of death, age, sex, and deprivation

Number of people dying in hospital by length of final admission, separated by cause of death, age, sex, and deprivation
Hospital admissions that last 8 days or longer, ending in death, can be an indicator of unmet need for coordinated care plans for end of life care (including access to NHS Fast Track funding) allowing for discharge, if appropriate. There was some variation in the proportion of all admissions that were 8 days or longer, ending in death, by cause of death; there was a higher proportion amongst people who died of liver disease (65.5%) and external causes (53.6%) compared to other causes. Although there was not a large amount of variation in the proportion of admissions that were 8 days or longer, ending in death, by age, across all age groups, a slightly higher proportion of males who died in hospital had an admission that lasted 8 days or longer, ending in death, compared to females. There was limited variation by deprivation quintile. Figure 5 below shows the proportion of hospital admissions that lasted 8 days or longer, ending in death, amongst people aged 75 years and older by cause of death, age, sex, and deprivation quintile.
Figure 5: Proportion of hospital admissions lasting 8 days or longer ending in death amongst people aged 75 years and older by cause of death, age, sex, and deprivation quintile
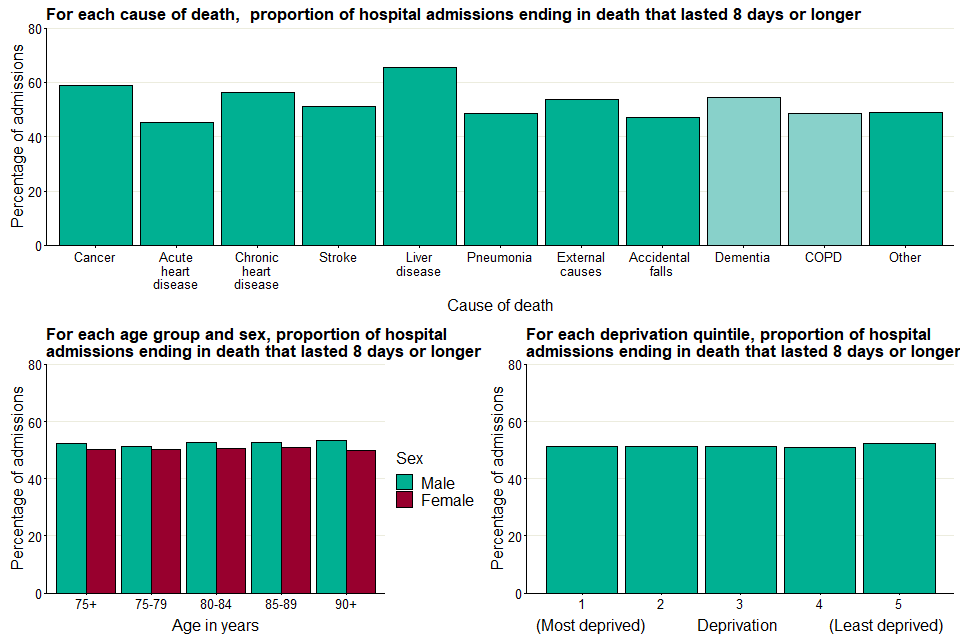
Proportion of hospital admissions lasting 8 days or longer ending in death amongst people aged 75 years and older by cause of death, age, sex, and deprivation quintile
6. Methods
In this report, NHS Hospital Episodes Statistics (HES) linked to the Office for National Statistics (ONS) mortality database was used to define the characteristics of hospital admissions ending in death for older people who died in hospital in 2017. Age at death was taken from the patient’s age in the HES hospital episode in which they died.
To report outcomes by deprivation quintile, Income Deprivation Affecting Older People Index (IDAOPI) was used to group people aged 75 and older who died in 2017 by deprivation quintiles. The IDAOPI ‘measures’ the proportion of people 60 years of age and older who receive means-tested benefits in small geographic areas known as Lower Super Output Areas (LSOAs). All LSOAs were ranked by IDAOPI score, and the ranks were used to generate equal-sized quintiles of deprivation, where quintile 1 represents the highest proportion of people receiving means-tested benefits (the most deprived), and quintile 5 represents the lowest (the least deprived). The deprivation quintile was extracted for the usual place of residence for each person aged 75 years and older who died in England in 2017, in order to measure the relationship between deprivation and deaths in hospital.
It is important to note that the deprivation quintile for each dying person is extracted from the deprivation quintile of their place of residence according to their death certificate. As such, if a person moved within their last year of life, they may also change deprivation quintile. Because the place of residence is not available for each admission during the last year of life, it was not possible to account for this potential source of bias. Additionally, the effect of deprivation on dying individuals may also be different depending place of death; people dying in care homes and hospices may be differently affected by local deprivation levels compared to people dying at home. This potential source of bias is also not addressed in this report.
In this report, a number of different causes of death are investigated. These causes were defined using the causes of death listed on each person’s death certificate. Deaths were categorised as having an underlying cause of cancer, acute heart disease, chronic heart disease, stroke, liver disease, pneumonia, external causes, accidental falls, dementia, or chronic obstructive pulmonary disorder (COPD). Deaths from ‘other’ causes were defined as deaths where the underlying cause was not any of the underlying causes listed above. Full details of disease groupings and International Classification of Diseases (ICD-10) codes used to establish each group are listed in the supporting data accompanying this report.
As well as investigating the number of deaths from each cause amongst admitted patients, the primary diagnosis at the point of admission for hospital admissions where the person died is also explored, using the ICD-10 code recorded in the primary diagnosis at the point of hospital admission. In addition to the code groups used for cause of death, a further set of diagnosis groups (blood diseases, digestive diseases, genitourinary diseases, infections, and injury or poisoning) were used to group diagnosis at admission. The ICD-10 codes for these additional groupings are listed in the Supporting Data accompanying this report.
7. Other resources
PHE’s National End of Life Care Intelligence Network has published previous reports in this palliative and end of life care report series, including Death in people aged 75 years and older in England in 2017 and Palliative and end of life care: hospital deaths 2006 to 2017.
PHE’s Atlas of variation for palliative and end of life care allows users to explore local variations in death and end of life care and is available either as a report, on the Atlas of Variation page on PHE Fingertips (available under the ‘Themed Atlases’ subsection, published in 2018), or as an interactive instant atlas on NHS Rightcare.
PHE’s Palliative and end of life care profiles provide information on end of life care indicators for various geographic areas in England.
Authors: Ursula Dalrymple, Ashley Makwana, Laura Potts, Andy Pring, Nicola Bowtell, Julia Verne
For more information, please contact: neolcin@phe.gov.uk