Annex B: a summary of analyses and evidence on the current NHS Health Check programme
Updated 9 December 2021
Applies to England

© Crown copyright 2021
This publication is licensed under the terms of the Open Government Licence v3.0 except where otherwise stated. To view this licence, visit nationalarchives.gov.uk/doc/open-government-licence/version/3 or write to the Information Policy Team, The National Archives, Kew, London TW9 4DU, or email: psi@nationalarchives.gov.uk.
Where we have identified any third party copyright information you will need to obtain permission from the copyright holders concerned.
This publication is available at https://www.gov.uk/government/publications/nhs-health-check-programme-review/annex-b-a-summary-of-analyses-and-evidence-on-the-current-nhs-health-check-programme
1. Summary
This is an annex to the report ‘Preventing illness and improving health for all: a review of the NHS Health Check programme and recommendations’. On 1 October 2021, responsibility for national oversight of the NHS Health Check programme and for publishing the findings of the review transitioned from Public Health England (PHE) to the Office for Health Improvement and Disparities (OHID).
This annex describes:
- how the current NHS Health Check is delivered
- the uptake, sociodemographic, socioeconomic, risk factor profiles of attendees and non-attendees
- interventions and health outcomes
- the factors influencing uptake, the completion of a check, and onward referral
- gaps in the evidence
This evidence was used to inform review issues 1, 4, 5, 6 and 7. The main findings from this work were as follows.
Review issue 1: the benefits and limitations of the current NHS Health Check
The NHS Health Check programme is broadly achieving what it originally set out to do. It has scaled a standardised check, and supported action to move the focus from illness to wellness across England – despite this significant variation remains between local authority areas in terms of offers, uptake and completions [footnote 1].
It has demonstrated that not only is a national prevention programme to tackle non-communicable disease possible but that it results in better recording of risk, disease detection and favourable rates of advice, referral and follow-on testing [footnote 2].
It has engaged individuals from more deprived black and ethnic minority groups – however, there is further work to be done to ensure that across all ethnic groups those in the most deprived decile engage with the programme.
Across all age groups, people who have attended an NHS Health Check tend to show better health outcomes compared to those that do not attend, even after a short follow-up period and among groups where low rates of heart attacks and strokes are expected.
Review issue 4: how the checks are delivered
Local authorities spent £48 million on commissioning NHS Health Checks in 2019 to 2020 [footnote 3]. By far the largest provider of checks is general practice (GPs). While some checks are offered by other providers, such as community pharmacists or outreach teams, these models can often be hampered by a lack of data on eligible people [footnote 4].
A range of technological solutions that support delivery are growing in popularity, for example, text message invitations, and bespoke IT systems to support and guide practitioners through the check. However, the use of digital solutions which enable users to self-complete the check has only been reported in one local authority [footnote 4].
Review issue 5: the potential for more personalised risk-focused approaches
Across all NHS Health Check attendees there are high levels of modifiable risk factors. The occurrence of those risk factors varies with ethnicity, gender and age. Data suggests that providers are tailoring current delivery by being more likely to offer: advice and referrals to younger people; tests and medication to older people; any follow-up intervention to black and ethnic minority groups known to be at higher risk of CVD than people from the white ethnic group; a referral to a behavioural intervention among attendees with the lowest socio-economic status; and a statin to an individual with a 10-year CVD risk score over 10%.
Using a 10-year assessment of CVD risk results in a low score among younger people with high levels of modifiable risk factors. While medical treatment such as statins may not be appropriate, there is a risk that younger people could be falsely reassured when their 10-year CVD risk is communicated to them. Communicating the lifetime risk instead could provide a more accurate picture of the individual’s potential chance of having a heart attack or stroke.
Providers most commonly prioritise invitations to an NHS Health Check by age [footnote 4]. As age has the greatest weighting within the 10-year CVD risk calculation this approach serves as a simple proxy for identifying the people who are likely to have the greatest clinical risk. However, this approach fails to recognise other important definitions of need such as deprivation, ethnicity and geography, which highlights an opportunity to consider how these factors might be used to improve prioritisation.
Review issue 6: improving uptake
There is an opportunity for improvement by reaching the 3 in 5 eligible people who currently do not attend their NHS Health Check and to apply the Marmot principle of ‘proportionate universalism’ – actions are universal, but with a scale and intensity that is proportionate to the level of disadvantage [footnote 5].
Knowledge, beliefs and perceptions, which can be as simple as not knowing about the programme and its value or as complex as anxiety about discovering a health condition, influence people’s decisions whether to take-up an invite [footnote 6].
How a person is invited, as well as when and where a check is delivered, can influence uptake. No one size fits all [footnote 6].
Review issue 7: improving follow-up
The practitioner’s beliefs – that the checks are beneficial, that they are capable of supporting behaviour change and that the individual will take action – all influence the extent to which they act to support behaviour change [footnote 6].
Structural factors, such as staff training, adequate time to deliver the check, effective computer systems to support delivery and the availability and capacity of funded services for practitioners to refer to, can act as a barrier to behaviour change [footnote 7].
For the individual, receiving information on their CVD risk from a credible and trusted messenger, having a family history of CVD, feeling supported by friends and family as well as believing that taking action will reduce their risk of CVD, can have a positive effect on behaviour change [footnote 7].
Other barriers to behaviour change include a poor understanding of the 10-year CVD risk score, pressure rather than help to change, a belief that genetic disposition drives behaviour, practical issues in taking up and sticking with interventions, access to services, cost and time [footnote 6] [footnote 7] [footnote 8].
2. Background
NHS Health Checks are a main component of locally led prevention and public health. They are offered to people without pre-existing disease aged between 40 and 74, free of charge, every 5 years. The results are used to raise awareness and support individuals to make behaviour changes and, where appropriate, access clinical management to help them reduce their risk of a heart attack, diabetes, stroke, respiratory disease and some forms of dementia and cancer in the next 10 years.
The government’s prevention green paper ‘Advancing our Health: Prevention in the 2020s’ recognised that the NHS Health Check, originally introduced in April 2009, has achieved a lot and continues to do so [footnote 9]. A national evaluation of the programme estimates that at current statin prescribing levels as a result of an NHS Health Check, over 5 years, 2,500 people will have avoided a major cardiovascular event, such as heart attack or stroke [footnote 10].
In their current form, checks also underpin important NHS Long Term Plan commitments geared to preventing 150,000 heart attacks, strokes and cases of dementia, and are the major conduit for recruitment to the Diabetes Prevention Programme [footnote 11].
However, the green paper also recognised significant variation in uptake and follow-up of the health risks identified by the programme, along with the potential that people could benefit from a more tailored service or a particular focus at pivotal changes in the life course. The government therefore announced its intention, building on the gains made over the past 10 years, to consider whether changes to the NHS Health Check programme could help it deliver even greater benefits.
To achieve this, the Department of Health and Social Care (DHSC) commissioned PHE to undertake an evidence-based review of how NHS Health Checks can evolve in the next decade to maximise the future benefits of the programme.
This is an annex to the report ‘Preventing illness and improving health for all: a review of the NHS Health Check programme and recommendations’. On 1 October 2021, responsibility for national oversight of the NHS Health Check programme and for publishing the findings of the review transitioned from PHE to OHID.
This annex describes how the current NHS Health Check is delivered; the uptake, sociodemographic, socioeconomic, risk factor profiles of attendees and non-attendees; interventions and health outcomes; the factors influencing uptake, the completion of a check, and onward referral; and gaps in the evidence. This evidence was used to inform review issues 1, 4, 5, 6 and 7.
3. Method
Data and evidence were identified and gathered from sources published or accessed during the review period (July 2020 to June 2021), that were specific to the NHS Health Check programme, and where possible summarised existing evidence. They included:
- a PHE analysis of local authority self-reported NHS Health Check delivery models [footnote 4]
- a PHE co-authored NHS Health Check analysis of GP data on more than 12 million patient records from England between 2012 and 2018 [footnote 2]
- a PHE analysis of the GP data and linking to hospital episode statistics
- data reported by local authorities on NHS Health Check invites and completions, and published by PHE on the Public Health Outcomes Framework [footnote 1]
- data reported by local government on the use of the public health grant [footnote 3]
- a PHE commissioned update to a rapid evidence review [footnote 6]
- a systematic evidence review on the influences of NHS Health Check behaviour [footnote 7]
The information from these sources were used to inform review issues 1, 4, 5, 6, 7 and 8 by describing:
- how the NHS Health Check is currently delivered and funded
- the proportion of eligible people being invited to and attending a check
- the factors influencing attendance, completion and follow-up
- the risk factor profile of attendees and non-attendees
- patterns in attendance and interventions by age, sex, ethnicity and deprivation
- the health outputs and outcomes achieved among attendees
- how different CVD risk assessment tools compare in their identification of people who are at risk of CVD
4. Results
4.1 Offers and attendance
Between 2015 and 2020 an estimated 15.7 million people were eligible for an NHS Health Check. Over that time, 88% of eligible people were invited and 47% took up the offer [footnote 1]. Overall, 41% of eligible people had a check during those 5 years.
Figure A shows the number of people offered and number taking up an NHS Health Check by year between 2011 to 2012 and 2019 to 2020. It illustrates that both offers and take up increased year-on-year from 2011 to 2012 peaking in 2014. It also shows that while the number of offers remained consistent between the 4 years of 2016 to 2017 and 2019 to 2020 the proportion of people that took up an offer gradually declined from 49.9% to 43.7%.
Figure A: NHS Health Checks offered and taken up 2011 to 2020 [footnote 1]
| Financial year | Number of people offered a check | Number of people having a check (take-up %) |
|---|---|---|
| 2011 to 2012 | 2,220,257 | 1,136,224 (51.2%) |
| 2012 to 2013 | 2,572,471 | 1,262,618 (49.1%) |
| 2013 to 2014 | 2,819,665 | 1,382,864 (49.0%) |
| 2014 to 2015 | 3,042,478 | 1,485,339 (48.8%) |
| 2015 to 2016 | 2,930,375 | 1,403,686 (47.9)% |
| 2016 to 2017 | 2,621,917 | 1,308,512 (49.9%) |
| 2017 to 2018 | 2,679,660 | 1,284,563 (47.9%) |
| 2018 to 2019 | 2,741,294 | 1,258,940 (45.9%) |
| 2019 to 2020 | 2,768,114 | 1,210,389 (43.7%) |
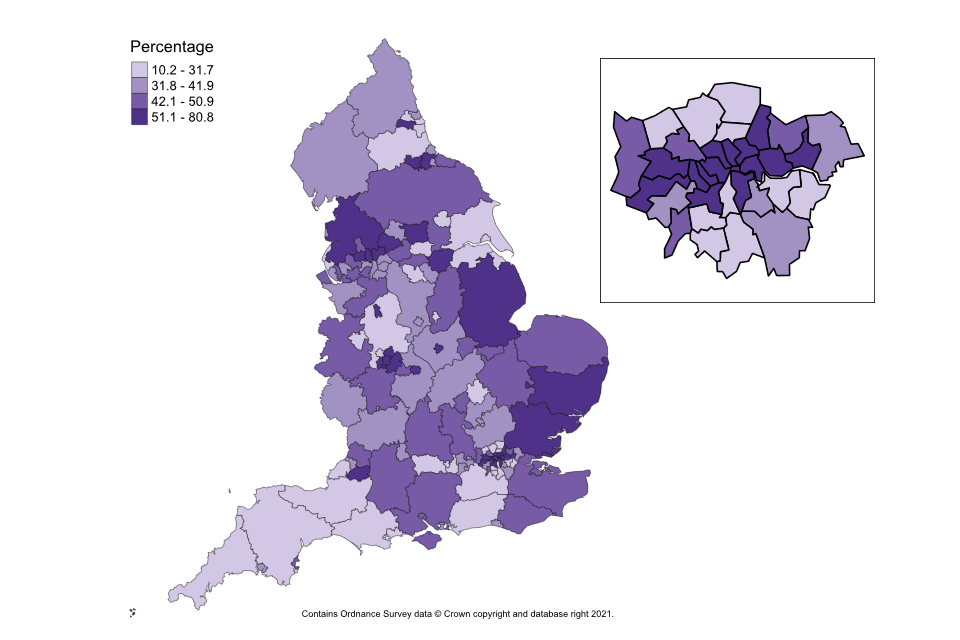
Across different local authorities, the proportion of people completing an NHS Health Check varied from 10% to 80% [footnote 1]. Figure B is a map of England broken into local authority areas to show the proportion of people completing an NHS Health Check between 2015 and 2020. It shows whether a local authority is in one of the 4 following categories: 10.2 to 31.7%, 31.8% to 41.9%, 42.1% to 50.9% or 51.1% to 80.8%. Detailed data for figure B is presented in Appendix 1.
Figure B: variation in the proportion of eligible people having an NHS Health Check by local authority between 2015 to 2016 and 2019 to 2020 [footnote 1]
The likelihood of attending an NHS Health Check increases with age. It is also higher for women, the most affluent [footnote 2] and non-smokers [footnote 6]. Attendance is broadly representative of the general population across ethnic groups. However, across all ethnic groups people in the most deprived 10th of the population are less likely to attend [footnote 2].
Other groups that experience greater health needs, such as people with learning disability or serious mental illness, have slightly higher adjusted odds of attending than people without these conditions [footnote 2]. People with a diagnosis of dementia were considerably less likely to attend [footnote 2].
4.2 Providing the checks
Local authorities spent £48 million on NHS Health Checks in 2019 to 2020, down from a peak of £63 million in 2014 to 2015 [footnote 3].
Responses to the 2019 to 2020 NHS Health Check Delivery Survey show that GP surgeries deliver most checks: 93% of local authorities commissioned GPs to deliver at least some checks and 57% commissioned only GPs [4]. Other important providers are community outreach services, which work directly with people in local facilities or their own homes, and community pharmacies [footnote 4].
The most common method to identify eligible people is the GP clinical patient record system: 87% of GP providers use it. Other providers use it much less (8% community outreach, 14% pharmacy) as they can only identify eligible people this way if GP practices do it for them [footnote 4]. The next most common method for identifying people is opportunistically, as non-GP providers lack access to data on eligible people [footnote 4].
Providers are most likely to prioritise people by age. Providers also prioritise by CVD risk (based on the information available to them), sociodemographic characteristics or whether they have had a previous check [footnote 4].
The most common method of invitation is a letter: 44% of local authorities use the current PHE template; a further 29% use a locally adapted version [footnote 4]. Text messages are used by 11% of local authorities [footnote 4].
Most providers (58%) are paid by the number of checks they complete. Others are paid a fixed amount (13%), by performance based on a target population group (11%) or by performance based on the number of offers and invites (11%) [footnote 4]. Most GPs (61%) and pharmacies (80%) are paid based on activity. The most common payment approach for community outreach services is a fixed payment (44%) [footnote 4].
In 2019 to 2020, over 80% of local authorities reported using digital technology to support the NHS Health Check in some way. This included using digital templates to guide practitioners during the check; delivering online training to providers; and sending text message prompts or reminders to people invited to a check. Despite this, only one local authority reported offering people a digital option for a self-completed check. [footnote 4]
4.3 Factors influencing uptake
Uptake is affected by people’s knowledge, beliefs and perceptions [footnote 7]. This can be as simple as not understanding much about the NHS Health Check and its value [footnote 7]. Or it can be more complex, such as the anxiety some people might feel at the prospect of discovering they have a high-risk of disease. Another barrier can be the feeling that there is no benefit to the detection of disease [footnote 7]. However, people can be more likely to attend if they believe a check is an opportunity to be reassured about their health or take positive action [footnote 7]. Studies show that the uptake of invitations to an NHS Health Check can be affected by the way people are invited and how the service is delivered [footnote 6].
Different ways of inviting people – by phone or when they are at a GP surgery for another reason – have increased uptake, as have text message prompts and reminders [footnote 6]. Conversely, when checks are not at a GP surgery, a lack of data-sharing can make it difficult for providers to identify eligible people, which limits invitations [footnote 7].
The timing and location of provision has an important role to play. Only offering checks during ‘office hours’ and involving more than one appointment, serve as barriers to uptake [footnote 6]. Offering a mixture of locations, providers and times can help to reduce these barriers, as the evidence shows that one size does not fit all [footnote 7].
4.4 Risk factors
People who attend an NHS Health Check have much more detailed information in their GP patient records on the risk factors associated with CVD – cholesterol, blood pressure, obesity, physical activity, alcohol and smoking [footnote 2]. Data shows that between April 2012 and March 2017 the level of recording for physical activity and alcohol consumption was not as high as other risk factors [footnote 2]. This was because these 2 components were first introduced in 2013, so recording increased each year as they became an established part of the NHS Health Check (as shown in figures C and D).
Figure C illustrates the proportion of NHS Health Check attendees identified as having, not having or where data is missing for: high cholesterol, high blood pressure, obesity, low physical activity, smoker, family history of CVD, alcohol consumption above low risk levels, possible diabetes and high 10-year risk of CVD. Risk thresholds are described in Appendix 2.
It shows that across all NHS Health Check attendees there are high levels of overweight and obesity, abnormal total cholesterol, physical inactivity, smoking and high blood pressure [footnote 2]. Where information was recorded, two thirds of checks identify abnormal cholesterol, a quarter high blood pressure, a quarter obesity and a sixth that someone is a smoker [footnote 2].
Figure C: proportion of attendees with risk factor information recorded in GP patient record, 2012 to 2017 [footnote 2]
| Risk factor | Yes | No | Missing | Total |
|---|---|---|---|---|
| Alcohol | 2.40% | 35.90% | 61.70% | 100% |
| Possible diabetes | 1.60% | 48.20% | 50.10% | 100% |
| High blood pressure | 24.50% | 71.30% | 4.30% | 100% |
| Obesity | 23.80% | 72.50% | 3.70% | 100% |
| High cholesterol | 64.70% | 29.80% | 5.50% | 100% |
| CVD 10-year risk score | 20.60% | 59.10% | 20.30% | 100% |
| Family history of CVD | 3.80% | 96.20% | 0 (0%) | 100% |
| Physical activity | 21.70% | 42.80% | 35.50% | 100% |
| Smoking | 16% | 79.70% | 4.30% | 100% |
Figure D illustrates the proportion of NHS Health Check non-attendees identified as having, not having or where data is missing for: high cholesterol, high blood pressure, obesity, low physical activity, smoker, family history of CVD, alcohol consumption above low risk levels, possible diabetes and high 10-year risk of CVD. Risk thresholds are described in Appendix 2.
It shows that recording of risk factors was very low for non-attendees, particularly for physical activity and alcohol risk.
Figure D: proportion of non-attendees with risk-factor information recorded in GP patient record, 2012 to 2017 [footnote 2]
| Risk factor | Yes | No | Missing | Total |
|---|---|---|---|---|
| Alcohol | 1.2% | 15.6% | 83.3% | 100% |
| Possible diabetes | 2.5% | 41.1% | 56.4% | 100% |
| High blood pressure | 24.0% | 52.4% | 23.7% | 100% |
| Obesity | 16.8% | 38.2% | 45.0% | 100% |
| High cholesterol | 35.0% | 15.2% | 49.8% | 100% |
| CVD 10-year risk score | 9.0% | 21.3% | 69.6% | 100% |
| Family history of CVD | 0.7% | 99.3% | 0 (0%) | 100% |
| Physical activity | 5.4% | 8.5% | 86.1% | 100% |
| Smoking | 21.1% | 50.6% | 28.2% | 100% |
Even in areas with high rates of recording, evidence suggests that not all risk data is collected in full. The possible reasons for this are time constraints and practitioners lacking the confidence to complete the assessment or discuss behaviour change with attendees [footnote 12].
Figure E shows the ranking of 8 CVD risk factors for 40 to 74 year olds attending an NHS Health Check by 5-year age groups. Each column represents a 5-year age group starting at 40, each row represents the ranking with 1 being the most and 8 the least common. The CVD risks included are: body mass index of 25 or more (high BMI), low physical activity (low PA), high blood pressure (high BP), high total cholesterol (high TC), current smoker (smoker), diabetes risk (diabetes), alcohol consumption (alcohol) and family history of CVD (fam hist CVD). Risk thresholds are described in Appendix 2.
Data shows that the occurrence of risk factors changes with increasing age. For example, abnormal cholesterol and blood pressure is more common in older groups whereas overweight, obesity and physical inactivity rank higher in younger groups.
Figure E: ranked prevalence of risk factors among attendees by age group, 2012 to 2017 [footnote 13]
| Rank | 40 to 44 | 45 to 49 | 50 to 54 | 55 to 59 | 60 to 64 | 65 to 69 | 70 to 74 |
|---|---|---|---|---|---|---|---|
| 1 most common | High BMI | High BMI | High BMI | High TC | High TC | High TC | High BP |
| 2 | Low PA | Low PA | High TC | High BMI | High BP | High BP | Low PA |
| 3 | High BP | High TC | Low PA | High BP | Low PA | Low PA | High TC |
| 4 | High TC | High BP | High BP | Low PA | High BMI | High BMI | High BMI |
| 5 | Smoker | Smoker | Smoker | Diabetes | Diabetes | Diabetes | Diabetes |
| 6 | Diabetes | Diabetes | Diabetes | Smoker | Smoker | Smoker | Smoker |
| 7 | Alcohol | Alcohol | Alcohol | Alcohol | Alcohol | Alcohol | Alcohol |
| 8 least common | Fam hist CVD | Fam hist CVD | Fam hist CVD | Fam hist CVD | Fam hist CVD | Fam hist CVD | Fam hist CVD |
Figure F shows the ranking of 8 CVD risk factors for 40 to 74-year olds attending an NHS Health Check by ethnic group. Each column represents one of the following ethnic groups: white, Bangladeshi, Indian, Pakistani, Chinese, other Asian, black African, black Caribbean and other mixed. Each row represents the ranking with 1 being the most and 8 the least common. The CVD risks included are: body mass index of 25 or more (high BMI), low physical activity (low PA), high blood pressure (high BP), high total cholesterol (high TC), current smoker (smoker), diabetes risk (diabetes), alcohol consumption (alcohol) and family history of CVD (fam hist CVD). Risk thresholds are described in Appendix 2.
Data shows the burden that different risk factors place on an individual’s health also varies across ethnic groups, for example diabetes risk is higher in all Asian and Black ethnic groups. Conversely alcohol risk was lower in those groups than in white ethnic groups.
Figure F: ranked risk factor prevalence among attendees, by ethnic group, 2012 to 2017 [footnote 14]
| Rank | White | Bangladeshi | Indian | Pakistani | Chinese | Other Asian | Black African | Black Caribbean | Other/mixed |
|---|---|---|---|---|---|---|---|---|---|
| 1 most common | High TC | Low PA | Low PA | Low PA | Low PA | Low PA | High BMI | High BMI | Low PA |
| 2 | High BMI | High BMI | High BMI | High BMI | High TC | High BMI | Low PA | Low PA | High BMI |
| 3 | Low PA | High TC | High TC | High BP | High BP | High TC | High BP | High BP | High TC |
| 4 | High BP | High BP | High BP | High TC | High BMI | High BP | High TC | High TC | High BP |
| 5 | Smoker | Diabetes | Diabetes | Diabetes | Diabetes | Diabetes | Diabetes | Diabetes | Diabetes |
| 6 | Diabetes | Smoker | Smoker | Smoker | Smoker | Smoker | Smoker | Smoker | Smoker |
| 7 | Alcohol | Fam hist CVD | Fam hist CVD | Fam hist CVD | Fam hist CVD | Fam hist CVD | Fam hist CVD | Alcohol | Fam hist CVD |
| 8 least common | Fam hist CVD | Alcohol | Alcohol | Alcohol | Alcohol | Alcohol | Alcohol | Fam hist CVD | Alcohol |
Figure G shows the number of NHS Health Check attendees between 2012 and 2017 where either 1, 2, 3 or 4 or more modifiable risk factors were identified. The figure shows that about 95% of people attending an NHS Health Check have one or more abnormal modifiable risk factors for CVD, and about 78% have 2 or more [footnote 13]. Risk thresholds are described in Appendix 2.
Figure G: number of modifiable risk factors among NHS Health Check attendees, 2012 to 2017 [footnote 13]
| Number of risk factors | Number of attendees |
|---|---|
| 0 | 273,926 |
| 1 | 838,366 |
| 2 | 1,431,535 |
| 3 | 1,515,641 |
| 4 or more | 1,043,290 |
Figure H shows the proportion of NHS Health Check attendees, by deprivation decile (where 1 is most and 10 least deprived). Colour coding is used to indicate the proportion of people that have 0, 1, 2 or 3 or more risk factors within each deprivation decile. The figure illustrates that the number of risk factors increases with age and deprivation. People in the most deprived decile are more likely to have multiple abnormal risk factors than people in the least. Risk thresholds are described in Appendix 2.
Figure H: number of risk factors by deprivation [footnote 14]
| Deprivation decile | No risk factors | 1 risk factor | 2 risk factors | 3 risk factors or more | Total |
|---|---|---|---|---|---|
| Most deprived | 11 | 29.1 | 32.2 | 27.9 | 100% |
| 2 | 13 | 31.1 | 31.2 | 24.7 | 100% |
| 3 | 13.9 | 32.8 | 30.7 | 22.6 | 100% |
| 4 | 14.7 | 34 | 30 | 21.3 | 100% |
| 5 | 15.4 | 35.2 | 29.6 | 19.8 | 100% |
| 6 | 16.3 | 36.4 | 28.9 | 18.4 | 100% |
| 7 | 16.7 | 37.2 | 28.6 | 17.6 | 100% |
| 8 | 17.5 | 37.9 | 28 | 16.6 | 100% |
| 9 | 18 | 38.5 | 27.7 | 15.7 | 100% |
| Least deprived | 19.2 | 40.2 | 26.8 | 13.8 | 100% |
| Unknown | 20 | 50 | 10 | 20 | 100% |
In a quarter of NHS Health Checks someone is found to have a risk of 10% or more of a significant CVD event in the next 10 years, such as a heart attack or stroke [footnote 2]. This is the threshold for considering medication to reduce the risk. NHS Health Checks are also more likely to detect a 10-year CVD risk of 20% or higher in people from the most deprived 10th of the population.
4.5 Outputs
Among NHS Health Check attendees, over 81% benefit from an offer of behaviour advice, referral, prescription or a test, compared to 38% among non-attendees [footnote 2].
The type of intervention offered after a check differs according to need:
- older people are more likely to be offered further tests and medication; younger people are more likely to be offered advice and a referral
- Bangladeshi and black African groups were more likely to be offered all types of intervention than the white ethnic group [footnote 14]
- across all attendees, more than half (57.8%) of offered referrals are declined. People who are older, wealthier and from white or Chinese ethnic groups are more likely to decline interventions
The more deprived the background of a person attending an NHS Health Check, the more likely they are to receive a referral for smoking, alcohol, physical activity or weight [footnote 13]. Among people with the same CVD risk, black, Asian and other ethnic groups are more likely to receive advice, referral, prescriptions or tests than those in white ethnic groups.
Statin prescription was mostly, but not always, based on calculated 10-year CVD risk. People found to have a 10-year CVD risk of 10% or more are 3 times more likely to be prescribed a statin than those who don’t have that risk [footnote 13]. Given the same risk, people in more deprived groups and certain ethnic groups are more likely to receive a prescription for a statin [footnote 13].
4.6 Factors influencing follow-up
The belief that NHS Health Checks are beneficial in terms of preventative healthcare and that appropriately framed messages are important are recognised among healthcare professionals as influencing their delivery of the check. Believing in their own capability and a sense of optimism that a patient will change their behaviour after a NHS Health Check are also important in influencing whether a healthcare professional takes action to support behaviour change [footnote 7].
Healthcare professionals recognise that training on how to communicate risk and support behaviour change is a facilitator [footnote 7]. In 2019 to 2020 most local authorities provided support to ensure staff competence, largely via the national e-learning service and bespoke programmes. Other influencing factors include the practitioner having enough time to deliver the check and an effective computer system [footnote 6]. The lack of funded specialist services for practitioners to refer patients to was highlighted as a barrier for making referrals following an NHS Health Check [footnote 6].
Receiving information on CVD risk from a professional, as a trusted messenger, act as a facilitator for people [footnote 7]. However, if a healthcare professional is unable to explain risk, this has a knock-on effect for the patient’s knowledge, and can be a barrier to triggering behaviour change [footnote 6].
Other barriers to people’s behaviour change include pressure rather than help to change from practitioners, a belief that genetic disposition drives behaviour, practical issues in taking up and sticking with interventions, their social context, access to services, cost and time [footnote 6] [footnote 7].
Family history affects how likely people are to change their behaviour after a check: they feel more able to change when supported by family and friends. They are more likely to attend a follow-on service if they believe it will help to reduce their risk of CVD [footnote 6] [footnote 7]. A belief that they are capable of achieving the behaviour change is also an important facilitator. Conversely, fatalistic health beliefs or a mismatch between national guidelines and what a person believes – for example, they may believe that binge drinking is not harmful if done infrequently – can be a barrier to change [footnote 7].
4.7 Outcomes
Six years after attending an NHS Health Check people have, on average, reduced average BMI, smoking, blood pressure and total cholesterol. The changes in these risk factors help to reduce their overall average CVD risk [footnote 6].
Figure I shows the adjusted odds ratio of an NHS Health Check attendee for CVD hospital admission, type 2 diabetes admission, CVD death and all-cause mortality 5 years after an NHS Health Check compared to non-attendees. The data illustrates that people who have attended an NHS Health Check tend to show better health outcomes, even over a short follow-up period in a group where low event rates are expected. This was apparent at all ages. Compared to people who have not attended, they have significantly lower likelihood of hospital admissions for CVD and type 2 diabetes, death from CVD, and all causes of death over one, 3 and 5 years after attending a check [footnote 15].
Figure I: adjusted odds ratio for hospital admissions and death among NHS Health Check attendees compared to non-attendees, 2012 to 2018 [footnote 15]
| Hospital admissions and deaths | 5 years after NHS Health Check | No NHS Health Check |
|---|---|---|
| CVD hospital admission | 0.8 | 1 |
| Type 2 diabetes hospital admission | 0.53 | 1 |
| CVD death | 0.54 | 1 |
| All-cause death | 0.53 | 1 |
4.8 The role of CVD risk
Data shows that a 10-year assessment of CVD risk is heavily weighted by a person’s age – the older they are, the higher their 10-year CVD risk (figure J). This has the potential to skew follow-up support to older age groups, when it is exposure over a lifetime that drives CVD risk. Supporting younger people with a high lifetime risk but low 10-year risk to make changes early could help to realise the preventative vision of the NHS Health Check.
Figure J shows the number of people in each 5-year age band between 40 and 74 who are either at high 10-year CVD risk or have a low 10-year CVD risk but high lifetime CVD risk or a low 10-year CVD risk and low lifetime CVD risk. The figure shows that older people are more likely to have a high 10-year risk. Very few younger people have a high 10-year risk but half of them have a high lifetime risk.
Figure J: NHS Health Check attendees’ 10-year and lifetime CVD risk by age [footnote 14]
| Age group | Low 10-year risk and low lifetime risk | Low 10-year risk and high lifetime risk | High 10-year risk | Total |
|---|---|---|---|---|
| 40 to 44 | 376,334 | 373,783 | 10,810 | 760,927 |
| 45 to 49 | 368,456 | 350,739 | 33,096 | 752,291 |
| 50 to 54 | 359,028 | 311,144 | 82,832 | 753,004 |
| 55 to 59 | 268,845 | 191,311 | 157,501 | 617,657 |
| 60 to 64 | 176,462 | 88,755 | 258,864 | 524,081 |
| 65 to 69 | 82,798 | 19,193 | 354,356 | 456,347 |
| 70 to 74 | 3,603 | 117 | 122,959 | 126,679 |
5. Conclusion
Issue 1: the benefits and limitations of the current NHS Health Check
The NHS Health Check programme is broadly achieving what it originally set out to do. It has scaled a standardised check, and supported action to move the focus from illness to wellness across England. Despite this significant variation remains between local authority areas in terms of offers, uptake and completions [footnote 1].
It has demonstrated that not only is a national prevention programme to tackle non-communicable disease possible but that it results in better recording of risk, disease detection and favourable rates of advice, referral and follow-on testing [footnote 2].
It has engaged individuals from more deprived black and ethnic minority groups. However, there is further work to be done to ensure that across all ethnic groups those in the 10th most deprived decile engage with the programme.
Across all age groups, people who have attended an NHS Health Check tend to show better health outcomes even after a short follow-up period and among groups where low rates of heart attacks and strokes are expected.
Issue 4: how the checks are delivered
Local authorities spent £48 million on commissioning NHS Health Checks in 2019 to 2020. By far the largest provider of checks currently are GPs. While some checks are offered by other providers, such as community pharmacists or outreach teams, these models can often be hampered by a lack of data on eligible people [footnote 4].
A range of technological solutions that support delivery are growing in popularity, for example, text message invitations, and bespoke IT systems to support and guide practitioners through the check. However, the use of digital solutions which enable users to self-complete the check has only been reported in one local authority [footnote 4].
Issue 5: the potential for more personalised risk-focused approaches
Across all NHS Health Check attendees there are high levels of modifiable risk factors. The occurrence of those risk factors varies with ethnicity, gender and age. Data suggests that providers are tailoring current delivery by being more likely to offer: advice and referrals to younger people; tests and medication to older people; any follow-up intervention to black and ethnic minority groups known to be at higher risk of CVD than people from the white ethnic group; a referral to a behavioural intervention among attendees with the lowest socio-economic status; and a statin to an individual with a 10-year CVD risk score over 10%.
Using a 10-year assessment of CVD risk results in a low score among younger people with high levels of modifiable risk factors. While medical treatment such as statins may not be appropriate, there is a risk that younger people could be falsely reassured when their 10-year CVD risk is communicated to them. Communicating the lifetime risk instead could provide a more accurate picture of the individual’s potential chance of having a heart attack or stroke.
Providers most commonly prioritise invitations to an NHS Health Check by age [footnote 4]. As age has the greatest weighting within the 10-year CVD risk calculation this approach serves as a simple proxy for identifying the people who are likely to have the greatest clinical risk. However, this approach fails to recognise other important definitions of need such as deprivation, ethnicity and geography, which highlights an opportunity to consider how these factors might be used to improve prioritisation.
Issue 6: improving uptake
There is an opportunity for improvement by reaching the 3 in 5 eligible people who currently do not attend their NHS Health Check and to apply the Marmot principle of ‘proportionate universalism’ in doing so [footnote 5].
Knowledge, beliefs and perceptions, which can be as simple as not knowing about the programme and its value or as complex as anxiety about discovering a health condition, influence people’s decisions whether to take-up an invite [footnote 6].
How a person is invited, as well as when and where a check is delivered, can influence uptake – no one size fits all [footnote 6].
Issue 7: improving follow-up
The practitioner’s beliefs – that the checks are beneficial, that they are capable of supporting behaviour change and that the individual will take action – all influence the extent to which they act to support behaviour change [footnote 6]. Structural factors, such as staff training, adequate time to deliver the check, effective computer systems to support delivery and the availability and capacity of funded services for practitioners to refer to, can act as a barrier to behaviour change [footnote 7].
For the individual, receiving information on their CVD risk from a credible and trusted messenger, having a family history of CVD, feeling supported by friends and family as well as believing that taking action will reduce their risk of CVD, can have a positive effect on behaviour change [footnote 7].
Other barriers to behaviour change include a poor understanding of the 10-year CVD risk score, pressure rather than help to change, a belief that genetic disposition drives behaviour, practical issues in taking up and sticking with interventions, access to services, cost and time. [footnote 6] [footnote 7] [footnote 8].
Limitations
PHE had to deliver the review rapidly, which limited its ability to commission new evidence and fully analyse all the NHS Health Check data. Existing data sources which have been used within this annex have various limitations, each of which is detailed in the corresponding papers.
Appendix 1: map data
Variation in the proportion of eligible people having a NHS Health Check by local authority between 2015 to 2016 and 2019 to 2020.
| Area name | % of eligible people receiving an NHS Health Check, 2015 to 2016 Q1 – 2019 to 2020 Q4 |
|---|---|
| England | 41.3 |
| East Midlands region | 42.9 |
| East of England region | 46.0 |
| London region | 45.2 |
| North East region | 35.9 |
| North West region | 47.2 |
| South East region | 38.9 |
| South West region | 31.3 |
| West Midlands region | 42.9 |
| Yorkshire and the Humber region | 36.2 |
| Derby | 32.3 |
| Derbyshire | 39.9 |
| Leicester | 52.6 |
| Leicestershire | 41.8 |
| Lincolnshire | 58.8 |
| Northamptonshire | 40.1 |
| Nottingham | 22.5 |
| Nottinghamshire | 43.0 |
| Rutland | 44.5 |
| Bedford | 30.2 |
| Cambridgeshire | 43.1 |
| Central Bedfordshire | 41.0 |
| Essex | 52.6 |
| Hertfordshire | 39.5 |
| Luton | 41.0 |
| Norfolk | 42.8 |
| Peterborough | 43.4 |
| Southend-on-Sea | 51.2 |
| Suffolk | 54.7 |
| Thurrock | 50.2 |
| Barking and Dagenham | 57.8 |
| Barnet | 30.9 |
| Bexley | 26.4 |
| Brent | 42.5 |
| Bromley | 41.0 |
| Camden | 55.5 |
| City of London | 57.3 |
| Croydon | 18.1 |
| Ealing | 68.0 |
| Enfield | 22.5 |
| Greenwich | 29.5 |
| Hackney | 65.5 |
| Hammersmith and Fulham | 63.9 |
| Haringey | 28.3 |
| Harrow | 20.0 |
| Havering | 33.3 |
| Hillingdon | 43.6 |
| Hounslow | 74.4 |
| Islington | 67.3 |
| Kensington and Chelsea | 59.6 |
| Kingston upon Thames | 47.7 |
| Lambeth | 29.6 |
| Lewisham | 38.8 |
| Merton | 29.1 |
| Newham | 72.4 |
| Redbridge | 48.4 |
| Richmond upon Thames | 38.4 |
| Southwark | 59.4 |
| Sutton | 25.8 |
| Tower Hamlets | 78.2 |
| Waltham Forest | 52.8 |
| Wandsworth | 58.6 |
| Westminster | 80.8 |
| County Durham | 31.7 |
| Darlington | 52.4 |
| Gateshead | 53.3 |
| Hartlepool | 37.1 |
| Middlesbrough | 41.0 |
| Newcastle upon Tyne | 19.6 |
| North Tyneside | 34.0 |
| Northumberland | 35.8 |
| Redcar and Cleveland | 45.9 |
| South Tyneside | 29.9 |
| Stockton-on-Tees | 51.4 |
| Sunderland | 26.0 |
| Blackburn with Darwen | 50.9 |
| Blackpool | 35.3 |
| Bolton | 79.6 |
| Bury | 77.7 |
| Cheshire East | 45.7 |
| Cheshire West and Chester | 34.7 |
| Cumbria | 39.3 |
| Halton | 47.5 |
| Knowsley | 46.2 |
| Lancashire | 67.7 |
| Liverpool | 35.0 |
| Manchester | 38.5 |
| Oldham | 36.2 |
| Rochdale | 64.7 |
| Salford | 34.8 |
| Sefton | 21.4 |
| St. Helens | 36.2 |
| Stockport | 35.1 |
| Tameside | 33.2 |
| Trafford | 46.1 |
| Warrington | 45.8 |
| Wigan | 45.0 |
| Wirral | 46.7 |
| Bracknell Forest | 32.2 |
| Brighton and Hove | 40.5 |
| Buckinghamshire | 42.5 |
| East Sussex | 49.5 |
| Hampshire | 49.5 |
| Isle of Wight | 44.9 |
| Kent | 43.2 |
| Medway | 42.3 |
| Milton Keynes | 44.8 |
| Oxfordshire | 49.3 |
| Portsmouth | 35.2 |
| Reading | 23.8 |
| Slough | 34.2 |
| Southampton | 43.7 |
| Surrey | 20.8 |
| West Berkshire | 24.7 |
| West Sussex | 28.8 |
| Windsor and Maidenhead | 32.7 |
| Wokingham | 19.8 |
| Bath and North East Somerset | 60.4 |
| Bournemouth, Christchurch and Poole | 15.4 |
| Bristol | 37.2 |
| Cornwall | 18.7 |
| Devon | 25.8 |
| Dorset | 29.6 |
| Gloucestershire | 34.2 |
| Isles of Scilly | 72.3 |
| North Somerset | 21.7 |
| Plymouth | 37.5 |
| Somerset | 25.3 |
| South Gloucestershire | 42.1 |
| Swindon | 41.9 |
| Torbay | 42.3 |
| Wiltshire | 45.9 |
| Birmingham | 54.5 |
| Coventry | 51.3 |
| Dudley | 69.1 |
| Herefordshire | 40.8 |
| Sandwell | 53.6 |
| Shropshire | 45.6 |
| Solihull | 48.8 |
| Staffordshire | 19.9 |
| Stoke-on-Trent | 52.4 |
| Telford and Wrekin | 23.0 |
| Walsall | 54.3 |
| Warwickshire | 31.8 |
| Wolverhampton | 28.5 |
| Worcestershire | 48.2 |
| Barnsley | 47.1 |
| Bradford | 36.0 |
| Calderdale | 51.4 |
| Doncaster | 53.2 |
| East Riding of Yorkshire | 10.2 |
| Kingston upon Hull | 21.7 |
| Kirklees | 43.8 |
| Leeds | 51.1 |
| North East Lincolnshire | 18.2 |
| North Lincolnshire | 24.6 |
| North Yorkshire | 45.2 |
| Rotherham | 34.6 |
| Sheffield | 26.9 |
| Wakefield | 25.8 |
| York | 15.4 |
Appendix 2: risk thresholds
The thresholds used for categorising risk factors varies for figures within the annex depending on the source of the information. The following table describes the thresholds that were used for each of the CVD risk factors for each of the figures:
- general practice physical activity questionnaire (GPPAQ)
- glycated haemoglobin (HbA1c)
- fasting plasma glucose (FPG)
- alcohol use disorders identification test (AUDIT)
- total cholesterol (TC )
- high density lipoprotein (HDL)
- systolic blood pressure (SBP)
- diastolic blood pressure (DBP)
- body mass index (BMI)
- cardiovascular disease (CVD)
| Risk factor | Proportion of attendees (Figure C) and non-attendees (Figure D) with risk factor information recorded in GP patient record (source: footnote 2) | Ranked prevalence of risk factors among attendees by age group (Figure E) and by ethnic group (Figure F) (source: footnote 13) | Number of modifiable risk factors among NHS Health Check attendees (Figure G) (source: footnote 13) | Number of risks factors by deprivation (Figure H) (source: footnote 2) |
|---|---|---|---|---|
| High smoking risk | Current smoker | Current smoker | Current smoker | Current smoker |
| High physical activity risk | GPPAQ score: moderately inactive or inactive | GPPAQ score: physically inactive, moderately inactive or moderately active | GPPAQ score: physically inactive, moderately inactive or moderately active | GPPAQ score: moderately inactive or inactive |
| High diabetes risk | HbA1c >= 48 mmol/mol or FPG >= 7mmol/L | HbA1c >= 42 mmol/mol or FPG >= 5.5 mmol/L | HbA1c >= 42 mmol/mol or FPG >= 5.5 mmol/L | HbA1c >= 48 mmol/mol or FPG >= 7mmol/L |
| High alcohol risk | AUDIT score >= 8 | AUDIT score >= 8 | AUDIT score >= 8 | AUDIT score >= 8 |
| High cholesterol | TC >5mmol/L or ratio TC/HDL >4 | TC >=5mmol/L | TC >=5mmol/L | TC >5mmol/L or ratio TC/HDL >4 |
| High blood pressure | SBP >= 140mmHg or DBP >= 90mmHg | SBP >= 130mmHg or DBP >= 80mmHg | SBP >= 130mmHg or DBP >= 80mmHg | SBP >= 140mmHg or DBP >= 90mmHg |
| High BMI | BMI>= 30 (obese) | BMI >= 25 (overweight) | BMI >= 25 (overweight) | BMI >= 30 (obese) |
| High family history of CVD | High if there is family history of CVD | High if there is family history of CVD | not included | High if there is family history of CVD |
| 10-year risk score | 10% or more | not included | not included | not included |
-
Public Health England. ‘NHS Health Check’ (accessed 10 June 2021) ↩ ↩2 ↩3 ↩4 ↩5 ↩6 ↩7
-
Patel R, Barnard S, Thompson K and others. ‘Evaluation of the uptake and delivery of the NHS Health Check programme in England, using primary care data from 9.5 million people: a cross-sectional study.’ BMJ Open 2020: volume 10, issue 11 (accessed 10 June 2021) ↩ ↩2 ↩3 ↩4 ↩5 ↩6 ↩7 ↩8 ↩9 ↩10 ↩11 ↩12 ↩13 ↩14 ↩15
-
Ministry of Housing, Communities and Local Government. ‘National Statistics: Local authority revenue expenditure and financing England: 2019 to 2020 individual local authority data – outturn.’ 2021 (accessed 10 June 2021) ↩ ↩2 ↩3
-
Public Health England. ‘NHS Health Check delivery model survey.’ 2021 (accessed 9 June 2021) ↩ ↩2 ↩3 ↩4 ↩5 ↩6 ↩7 ↩8 ↩9 ↩10 ↩11 ↩12 ↩13 ↩14 ↩15 ↩16
-
Marmot, M. ‘Fair society, healthy lives : the Marmot Review : strategic review of health inequalities in England post-2010.’ 2010 (accessed 12 August 2021) ↩ ↩2
-
Tanner L, Kenny RPW, Still M, Pearson F and Bhardwaj-Gosling F. ‘NHS Health Check Programme Rapid Review Update.’ University of Sunderland and Newcastle University 2020. (accessed 9 June 2021) ↩ ↩2 ↩3 ↩4 ↩5 ↩6 ↩7 ↩8 ↩9 ↩10 ↩11 ↩12 ↩13 ↩14 ↩15 ↩16 ↩17 ↩18 ↩19
-
Atkins L, Stefanidou C, Chadborn T, Thompson K, Michie S, Lorencatt F. ‘Influences on NHS Health Check behaviours: a systematic review.’ BMC Public Health 2020: article number 1359 (accessed 9 June 2021) ↩ ↩2 ↩3 ↩4 ↩5 ↩6 ↩7 ↩8 ↩9 ↩10 ↩11 ↩12 ↩13 ↩14 ↩15 ↩16 ↩17 ↩18 ↩19
-
Hobbs FDR, Jukema JW, Da Silva PM, McCormack T, Catapano AL. ‘Barriers to cardiovascular disease risk scoring and primary prevention in Europe.’ The International Journal of Medicine 2010: volume 103, issue 10, pages 727-739 (accessed 9 June 2021) ↩ ↩2
-
Department of Health and Social Care. ‘Advancing our health: prevention in the 2020s.’ 2019 (accessed 9 June 2021) ↩
-
Robson J, Dostal I, Sheikh A and others. ‘The NHS Health Check in England: an evaluation of the first 4 years (PDF, 1MB).’ BMJ Open 2016: volume 6, issue 1 (accessed 12 August 2021) ↩
-
National Health Service (NHS). ‘The NHS long term plan.’ 2019 (accessed 9 June 2021) ↩
-
Gidlow C, Riley V. ‘NHS Health Checks: An Analysis of Physical Activities and Alcohol Consumption Measurements.’ Staffordshire University 2021 (accessed 9 June 2021) ↩
-
Patel R, Barnard S and others. ‘Moving from cardiovascular risk assessment to altering risk trajectories: Opportunities revealed by the NHS Health Check programme.’ (unpublished) ↩ ↩2 ↩3 ↩4 ↩5 ↩6
-
Patel R, Barnard S and others. ‘Addressing Inequalities invitation, attendance, risk and intervention through the NHS Health Check programme.’ (unpublished) ↩ ↩2 ↩3 ↩4
-
Patel R, Barnard S and others. ‘A longitudinal study of the impacts of the NHS Health Check programme; disease detection and outcomes.’ (unpublished) ↩ ↩2