NCARDRS statistics 2018: summary report
Updated 29 September 2021

© Crown copyright 2021
This publication is licensed under the terms of the Open Government Licence v3.0 except where otherwise stated. To view this licence, visit nationalarchives.gov.uk/doc/open-government-licence/version/3 or write to the Information Policy Team, The National Archives, Kew, London TW9 4DU, or email: psi@nationalarchives.gov.uk.
Where we have identified any third party copyright information you will need to obtain permission from the copyright holders concerned.
This publication is available at https://www.gov.uk/government/publications/ncardrs-congenital-anomaly-annual-data/ncardrs-statistics-2018-summary-report
If you have read the congenital anomaly statistics report, we would greatly appreciate your feedback. It will help us understand how the report is being used and how to improve it. Please fill in this anonymous survey.
This document summarises the National Congenital Anomaly and Rare Disease Registration Service (NCARDRS) congenital anomaly statistics 2018 report.
It is the fourth annual congenital anomaly statistics report released by NCARDRS and the first report to contain national data for the whole of England. The report contains information on congenital anomalies detected in babies delivered between 1 January and 31 December 2018.
1. About NCARDRS
NCARDRS is a comprehensive registration service that collects and quality assures data on congenital anomalies and rare diseases in England.
NCARDRS is made up of 10 regions. Seven regions have been conducting congenital anomaly registration for some time. The three new regions covering the East of England, London and the South East, and the North West were established and started data collection from 1 April 2017.
In 2018, NCARDRS achieved its goal of national data collection and for the first time, reporting is based on national data coverage for all 10 regions, covering the whole of England.
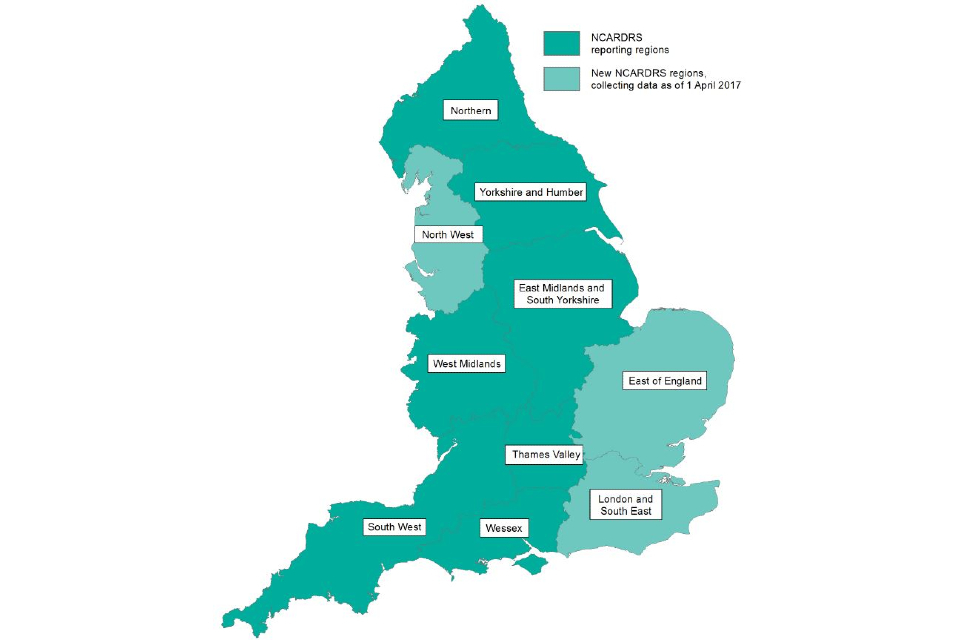
Figure 1: Map of NCARDRS reporting regions England, 2018
This important and reliable information is available for clinicians, researchers, patients and their families thanks to the dedication of notifying healthcare professionals.
2. 2018 Prevalence
Congenital anomalies are defined as being present at delivery, probably originating before birth, and include structural malformations, chromosomal, other genetic and biochemical conditions.

Important figures
NCARDRS currently collects data on >1,400 different congenital anomalies and rare diseases. In 2018, there were a total of 13,400 babies with one or more congenital anomalies notified to NCARDRS covering 628,171 total births (live births and stillbirths).
This gives an overall birth prevalence of 213.3 per 10,000 total births or 1 in 47. A total of 73.4% of babies diagnosed with a congenital anomaly resulted in a live birth or 1 in every 64 live births.
Some babies have more than one anomaly. A total of 122 babies in 2018 had had a structural anomaly, a chromosomal anomaly and a serious cardiac anomaly.

Figure 2: Multiple anomalies: babies with severe cardiac, chromosomal and/or other anomalies, in England, 2018.
3. Timing of diagnosis
Some congenital anomalies are detectable during pregnancy and others are not. Screening programmes are offered by NHS maternity services to maximise antenatal detection of specified conditions where women choose and present in time to have screening.
In 2018, the timing of first diagnosis was known for 11,601 babies (86.5%) and of these, 73.5% of pregnancies with a congenital anomaly were detected antenatally. Abdominal wall (91%) and nervous system (87%) anomalies are the most likely to be detected antenatally.

Figure 3: Timing of first diagnosis in England, 2018
4. Perinatal and infant mortality
Of the 9,836 live births diagnosed with a congenital anomaly, 699 died in infancy, giving an infant mortality rate of between 10.4 and 12.0 per 10,000 live births. Congenital heart anomalies accounted for 50.2% of infant deaths with a congenital anomaly, followed by chromosomal anomalies (22.2%) and digestive system anomalies (18.0%).

Infant mortality infographic
5. Maternal age
Lower and higher maternal age are linked with an increase in certain congenital anomalies. Data recorded in 2018 shows prevalence of genetic chromosomal anomalies was approximately 7 times higher in older mothers (women aged 40+) compared with younger mothers (women aged less than 20). Some structural anomalies are more common in younger women, gastroschisis is most common in women aged less than 20 years.

Maternal age risk infographic
Down’s syndrome, Edwards’ syndrome and Patau’s syndrome in 2018
The prevalence per 10,000 total births for Down’s syndrome was 25.0 (95% CI: 23.8-26.3), or 1 in 400 total births, 7.2 (95% CI: 6.5-7.9), or 1 for 1,389 in Edwards’ syndrome and 2.4 (95% CI: 2.0-2.8), or 1 in 4,167 total births for Patau’s syndrome respectively.

Trisomy_cone infographic