Analysis of the National Infrastructure and Construction Pipeline 2023 (HTML)
Published 2 February 2024

© Crown copyright 2024
This publication is licensed under the terms of the Open Government Licence v3.0 except where otherwise stated. To view this licence, visit nationalarchives.gov.uk/doc/open-government-licence/version/3 or write to the Information Policy Team, The National Archives, Kew, London TW9 4DU, or email: psi@nationalarchives.gov.uk.
Where we have identified any third party copyright information you will need to obtain permission from the copyright holders concerned.
This publication is available at https://www.gov.uk/government/publications/national-infrastructure-and-construction-pipeline-2023/analysis-of-the-national-infrastructure-and-construction-pipeline-2023-html
- 660 projects and programmes across the public and private sectors in the pipeline of investment
- £164bn planned for investment by 2024/25
- £700-775bn of planned and projected investment expected over the next 10 years
- £64bn worth of investments include delivery through Modern Methods of Construction (MMC) in the next two years
- £22bn of forthcoming infrastructure procurements
Ministerial foreword
Achieving high levels of investment in UK infrastructure has never been more critical than it is now. The economic, social and environmental benefits that the sector brings undoubtedly improve the lives of citizens across our regions.
That is why our commitment to economic growth and a flourishing economy is reflected in the £164bn planned investment between 2023/24 and 2024/25 in major infrastructure and construction projects.
Over the longer term, we estimate a planned and projected £700-775 billion overall investment during the next 10 years. This provides a framework against which we can invest in the necessary new skills and develop new talent. The skills challenge is a huge one, both at professional level and in most of the building trades, as the report shows. We are determined to respond appropriately to this need.
The benefits of infrastructure build nurture many types of societal wealth. For example, we are breathing new life into our communities and supporting our commitment to the levelling up agenda, such as the £36bn investment into Network North which will unlock significant transport benefits to towns, cities and rural areas. The investment in infrastructure opens up regional employment opportunities across various industries: while many of these roles are in engineering, it is great to see that approximately 60% will be in the construction sector.
We aim to be world leaders in technological innovation, creating a sustainable climate for future generations and modernising our essential public services. That is why we are driving real change through Transforming Infrastructure Performance (TIP), which sets out the vision for innovation and reform in project delivery.
We are already embedding this critical thinking, processes and methods into our world-class infrastructure projects. For example, we are including climate adaptation in project design, and minimising carbon output - principles which have already been applied to the New Hospitals Programme and Schools Rebuilding Programme.
HMP Fosse Way, under the New Prisons Programme, will use 9% less energy than older prison builds by using sustainable methods. Construction was also approximately 22% faster than
a traditional build due to 70% of the project using modern methods of construction (MMC), which resulted in better efficiency, safety, and quality.
By setting out our planned and projected spend to the market, we aim to build confidence in the construction industry at a time when we know it will be really valued under today’s challenging economic circumstances.
Being transparent about what and where we are investing money means that we can deliver more widely and effectively. It means that we can put people at the very heart of projects - whether that is the taxpayer, a local business, a big city or a small town.
Our long-term vision for infrastructure can only be achieved by government working hand- in-hand with industry. Together, we can pave the way for a brighter, thriving and more prosperous United Kingdom.
Baroness Neville-Rolfe, Minister of State at the Cabinet Office
Gareth Davies MP , Exchequer Secretary to the Treasury
Chief Executive foreword
Infrastructure comes in many shapes and sizes - from the highways spanning the length of our country and the bridges connecting our regions, to our prisons rehabilitating offenders and the hospitals providing critical healthcare.
The 660 public and private sector projects and programmes outlined in this National Infrastructure and Construction Pipeline are an integral part of the Prime Minister’s overall ambition to grow the economic prosperity of the United Kingdom.
However, we cannot ignore the fact that the pandemic and war in Ukraine has created a significant challenge for major projects, particularly in the construction sector where inflation is creating pressures.
That is why the £700-775 billion planned and projected investment in infrastructure over the next 10 years has never been more critical. We also now have our biggest ever Government Major Projects Portfolio (GMPP) on record, so we must maintain a strong delivery record that demonstrates real value.
Government is clear that growth must now take priority and infrastructure plays a huge part in supporting this. None of us can rest on our laurels - we must all keep assessing the effectiveness of our projects, so they are nothing short of world class.
It means that we have to look at innovative ways to meet our ambitions - embedding our Transforming Infrastructure Performance (TIP) principles of sustainability and digitalisation from the get-go. I am therefore pleased to see £64 billion of this investment in the next two years is through Modern Methods of Construction.
However, we need to go ever further and faster in implementing TIP into all infrastructure build. We must reduce carbon in the construction phases to support us in achieving net zero, improving energy security and putting digitalisation at the forefront of planning. At a time
of rising prices, particularly in construction, data and artificial intelligence will be key to becoming more productive and saving money in the long-term.
It is critical that we set out to industry our projections of the investment and workforce required to deliver against our commitments. There has never been a more important time to work in project delivery and to bring new capabilities and resources into the sector - whether that be apprentices, technicians, graduates or other skilled workers.
This pipeline will support industry in making strategic and informed decisions about their long-term business and project planning. While we are operating in an unprecedented time, we must nevertheless press on, we must save money for the taxpayer and we must adapt to this modern and rapidly-changing world.
Projects change lives, save lives, and pave the way for the digital revolution, innovation and a greener United Kingdom. I look forward to government and industry collectively maximising its impact for building a country that we can all be proud of.
Nick Smallwood, Chief Executive, Infrastructure and Projects Authority
Summary
1.1 The 2023 National Infrastructure and Construction Pipeline (NICP) provides a clear and robust assessment of infrastructure investment over the next decade. Providing industry and investors with a consistent view of planned and predicted spending on infrastructure projects and programmes is critical to support companies in their short and long term business planning, and enable them to invest in the right skills, technologies and practices for the future.
1.2 This pipeline comes after the publication of the second National Infrastructure Assessment (NIA) from the National Infrastructure Commission (NIC), which sets out NIC’s independent assessment of infrastructure requirements over the next 30 years, and recommendations for addressing them. The Government’s response to the NIA will be developed over the coming year.
1.3 The IPA collates data from multiple sources to form the pipeline including the public sector, private sector and regulators. The pipeline is mainly related to England and does not include devolved spending in Scotland, Wales and Northern Ireland and by Local Authorities[footnote 1]. The assessment is based on data collected during summer 2023,[footnote 2] against a backdrop of economic uncertainty, inflationary pressures and fiscal constraint. Despite that, the IPA analysis indicates a strong commitment to infrastructure spend in key sectors, supporting growth, jobs and the innovation required to drive productivity in the UK construction sector.
1.4 The 2023 pipeline includes £379 billion of planned investment, £164 billion of which is scheduled to occur by 2024/25[footnote 3]. Longer term public investment, where it is not already committed, will be determined by future government Spending Reviews. Likewise the forthcoming spending of regulated utilities will be determined via defined settlement periods. To enable the construction industry to have confidence in longer term strategic planning, the IPA uses data from previous years and its own assessment of current trends to provide a 10 year pipeline projection including planned and forecast spend. For the 2023 pipeline this amounts to an estimated £700-775 billion, which is broadly in line with the 2021 pipeline, in today’s prices[footnote 4]. This year’s 10 year pipeline projection is a range estimate to reflect the scenarios that may materialise over the next decade, in terms of spending decisions, economic context and investment landscape.
1.5 Despite the apparent strength of the planned pipeline, there is a challenging environment for infrastructure projects. There are a number of reasons why this might be the case:
High global inflation in the last two years, driven by high energy costs, and economic pressures which continue to affect infrastructure projects and their supply chains as well as the wider economy. Construction material prices are over 40% higher than in January 2020, before the Covid pandemic and Russia’s invasion of Ukraine, and there is continuing pressure on labour markets. The inflationary effect has directly impacted the costs associated with delivering infrastructure projects and programmes, with sponsors in both public and private sectors having to reset expected outputs to remain within the approved budgets.
Construction inflation has been different to the general economy. The IPA has consistently used Gross Domestic Product (GDP) indices to adjust for inflation and compare time periods. In practice, the construction sector specific indices have been higher than GDP indices over recent periods especially immediately following Russia’s invasion of Ukraine, even though there are some signs of stabilisation. We estimate the impact of this spike in inflation for the 2023 figure to be in the region of £25 billion[footnote 5], which does make comparisons of like for like delivered value with previous years more difficult. Given that the future impact of inflation is unknown IPA has retained the use of GDP deflators, and on this basis the current pipeline range of £700-£775 billion equates broadly to the pipeline in 2021 which was £650 billion in prices of the day and £788 billion in 2023 prices.
Wider systemic issues leading to delays in implementation, including planning, low investor confidence and wider uncertainty. The Nationally Significant Infrastructure Project regime has been affected by legal challenges to the efficacy of the National Planning Policy Statements, which are currently being updated. Likewise the prisons programme has been impacted by the difficulties in achieving planning consents for new facilities. These delays have directly impacted planned spending profiles. The Government is taking steps to address wider systemic issues by updating and simplifying National Policy Statements, building greater capability in planning authorities and simplifying processes, including through introducing a “fast track” planning route for infrastructure projects.
Given this backdrop, to help industry and the wider supply side in their medium term planning the IPA has provided a high-level indication of certainty status associated with key programmes and sub-sectors in this report (see section 2.5).
1.6 Delivery of the pipeline requires a significant workforce with the right skills and experience and IPA’s assessment is that availability of labour, especially in relation to specific skills, is essential. Improving productivity will be an important factor to help manage delivery.
1.7 The focus on sustainability, innovation and productivity is more important than ever given the highly challenging economic and delivery environment, impacts of climate change and the drive to Net Zero. IPA’s flagship programme Transforming Infrastructure Performance (TIP)[footnote 6] is reforming the way government’s infrastructure projects are designed and delivered by drawing a direct line between citizen benefits and impact on the built and natural environments. This step change in performance will be supported through application of the Construction Playbook[footnote 7] provisions, project data analytics, modern construction methods including platform delivery, and other approaches that deliver greater sustainability and efficiency. IPA intends to embed TIP practices as Business as Usual by 2025.
1.8 The following pages of this report provide further detail and analysis relating to the 2023 infrastructure pipeline, including an assessment of regional impact and the opportunities for private sector capital to be deployed. The pipeline case studies in this report highlight significant achievements, successes and new ways of working which projects and industry must build on for the future.
Analysis of the 2023 pipeline
2. Planned investment in the pipeline
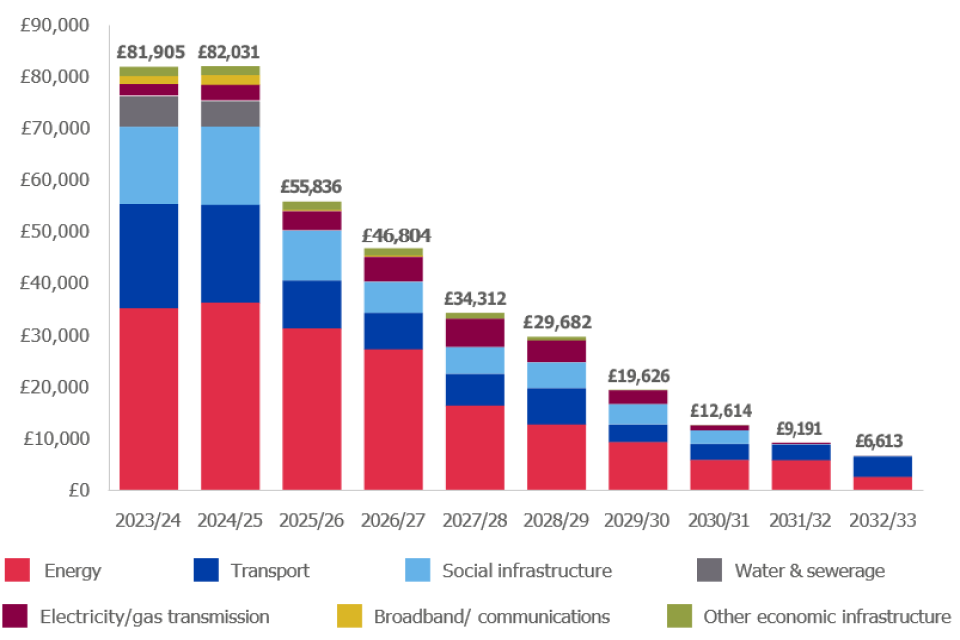
2.1 The 2023 National Infrastructure and Construction Pipeline comprises 660 projects, programmes and other investments across a wider range of infrastructure types than ever, which reflects the ever improving transparency and market coverage that the pipeline provides[footnote 8]. Over the next two years to 2025, the total value of planned public and private investment is £164 billion, an average of £82 billion per annum.
2.2 The profile of planned, committed investment is outlined below. This includes spending within the current government spending review settlement period (to 2024/25) - the period within which most public budgets are approved and certain - as well as longer term agreed spending across the coming 10 years (see section 6 for the longer 10 year projection).
2.3 Chart 1 outlines the spread of this investment by sector and year. It shows a strong profile in the next two years, with energy (£36 billion a year to 2024/25) and transport (£19 billion a year to 2024/25) representing the largest portions of the pipeline value. Similar to previous pipelines, planned expenditure tapers down after the end of the current spending review period, where budgets are not yet fully confirmed.
2.4 The next spending review, and forthcoming settlement periods for regulated utilities, will set out more detail on future capital budgets and provide further certainty beyond 2025. As standard, government will continue to update and engage with industry partners as these publicly funded budgets and investments are agreed.
Chart 1: Profile of planned pipeline investment by sector (£m) 2023/24 to 2032/33[footnote 9]
2.5 In order to provide as much clarity and transparency as possible, IPA’s perspective on the near to medium term status - in terms of funding and delivery certainty - of publicly funded projects is broadly summarised below:
Energy: Projects and programmes are typically agreed and committed to within the current spending review period, some but not all are fully funded and will extend beyond 2025. A number are co-financed by the private sector. Given the importance of energy transition to the future of the UK, IPA expects that this will continue to be an area of investment, although there is uncertainty on the delivery profile for a number of individual projects.
Transport: For rail, projects and programmes are typically agreed and committed to within the current spending review period. For roads, there is agreement on most projects and programmes; timing of funding commitment and / or delivery profile is yet to be determined.
The Prime Minister’s October Network North announcement confirmed the cancellation of HS2 phase 2a, 2b and HS2 East, redirecting government investment in transport infrastructure towards local priorities to unlock benefits sooner in towns, cities and rural areas. This pipeline reflects phase 1 investment on the basis of currently available information; capital investment previously allocated to HS2 phase 2a, 2b and HS2 East has been included in the wider Network North package of transport investments worth £36 billion[footnote 10]. This includes commitments to expand Northern Powerhouse Rail, allocate an extra £8.3 billion to roads resurfacing across England; deliver the mass-transit system in West Yorkshire; and provide £8.55 billion of additional funding for the second round of City Region Sustainable Transport Settlements.
Health & social care; education; housing & regeneration; flood defence: Projects and programmes are typically agreed, committed to and funded within the current spending review period. Timing of delivery is uncertain in some cases.
Prisons: Projects and programmes are typically agreed and committed to within the current spending review period. Many, but not all, have a clear delivery profile; and some material planning risks exist.
Broadband/ communications: Projects and programmes are typically agreed and committed to within the current spending review period. There is a clear delivery profile in most cases.
3. Regional distribution of investment
3.1 This section provides an overview of the distribution of planned infrastructure investment in the pipeline from 2023/24 to 2024/25, which has a wide geographic spread, as outlined in Image 1. Infrastructure is one important element of the Government’s levelling up agenda, and sits alongside wider policy and support led by the Department for Levelling Up, Housing and Communities (DLUHC). This pipeline does not cover investment relating to devolved responsibilities in Scotland, Wales and Northern Ireland.[footnote 11]
Image 1: Map of planned investment in the pipeline[footnote 12]
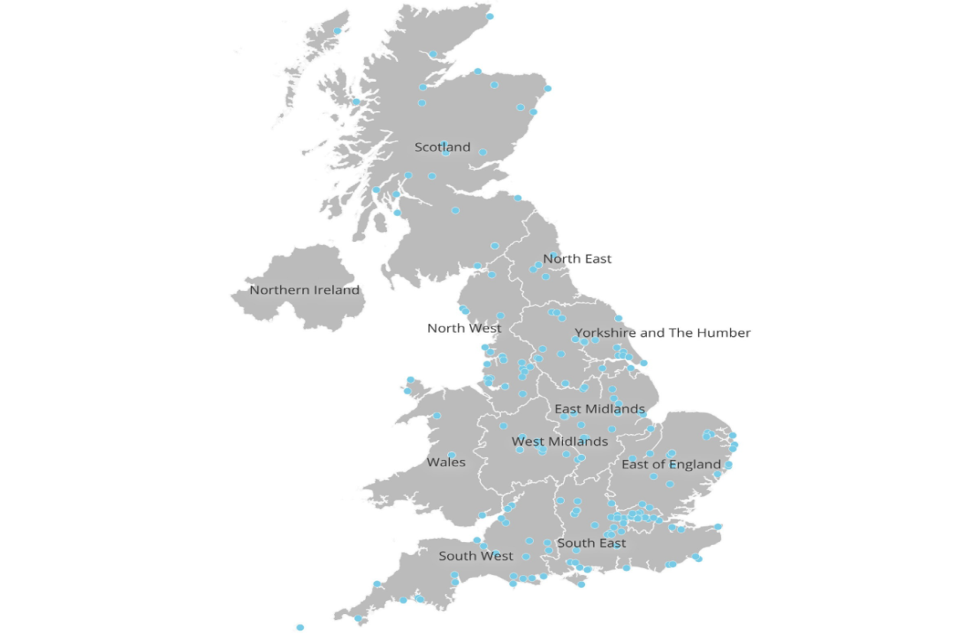
3.2 Where investment cannot easily be categorised to one region, the IPA uses established methodologies to allocate to a set of regions. This approach is detailed in Annex B and indicates average per capita investment of £1,694 across England between 2023/24 and 2024/25[footnote 13].Programmes which have not provided profiled investment by year (e.g. if budgets have not been allocated or for commercial reasons) do not appear in the regional analysis[footnote 14] .
3.3 The analysis focuses on where construction activity will typically be taking place, rather than where improvements to infrastructure and public service will be felt. For example, many transport or energy infrastructure investments made in one location may deliver benefits to citizens in multiple other regions, often positively impacting the whole of the UK. Related job creation, contract opportunities, wider growth and other benefits from infrastructure investment are often spread widely across regions. In a number of cases, investment cannot be attributed geographically and this expenditure does not appear in the regional analysis[footnote 15]; findings should therefore be treated with some caution and with the key caveats and exclusions in mind.
Case study: HMP Fosse Way
New Prisons Programme
Opened in May 2023, HMP Fosse Way is the second new prison to be built in the New Prisons Programme for men held in Category c conditions usually within two years of release.
Construction began in 2020 using an innovative design based on Modern Methods of Construction (MMC), and with local growth and benefits as key principles.
Around 70% of the project used MMC principles, which ensured better results in terms of efficiency, safety, and quality. Construction was around 22% faster than a traditional build, using over 12,000 pre-cast concrete panels, as well as pre-cast walls, cell windows, internal riser modules and modular plant rooms, all of which are manufactured off-site.
The build is also a positive example of sustainability, having met or exceeded the majority of its sustainability goals. This includes stringent targets on CO2 emissions, responsibly sourced timber and waste diversion. Hydrotreated Vegetable Oil (HVO) vehicles were used on site instead of diesel, and 100% of waste that could be has been diverted from landfill. The prison will use 9% less energy than older prison builds, and provides a new benchmark for the New Prisons Programme to improve upon for future builds.
The project team were keen to strengthen community engagement, holding regular stakeholder meetings and community site visits throughout the build. The community visits were popular events and served to allay many fears held by residents around the site such as regime, lines of sight from the prison, and construction and environmental practices.
The prison has promoted growth benefits locally throughout its build phase and will continue to do so after it is open. During construction, the site has created over 460 jobs, 71 of which were held by ex-offenders.
SERCO won the bid to run the privately run prison and now it is operational, the prison will provide over 600 jobs to the local area through a variety of roles. As of April 2023, 36% of the overall project spend (£286 million) had been spent locally with small and medium sized enterprises. The prison’s classrooms and workshops will teach prisoners skills relevant to the local labour market, creating long term benefits for both prisoners and the local community.
4. Funding mix of planned investment
4.1 The UK’s major infrastructure pipeline represents projects financed by public and private funding sources - Chart 2 sets out the funding split of each sector of the pipeline to 2024/25[footnote 16]. Energy and utilities (water and electricity/ gas transmission), both privatised sectors, have high proportions of privately financed infrastructure projects. Private finance will play an important role in the UK’s transition to Net Zero. In contrast, transport and social infrastructure projects are funded predominantly by the public sector, or through a mixed funding approach (public and private).
Chart 2: Funding mix of planned investment in the pipeline from 2023/24 to 2024/25 by sector (£m)
| Sector | Private | Public | Public/Private mix |
|---|---|---|---|
| Energy | £68,634 | £2,006 | £620 |
| Transport | £0 | £31,177 | £7,985 |
| Social infrastructure | £0 | £25,433 | £4,756 |
| Water and Sewerage | £10,888 | £0 | £42 |
| Electricity/gas transmission | £4,783 | £0 | £408 |
| Broadband/communications | £2,346 | £796 | £485 |
| Other economic infrastructure | £1,133 | £1,886 | £557 |
4.2 Just over half of the planned pipeline value to 2024/25 is funded privately (54%), with the remainder being funded by public funding or a public/private mix. This split has remained relatively consistent over time and is set to continue over the spending review period, as outlined in Chart 3.
Chart 3: Funding mix of planned investment from 2023/24 to 2024/25 by year (£m)
| Year | Private | Public | Public/Private mix |
|---|---|---|---|
| 2023/24 | £43,532 | £31,119 | £7,253 |
| 2023/25 | £44,252 | £30,220 | £7,559 |
5. Opportunities for private infrastructure investment
5.1 This year’s pipeline identifies existing projects and programmes with current or future opportunities for additional private investment[footnote 17]. These opportunities relate to projects worth £63 billion over the 10 year pipeline, from a range of sectors including energy, social infrastructure, science and research, and communications, as illustrated in Charts 4 and 5 below. These opportunities for private corporate or project finance can take a number of forms and are at varying stages of delivery. Regulated Asset Base (RAB) and Contracts for Difference (CfD) are two financing models typically used in regulated infrastructure and the UK Infrastructure Bank[footnote 18], launched in 2021 and backed by HM Treasury, also supports private investment, including through equity investments, loans and guarantees.
Chart 4: Opportunities for private corporate or project finance linked to planned investment in the pipeline from 2023/24 to 2032/33 (£m total project value)
| Answer/% | Value |
| Yes (16%) | £62,922 |
| No (39%) | £146,455 |
| Unknown / N/A (45%) | £169,237 |
Chart 5: Private investment opportunities by sector from 2023/24 to 2032/33 (£m total project value)[footnote 19]
| Sector | £m |
| Energy | £32,649 |
| Social infrastructure | £19,443 |
| Transport | £5,412 |
| Broadband / Communications | £4,094 |
| Other economic infrastructure | £1,324 |
6. Planned and projected investment over the next 10 years
6.1 As in previous pipeline publications, the IPA brings together all planned public and private investment from 2023/24 (including investments that extend beyond the spending review period) and supplements this with its projected investment estimates to forecast the full view of infrastructure investment over 10 years to 2032/33.
6.2 IPA estimates put the total 10 year pipeline at £700-775 billion[footnote 20]. This year’s projection is a range estimate to reflect the scenarios that may materialise over the next decade, in terms of future spending decisions, economic context and investment landscape. The range includes the £164 billion of planned investment outlined within the next two years, a further £215 billion of planned investment from 2025/26 to 2032/33 (from longer term approved funding), as well as other projected investment, as outlined in Chart 6 for the upper estimate.
Chart 6: Total investment in the pipeline 2023/24 to 2032/33 (£m, upper estimate)[footnote 21]
| Status/% | Investment (£m) |
| Planned post SR (28%) | £214,678 |
| Planned within SR (21%) | £163,935 |
| Projected (51%) | £395,986 |
Chart 7: Planned and projected investment in the pipeline by sector 2023/24 to 2032/33 (£m, upper estimate)
| Sector | Planned and projected Investment (£m) |
| Energy | £315,832 |
| Transport | £233,879 |
| Social infrastructure | £84,481 |
| Electricity / gas transmission | £77,996 |
| Water and Sewerage | £29,980 |
| Other economic infrastructure | £16,759 |
| Broadband / communications | £15,673 |
6.4 In line with the planned investment described earlier, energy and transport represent the largest sectors in the 10 year pipeline (41% and 30% respectively), followed by social infrastructure (11%). IPA insight across UK major projects suggests we are likely to see growth in areas including water and sewerage, broadband/communications, as well as continued commitment to investment in a range of transport and key social infrastructure (such as hospitals and schools).
Case Study: Boston Barrier scheme
Environment Agency
The Environment Agency’s Boston Barrier Scheme now provides better protection to 13,700 homes from tidal flooding for the next 100 years. Focusing on the urgent need for climate adaption, net zero carbon and sustainability, the scheme not only delivers improved coastal flood protection to Boston, but also provides economic, societal and environmental benefits for the local community.
The United Nations’ Sustainable Development Goals (UNSDGs) were used as a framework to identify, monitor and evaluate the project outcomes. This systems approach enables projects to assess and maximise the benefits delivered within their original investment.
The project has made positive impacts on all 17 UNSDGs across the local community, for example a focus on SDG12 Responsible Consumption and Production achieved savings from the re-use of dredged material as capping at a local landfill site. This further avoided over 30,000 additional lorry movements and was key to securing a CEEQUAL Interim Whole Team ‘Excellent’ Award[footnote 22].
The Environment Agency’s goal of achieving net zero by 2030 inspired the innovative use of reduced carbon materials. Ground granulated blast furnace slag as a cement replacement across 6,000m3 of reinforced concrete in the primary barrier structure, saving a total of 1,380 tCO2e of embodied carbon. The team secured recognition of their net zero ambitions by becoming one of the Institution of Civil Engineers inaugural ‘Carbon Champions’.
The project also used recycled steel and aggregates, installed solar panels and air source heat pumps on its control building and used low carbon concrete and pre-cast units wherever possible, driving improvements in quality and improving programme delivery on critical deliverables. This work is featured as best practice in the Institution of Civil Engineers’ Low Carbon Concrete Routemap.
Through accelerated knowledge share, this approach can be replicated as best practice in all future investments, across UK project delivery, and globally.
7. Investments to be delivered through Modern Methods of Construction (MMC)
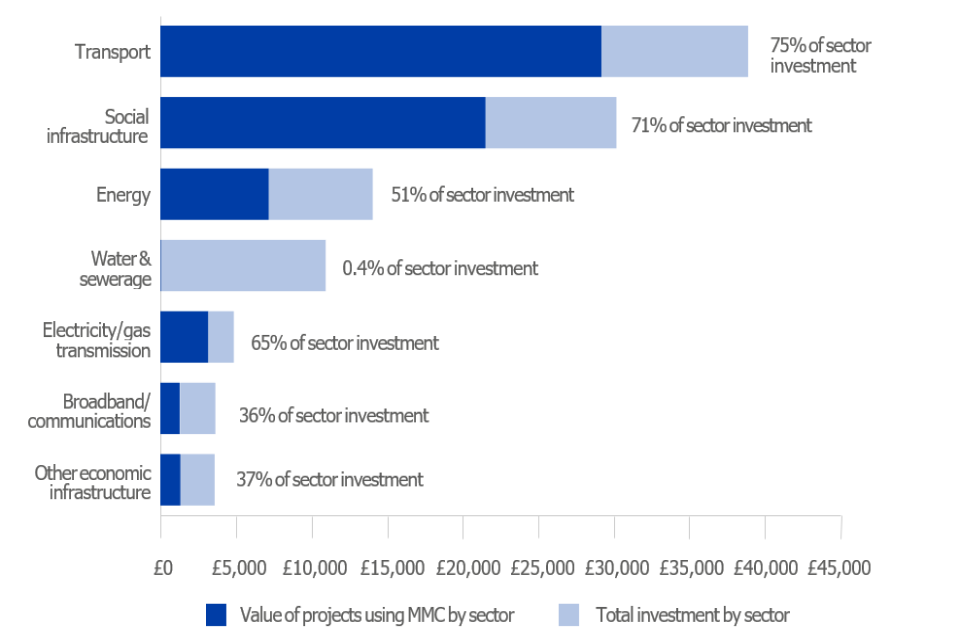
7.1 £64 billion of the planned pipeline to 2024/25 will include delivery through MMC. This can involve a broad range of approaches, technologies and innovations such as automated design or offsite construction, all with a focus on improving value and efficiency in construction.
7.2 As shown in Chart 8, transport and social infrastructure are the sectors with the highest known absolute spend in MMC over the next two years (representing 46% and 34% of all MMC spend respectively).
Chart 8: Planned investment in the pipeline from 2023/24 to 2024/25 to include some delivery via MMC (£m value of projects)
7.3 These are also the sectors with the highest relative spend on MMC (as a proportion of total project value), with MMC project spend totalling 75% of all investment in transport and 71% of all investment in social infrastructure in the coming two years. Information on MMC in energy projects is typically not available via our data sources and therefore not well represented in this MMC analysis. Similarly Ofwat data on water and sewerage investment did not include details on MMC use.
Chart 9: Use of MMC in planned investment in the pipeline from 2023/24 to 2024/25 - by sector total (£m value of projects)[footnote 23]
| Sector | Planned Investment (£m) |
| Energy | £7,173 |
| Transport | £29,174 |
| Social infrastructure | £21,508 |
| Electricity / gas transmission | £3,170 |
| Water and Sewerage | £42 |
| Other economic infrastructure | £1,330 |
| Communications | £1,281 |
7.4 MMC can take various forms, and this year’s data shows projects and programmes most commonly cite using a range of methods, with ‘both offsite and onsite/ digital MMC methods’ representing 33% of MMC project value, and ‘various’ 7%. Using offsite manufacturing only (7%) and UK BIM framework only (1%) was less common.
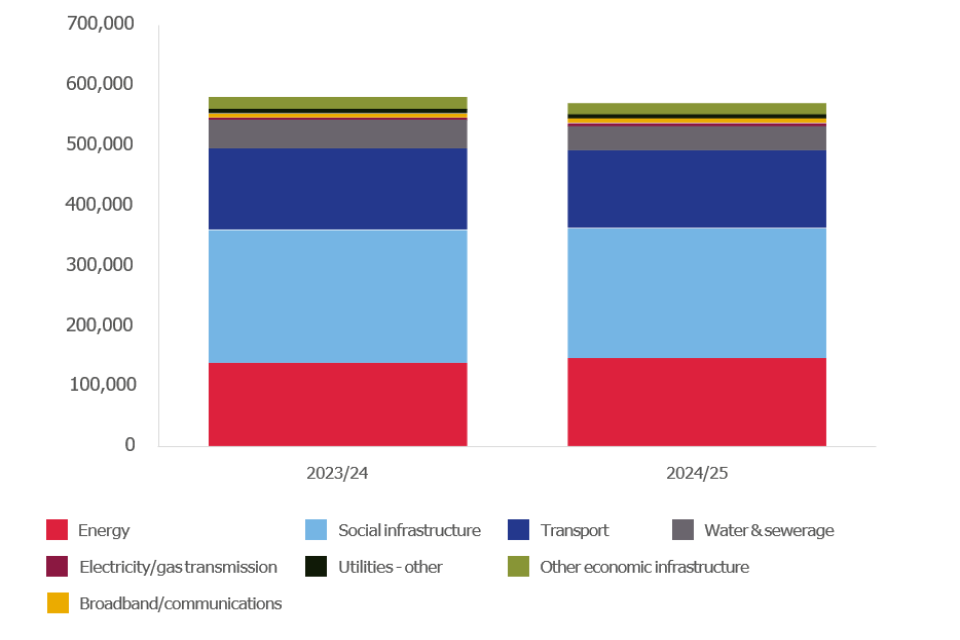
8. Workforce demand analysis
8.1 This section provides an estimate of future demand on the workforce to deliver the planned investment in the pipeline. The analysis draws on on-site labour data from an extensive sample of projects and programmes and applies these patterns of labour use to the planned investment in the pipeline. The IPA’s workforce estimates are based on the planned investment within the spending review settlement period of the pipeline as these years provide the greatest certainty and detail on spend.
8.2 To deliver the £164 billion of planned investment over the next two years, the IPA estimates an annual average of 543-600,000 workers will be required across different industry groups including construction and engineering construction. Of this, approximately 60% are construction jobs. This is an increase from the 2021 pipeline figure which estimated an average of 425,000 workers required, and is in line with the increase in the number of projects covered (from 528 to 660). Chart 10 shows the annual profile of the workforce by sector to deliver this investment in the pipeline.
Chart 10: Estimated annual workforce requirement to deliver planned investment in the pipeline from 2023/24 to 2024/25[footnote 24]
8.3 Competition for highly sought skills is set to continue as factors including an ageing population, migration patterns and labour movements out of the construction sector remain a feature. Chart 11 lists the occupations required in the highest volume to deliver the pipeline, a number of these jobs are likely to face particularly high relative demand (where pipeline demand is a significant proportion of the existing workforce). Civil engineers and civil engineering operatives, plant operatives, and plant mechanics/ fitters are examples of construction workers which are most likely to see some level of scarcity in the coming years. Work is underway across government and within the construction industry to address these risks and attract a reliable pipeline of skilled workers into the sector, including through regular review of the government’s Shortage Occupation List (SOL)[footnote 25]. The review conducted in Spring 2023 by the Migration Advisory Committee (MAC), resulted in five additional construction occupations joining the SOL. In October 2023 the MAC completed a full review of the SOL, the government is considering the MAC’s recommendations and will respond in due course.
Chart 11: Summary of high demand occupations in the pipeline, annual median 2023/24 to 2024/25[footnote 26]
8.4 This analysis does not provide an exhaustive view of future workforce requirements, and should be treated as an indication of potential workforce demand. It cannot account for detailed variations in the complexity or exact design of projects, unless explicitly outlined in the project description. In addition, this analysis is limited in its considerations of very new and emerging technologies that may reduce or influence the types of skills required to deliver future projects and programmes.
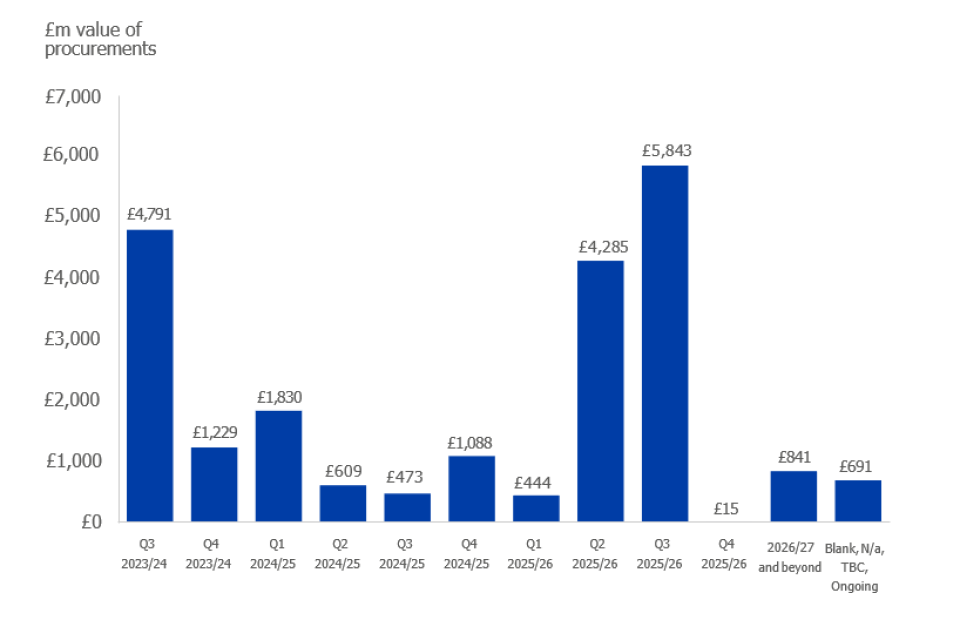
9. Pipeline of infrastructure procurements
9.1 This year’s NICP brings together 536 forthcoming procurements worth an estimated £22 billion[footnote 27]. Chart 12 below shows the highest share of procurement opportunities is in economic infrastructure at £19 billion (86%) with social infrastructure having a smaller share with £3.1 billion (14%).
Chart 12: Estimated maximum contract value of procurements in the pipeline by sector (£m)
| Sector/% | Estimated maximum contract value of procurements in the pipeline by sector (£m) |
| Social infrastructure (14%) | £3,108 |
| Economic infrastructure (86%) | £19,031 |
9.2 As Table 2 illustrates, the largest estimated procurement value is seen in the transport and energy sectors, in line with the pattern seen in the investment pipeline.
Table 2: Planned procurements by sector (£m)
| Sector/sub sector | Number of procurements | Estimated minimum contract value (£m) | Estimated maximum contract value (£m) |
|---|---|---|---|
| Energy | 20 | £5,862 | £8,425 |
| Transport | 73 | £5,284 | £6,676 |
| Other economic infrastructure | 44 | £2,284 | £3,006 |
| Education | 114 | £1,201 | £1,201 |
| Other social infrastructure | 131 | £617 | £875 |
| Broadband/ communications | 5 | £815 | £815 |
| Housing & regeneration | 17 | £532 | £598 |
| Justice | 54 | £415 | £415 |
| Electricity transmission | 13 | £56 | £91 |
| Water & sewerage | 12 | £34 | £39 |
| Health & social care[footnote 28] | 53 | £0 | £0 |
| Grand total | 536 | £17,099 | £22,140 |
9.3 This year’s procurement pipeline stretches further beyond the immediate next financial year, and the data includes 74 procurements which are due to be awarded a year or more from now (from Q3 2024/25 onwards), providing more transparency into the longer term.
Chart 13: Number of procurements and estimated maximum contract value in the pipeline by financial quarter (£m)

Expected use of Modern Methods of Construction (MMC)
9.4 Government is driving forward growth in the use of MMC in its procurement, promoting innovation and use of technologies, platforms and approaches to improve the efficiency and sustainability of UK construction. The Government’s Construction Playbook[footnote 29] strongly promotes the use of MMC in public sector contracting, with an expectation that MMC methods are the default approach in all appropriate contracts. Of the contracts included within the procurement section of the pipeline, over £17 billion (77%) are expected to utilise some form of MMC. Given the long lead in times of some of the pipeline procurements, in some cases this may be an underestimate of MMC adoption.
The IPA strongly supports this trend in MMC adoption and will continue its work via the TIP programme to firmly embed the best and most innovative practices in the UK construction industry.
Chart 14: Estimated maximum contract value of procurements in the pipeline to include delivery via MMC (£m)
| Category/% | Estimated maximum contract value of procurements in the pipeline to include delivery via MMC (£m) |
| Unknown or N/A (22%) | £4,819 |
| No (1%) | £249 |
| Yes (77%) | £17,072 |
Annex A
Methodology and assumptions - 10 year projection of investment
A.1 For this iteration of the NICP, the IPA has provided a projected range for private and public infrastructure investment over the next ten years, rather than a specific point estimate. This range takes better account of the possible private and public funding scenarios and economic conditions which may play out over the longer term.
A.2 The upper bound of this range is a projection of investment using historic growth rate trends, as outlined below. The lower boundary is calculated by applying the OBR forecast 5 year average annual output growth rate of 1.9%[footnote 30] across all pipeline sectors into the next 10 years. The bounds should not be interpreted as a reflection of current or future government policy.
A.3 The upper bound projection broadly assumes investment growth will continue historic sector trends seen from 2012/13 to 2022/23, projected to 2032/33 in real terms[footnote 31], with a number of exceptions in some sub-sectors:
- Projected investment in regulated utilities is modelled on the average level of annual investment, incorporating government annual efficiency targets of 1.15%. This projection does not represent any changes agreed in future price control periods, which are not yet determined.
- Investment in electricity generation is based on Department for Energy Security and Net Zero projected energy demand scenarios and IPA modelling[footnote 32].
- Investment in the oil and gas sector has been forecast to 2032/33 by the industry regulator, the North Sea Transition Authority (NSTA).
Annex B
Methodology used for regional analysis of investment to 2024/25
Regional allocation where the asset location is known
B.1 The IPA uses established methodologies to allocate infrastructure investment to the regions of the UK. Projects in the National Infrastructure and Construction Pipeline are allocated to individual regions (as defined by the ONS), based on the location of the built asset when it is located within one region.
B.2 Using this basic methodology, 40% of the total planned pipeline value within the spending review period (2023/24 to 2024/25) is allocated to a specific region. Many projects cannot be allocated in this way as they are national, cross region, or are broader investment programmes. Other programmes which have not provided profiled investment by year (e.g. if budgets have not been allocated or for commercial reasons) also do not appear in the regional analysis.
B.3 This basic allocation of projects and programmes to specific regions is not based on the analysis of the benefits that assets will deliver. For example, the pipeline does not currently reflect benefits to the supply chain of the construction and maintenance of an asset or benefits to users of infrastructure assets once in use. In some cases, the location of the asset will be the same as where benefits are felt. For example, investment in public services infrastructure, such as schools and hospitals, largely benefit the communities in which the constructed asset is based.
Additional regional allocation
B.4 The IPA has, alongside other lead government departments and regulators, developed a set of methodologies to allocate the remaining pipeline value to individual regions, where this cannot be done based simply on the asset location. Using this two step approach, 62% of the total value of the planned pipeline to 2024/25 has been allocated to specific regions. Data on planned investment in energy generation does not include geographic information. If energy generation planned investment is excluded, the IPA approach has regionally allocated almost 90% of the value of the planned pipeline to 2024/25. An explanation of how this is done is provided below.
Methodology applied for sectors other than transport
B.5 Where a project or programme is operating in a known location or set of locations, the analysis distributes the investment equally across those regions. For the remaining non-transport projects and programmes, nationwide investment in multi-regional programmes is shared out according to the population or number of households in each region. The methodology is broken down by sector in the table below:
Allocation per household
- Communications (Broadband)
- Energy (Gas transmission, Smart meters)
- Housing and Regeneration (Building safety)
- Utilities (Electricity transmission)
Allocation per person
- Education (Schools, Further Education)
- Health (NHS capital funding)
- Housing and Regeneration (Housing and development)
- Justice (Prisons capital funding)
- Science and Research
- Transport (non road/ rail, development funds)
Methodology applied to the transport sector
B.6 Many of our biggest transport projects cross regional boundaries, particularly on the strategic rail and road networks. The regional allocation of spending and its interpretation is therefore not straightforward. Issues include:
- Investments physically located in one geographic region often benefit those who live in other regions. For example, investments in London’s transport network will benefit not only London residents, but also those who work in London but live elsewhere, in addition to business and leisure visitors to the city.
- Key parts of our transport network serve as international travel ‘hubs’ for the whole of the country. For various geographic reasons, many of these are concentrated in London, the South East and the East of England. Transport spending that supports travel to and from these ‘hubs’ benefits the whole country through the international travel and the trade it facilitates.
- Large transport investments often involve substantial spending over a long construction period and long-term impacts. This means the regional distribution of spending at a particular point in time will not necessarily match the regional distribution of benefits in that period or the benefits over the lifetime of the investment.
B.7 Where possible, transport investment in this analysis has been allocated to the region where it is located. For cross-regional investment, the Department for Transport uses standardised methodologies (such as track length for rail, road usage for road) to apportion its investment into regions which are shared in the pipeline data.
B.8 Based on this approach, Chart B1 below shows the distribution of allocated investment to the regions of England.
Chart B1: Planned investment in the pipeline by region 2023/24 to 2024/25 (£ per head)[footnote 33]
| Region | Planned investment in the pipeline by region 2023/24 to 2024/25 (£ per head) |
| North West | £1,566 |
| North East | £1,245 |
| Yorkshire and The Humber | £1,355 |
| West Midlands | £1,597 |
| East Midlands | £1,296 |
| East of England | £1,306 |
| London | £2,074 |
| South East | £1,799 |
| South West | £2,510 |
Annex C
Devolved infrastructure investment
C.1 The National Infrastructure and Construction Pipeline includes projects and programmes distributed across the UK. The majority of the value of the pipeline however, relates to activity in England. This is because a large proportion of infrastructure spending in Scotland, Wales and Northern Ireland is the responsibility of each devolved administration, and therefore is not included within this pipeline.
C.2 The split between the responsibility of the UK Government and each of the devolved administrations for infrastructure policy and funding varies according to the distinct devolution settlement in place, set out in the table below. Each devolved administration produces its own infrastructure planning setting out spending in economic infrastructure:
- The Investment Strategy for Northern Ireland 2050 sets out a long-term view of strategic investment priorities for public infrastructure with clear funding mechanisms. Details of projects and contracts are frequently updated via the Infrastructure Investment Pipeline[footnote 34].
- The Scottish Government published an Infrastructure Investment Plan which covers 2021-22 to 2025-26 detailing a clear vision and pipeline for Scotland’s future infrastructure. The Scottish Futures Trust Construction Pipeline Forecast Tool provides detail on the forward look of projects[footnote 35].
- The Welsh Government published an Infrastructure Investment Strategy in 2021 which sets out their 10 year vision of what infrastructure should enable alongside an infrastructure Project Pipeline 2022[footnote 36].
| Category | Scotland | Northern Ireland | Wales |
|---|---|---|---|
| Road | Devolved responsibility | Devolved responsibility | Devolved responsibility |
| Rail | The Scottish Government is responsible for internal services. The UK Government is responsible for cross border daytime services. |
Devolved responsibility | Not devolved |
| Airports | Devolved responsibility. The regulation of air services is a reserved matter. |
Devolved responsibility | Devolved responsibility |
| Ports | Devolved responsibility, with some minor exceptions | Devolved responsibility | Devolved responsibility, with some minor exceptions |
| Energy | Not devolved | Not devolved | Not devolved |
| Communications | Not devolved | Not devolved | Not devolved |
| Water | Devolved responsibility | Devolved responsibility | Devolved responsibility |
| Flood defence | Devolved responsibility | Devolved responsibility | Devolved responsibility |
| Waste | Devolved responsibility | Devolved responsibility | Devolved responsibility |
| Housing | Devolved responsibility | Devolved responsibility | Devolved responsibility |
Annex D
Pipeline coverage and sector definitions
D.1 The NICP summarises data on capital expenditure for public and private sector major infrastructure and construction projects. The IPA collates data from government departments, regulatory bodies, key major infrastructure providers in the private sector and some local authorities. While the pipeline’s coverage is continually improving, it should not be considered as representative of all UK infrastructure investment.
D.2 Projects are split broadly into two main categories: economic infrastructure and social infrastructure, as described below. Data is requested for projects that have an approved budget and meet the following threshold:
- Economic infrastructure - total capital value is £25m or above
- Social infrastructure - total capital value is £15m or above
D.3 Where projects below these thresholds are provided by contracting authorities they are included in the dataset.
Sector category: Economic infrastructure
Sector
- Broadband/ communications
- Electricity & gas transmission
- Energy
- Flood/ coastal defence
- Science & research
- Transport
- Water & sewerage
Sector category: Social Infrastructure
- Borders & policing
- Defence
- Education
- Health & social care
- Housing & regeneration
- Justice
- Tax & customs
- Work & pensions
Contact IPA
- @ipagov
- IPA@ipa.gov.uk
- www.gov.uk/IPA
Cabinet Office
Correspondence team
70 Whitehall
London
SW1A 2AS
- publiccorrespondence@cabinetoffice.gov.uk
- General enquiries: 020 7276 1234
HM Treasury
Correspondence team
1 Horse Guards Road
London
SW1A 2HQ
- public.enquiries@hmtreasury.gsi.gov.uk
- General enquiries: 020 7270 5000
© Crown Copyright 2024
Produced by the Infrastructure and Projects Authority
You may re-use this information (excluding logos) free of charge in any format or medium, under the terms of the Open Government Licence.
To view this licence, visit: www.nationalarchives.gov.uk/ doc/open-government-licence/
Email: psi@nationalarchives.gsi.gov.uk
Where we have identified any third party copyright material you will need to obtain permission from the copyright holders concerned.
Alternative format versions of this report are available on request from: ipa@ipa.gov.uk
-
See Annex C for further information on devolved matters and infrastructure pipelines in Scotland, Wales and Northern Ireland. ↩
-
Data in this pipeline is a snapshot taken in summer 2023, with adjustments made following the Prime Minister’s October announcement of HS2 phase 2a, 2b and HS2 East cancellation. The NICP includes major infrastructure and construction schemes funded by the public and private sectors which exceed certain capital thresholds, see Annex D for further detail. ↩
-
All figures and analyses are in 2022/23 prices using ONS GDP deflators. ↩
-
Adjusting the 2021 pipeline 10 year projection of £650bn to current prices, using the ONS construction output index (which accounts for price inflation in construction related products) results in a 10 year projection of £788 billion. ↩
-
Cost uplift based on using ONS construction output index in place of ONS GDP deflators. ↩
-
Data in this pipeline is a snapshot taken in summer 2023, with adjustments made following the Prime Minister’s October announcement of HS2 phase 2a, 2b and HS2 East cancellation. The NICP includes major infrastructure and construction schemes funded by the public and private sectors which exceed certain capital thresholds, see Annex D for further detail. There is some overlap with the Government Major Projects Portfolio (GMPP), but coverage is not equivalent. ↩
-
Sectors included in the pipeline are explained in more detail in Annex D. Investment figures may not align with other sources due to differences in definition, inclusion criteria, or base year for price comparisons. ↩
-
Figures for HS2 phase 1 are current estimates for the completion of Phase 1 from Birmingham to Old Oak Common and then to Euston, at the time of publication. Any cancellation cost implications of the Prime Minister’s 4th October announcement have yet to be worked through and are therefore not covered in the pipeline estimates. The pipeline dataset does not account for cost implications of any changes in phase 1 scope at Euston or other parts of the route. ↩
-
See Annex C for further information on devolved matters and infrastructure pipelines in Scotland, Wales and Northern Ireland. ↩
-
Includes projects/ programmes in the pipeline with geographic point locations provided. ↩
-
Calculated from the total investment in England and total England population, rather than the average of the regions. ↩
-
Notable exclusions include Sizewell C, which has not provided profiled expenditure for commercial reasons, and the Network North package of transport investment, which will provide full details on delivery profile in future iterations of the pipeline. ↩
-
E.g. certain government programme funds, or long term future energy generation investments. ↩
-
Future government spending reviews and agreed settlement periods will confirm the shape and funding mix of sectors into the longer term. ↩
-
This covers existing projects and programmes where additional private investment opportunities exist. ↩
-
Totals are based on specific planned projects/programmes in the pipeline, not including energy generation modelling. ↩
-
See Annex A for further methodological notes. ↩
-
Includes public, private and mixed funding sources. ↩
-
Read more in the Boston tidal barrier, UK: adapting to climate change and delivering social outcomes. ↩
-
MMC use in the energy sector is not fully represented in this data as MMC information is not available for a large element of pipeline energy investment (modelled data from the Renewable Energy Planning Database (REPD) and DESNZ energy generation forecasts). ↩
-
Chart based on the mid-point of the workforce estimate range ↩
-
See the latest Review of the Shortage Occupation List at Migration advisory committee ↩
-
Construction occupations where median pipeline demand is 15%+ of existing UK workforce, as measured by ONS Labour Force Survey and CITB estimates. See The Skills Construction Needs (CITB/ CSN, 2023). Comparable data on total workforce for non construction occupations was not available for analysis. ↩
-
Estimated maximum contract value ↩
-
At the time of data collection, procurements in health and social care had been identified but no final funding budget had been confirmed ↩
-
As at March 2023 Economic and fiscal outlook (PDF, 1,845KB) ↩
-
Where necessary, adjustments are made to account for rare economic shocks such as the Covid-19 pandemic. ↩
-
See ‘Other energy generation to 2025’ and ‘Other energy generation 2025 onwards’ lines in the pipeline dataset. ↩
-
Regional investment figures do not include all of the planned investment pipeline due to the limitations cited above and in section 3 of the report. ↩
-
Wales infrastructure investment strategy project pipeline - december 2022 ↩