Where we have identified any third party copyright information you will need to obtain permission from the copyright holders concerned.
This publication is available at https://www.gov.uk/government/publications/most-similar-forces/most-similar-forces-user-guide
This user guide provides a non-technical overview of the Most Similar Forces methodology and presents the resulting force groupings and similarity scores. It is intended to help users understand what the groups are, how they can be used, and where to find the accompanying data tables.
1. Introduction
Most Similar Forces (MSFs) are a way of grouping police force areas (PFAs) across England and Wales based on demographic, socio-economic, and environmental characteristics related to weighted crime and anti-social behaviour (ASB) rates.
Comparing a PFA with any other, or the national average may not always be appropriate as each PFA has its own context which impacts policing demand. MSFs allow for fairer comparisons by grouping together forces that share similar demographic and socio-economic characteristics.
It provides each PFA with a similarity score to all other PFAs (Most Similar Forces: Annexes, Annex C), and a set of 7 similar most similar PFAs (Most Similar Forces: Annexes, Annex B) that can be used for comparisons and benchmarking rates of crime and ASB weighted by the police response cost.
2. Methodology
To build the MSFs, we compiled a dataset covering 45 indicators (Most Similar Forces: Annexes, Annex A) for all force areas in England and Wales. We then used statistical techniques to select the indicators that are the strongest predictors of weighted crime rates.
We define weighted crime rates as the combined rate of crime and ASB, weighted by the unit cost from the Police Activity Survey (Police Activity Survey - GOV.UK).
Because some types of crime and ASB take up more police resources than others per incident, this weighting ensures that differences in the crime and ASB type composition forces face are accounted for.
The selected indicators are:
proportion of residents with low educational qualifications
unemployment claimant rate
proportion of rented households
proportion of households with no access to a car
employment deprivation score
proportion of the population aged 10 to 15
urban road length as proportion of area.
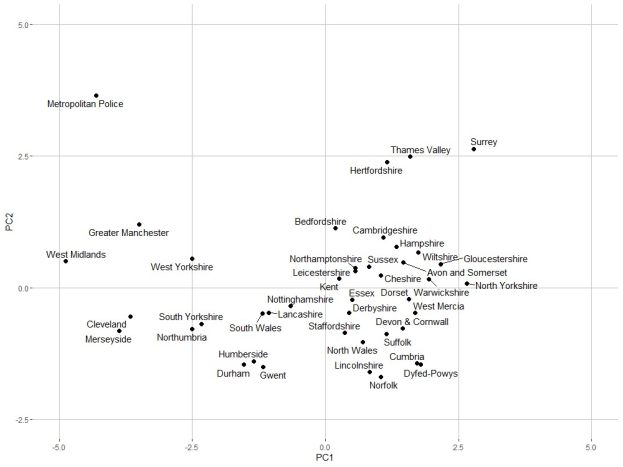
Based on these indicators we use statistical techniques to calculate how similar each PFA is to every other PFA to group them together. We did this using Principal Component Analysis which compresses the indicators into fewer variables. The result of this is shown in Figure 1, where PFAs close to each other are similar in terms of the selected indicators.
We use the straight-line distance between PFAs in Figure 1 as a measure of relative similarity, where the 2 PFAs which are the furthest apart of the graph have a similarity score of 0, and if 2 PFAs were identical they would have a similarity score of 100. Each PFA is grouped with its 7 most similar areas which results in 42 force specific groups[footnote 1], where each PFA has its own unique group.
The average similarity score of group members is 87. Sussex has the group with the highest average similarity score of 94, whereas the Metropolitan Police has the group with the lowest average similarity score of 50. This methodology is described in detail in the accompanying technical report.
Figure 1: Scatterplot of police force areas; Distance on graph represents similarity
3. Using Most Similar Forces
We intend these groups and the similarity scores to primarily be a tool to compare weighted crime rates. They may also be used for metrics that are closely related to weighted crime, or where the metric being compared is expected to be related to the 7 selected indicators used to create the groups.
Users should familiarise themselves with the accompanying technical report before using these groups, as it contains technical details for users to consider. They also need to validate their application and can refer to the full list of similarity scores (Most Similar Forces: Annexes, Annex C) to make bespoke comparisons of either a tighter or wider group as is deemed appropriate. A higher similarity score may indicate that comparisons are more appropriate as opposed to when the similarity scores are lower.