Environmental Monitoring For Health Protection (EMHP); wastewater monitoring of SARS-CoV-2 in England: June 2021
Published 29 July 2021

© Crown copyright 2021
This publication is licensed under the terms of the Open Government Licence v3.0 except where otherwise stated. To view this licence, visit nationalarchives.gov.uk/doc/open-government-licence/version/3 or write to the Information Policy Team, The National Archives, Kew, London TW9 4DU, or email: psi@nationalarchives.gov.uk.
Where we have identified any third party copyright information you will need to obtain permission from the copyright holders concerned.
This publication is available at https://www.gov.uk/government/publications/monitoring-of-sars-cov-2-rna-in-england-wastewater-monthly-statistics-june-2021/environmental-monitoring-for-health-protection-emhp-wastewater-monitoring-of-sars-cov-2-in-england-june-2021
Data showing the concentration of SARS-CoV-2 RNA detected in wastewater by the EMHP wastewater monitoring programme.
Background on the EMHP wastewater monitoring programme
People infected with coronavirus (COVID-19) shed the virus during daily activities such as going to the toilet and blowing noses. The virus enters the sewer system through sinks, drains and toilets. Fragments of the SARS-CoV-2 virus (the virus that causes COVID-19) can be detected in samples of wastewater taken from manholes and Sewage Treatment Works (STWs).
The EMHP programme, led by the Joint Biosecurity Centre (part of NHS Test and Trace), tests sewage for fragments of SARS-CoV-2 RNA. Samples are taken from approximately 270 Sewage Treatment Works in England (see figures 1 to 9). Further detail about EMHP wastewater coverage can be found in the publication Wastewater testing coverage data for the EMHP programme.
The programme helps identify where the virus is circulating in England, detecting spikes in prevalence and presence of variants. Findings are reported to national decision makers and local stakeholders on a regular basis, helping to inform national strategy and localised action. It has the benefit of detecting the virus regardless of whether people have symptoms and/or whether they go for testing. Wastewater monitoring complements other testing programmes and public health actions to help protect against the threat of new variants.
As the threat of variants has emerged, the programme now plays an important role in the detection of mutations of the virus, variants of concern (VOCs) and variants under investigation (VUIs). This is done through genomic sequencing of wastewater samples, to provide an indication of where VOCs and VUIs may be present across England. Insights from wastewater monitoring are shared with local and national decision makers, to help inform the action that they can take to stop further transmission.
The programme is led by the Joint Biosecurity Centre and run in partnership with the Department for Environment, Food and Rural Affairs, the Environment Agency, the Centre for Environment, Fisheries and Aquaculture Science, academia, and water companies. It provides coverage of approximately 40 million people across England. The EMHP team coordinates with programmes in the devolved administrations to provide UK-wide wastewater monitoring.
Concentration of SARS-CoV-2 RNA in wastewater samples; 1 June to 28 June
Data are available in the accompanying spreadsheet ‘EMHP wastewater concentration data. June 2021’. The table contains the concentration of SARS-CoV-2 RNA (gene copies per litre) in wastewater samples from the Sewage Treatment Works that EMHP sample from (date range of 28 days; 1 June 2021 to 28 June 2021).
Data and figures 10 and 11 generally show a widespread increase in concentration of SARS-CoV-2 RNA in wastewater throughout June. This is indicative of increasing prevalence. However, this increase is not consistent across all sites; there is variability between STWs, with some showing an overall decrease. Furthermore, any interpretation should be made with careful consideration of the points in the ‘Uncertainty, data quality, and revisions’ section.
Figure 1. Map showing the location of Sewage Treatment Works sampled in the East Midlands.
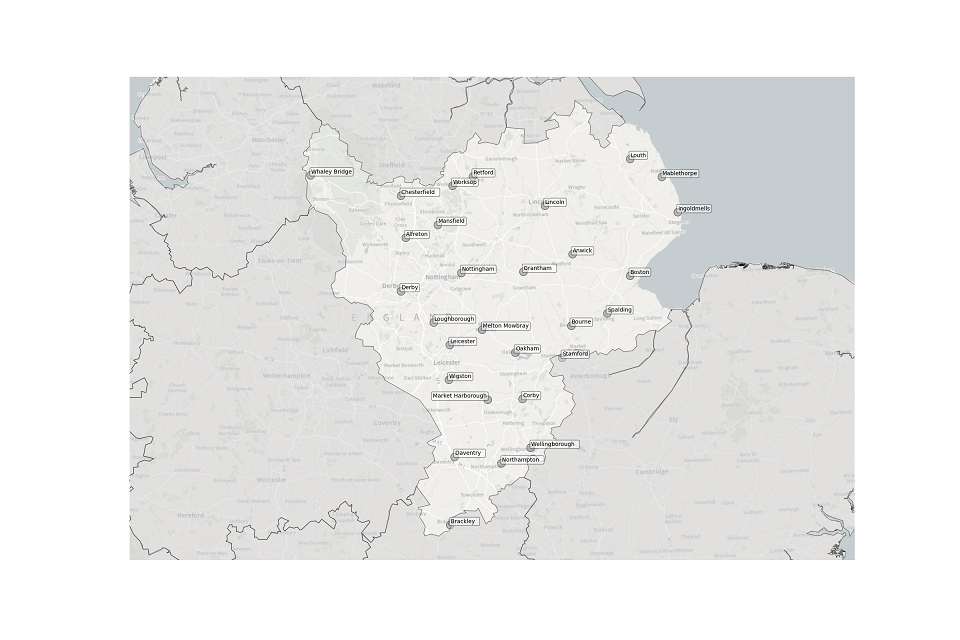
Figure 2. Map showing the location of Sewage Treatment Works sampled in the East of England.
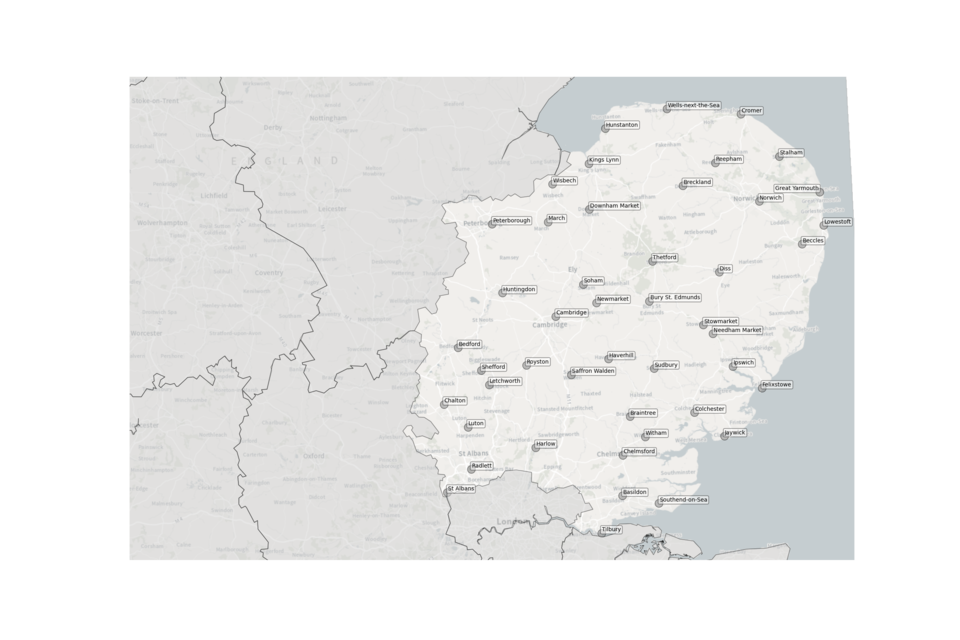
Figure 3. Map showing the location of Sewage Treatment Works sampled in London.

Figure 4. Map showing the location of Sewage Treatment Works sampled in the North East.
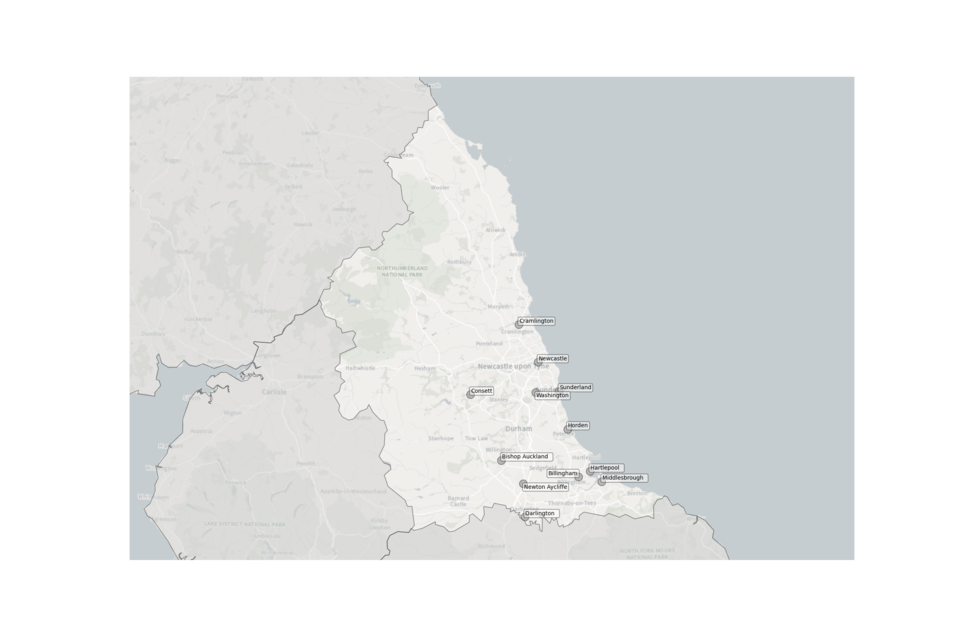
Figure 5. Map showing the location of Sewage Treatment Works sampled in the North West.
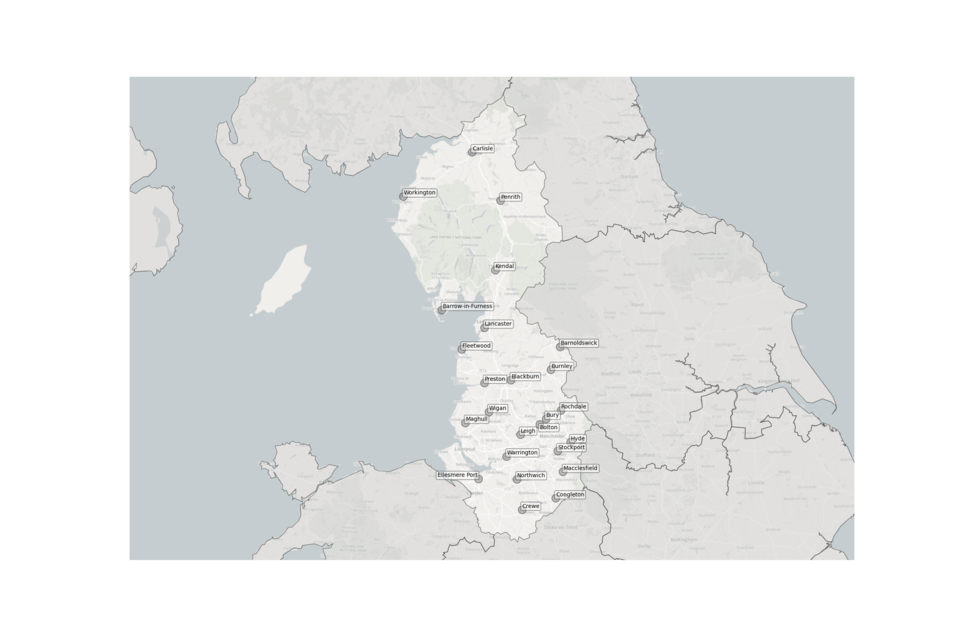
Figure 6. Map showing the location of Sewage Treatment Works sampled in the South East.
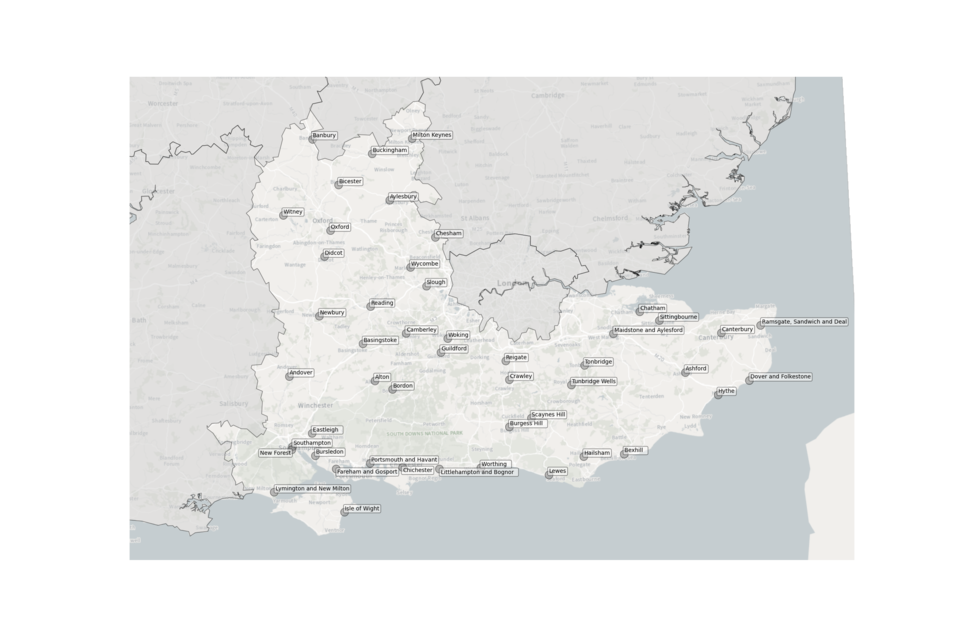
Figure 7. Map showing the location of Sewage Treatment Works sampled in the South West.
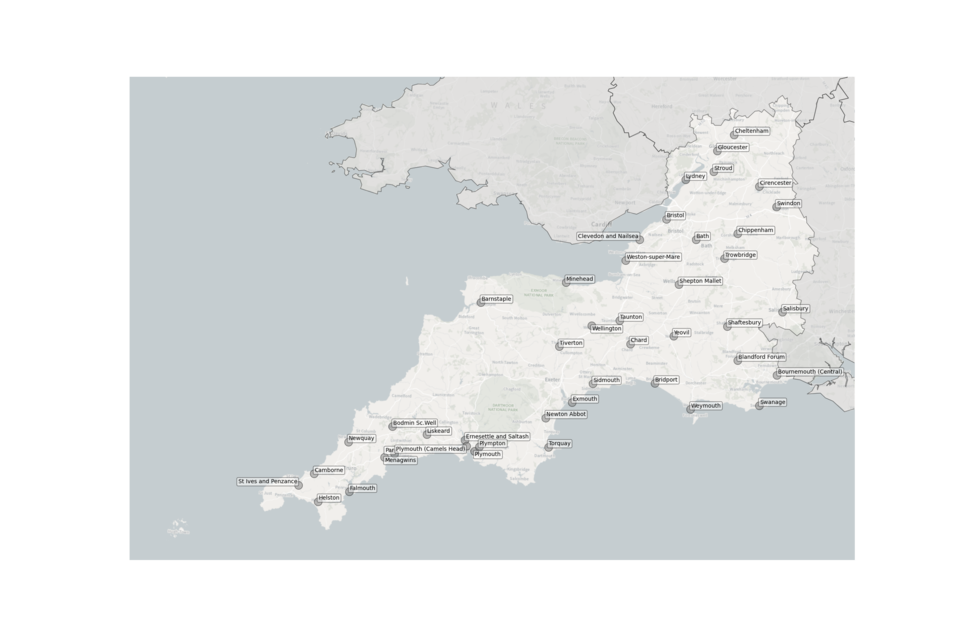
Figure 8. Map showing the location of Sewage Treatment Works sampled in the West Midlands.
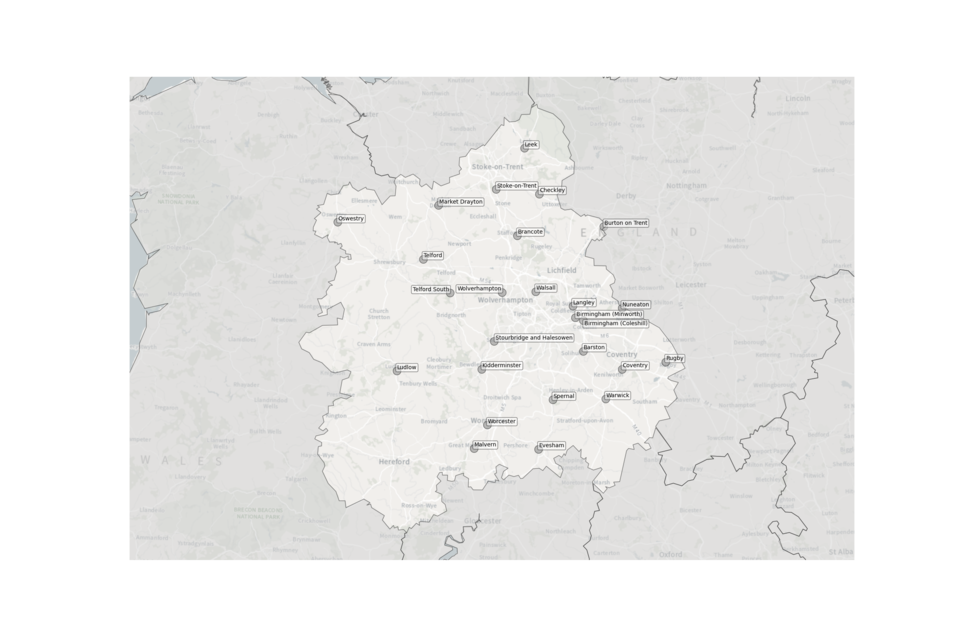
Figure 9. Map showing the location of Sewage Treatment Works sampled in Yorkshire and the Humber.

Figures 10 and 11. England map showing the location of Sewage Treatment Works sampled. Shading indicates the weekly-average SARS-CoV-2 RNA concentration (gene copies per litre). See regional maps for the names of each Sewage Treatment Works.


Methodology
About this data
EMHP sample wastewater from STWs throughout England. Samples are analysed for the concentration of SARS-CoV-2 by quantifying the number of copies of the nucleocapsid gene (N1). Samples are transported to Environment Agency laboratory for quantification of the N1 gene using a process called Reverse Transcriptase Polymerase Chain Reaction. The data reported here are the number of SARS-CoV-2 N1 gene copies per litre of wastewater (shortened to gene copies per litre throughout this document). Generally, the more people with COVID-19 in the community the more viral RNA will be shed into wastewater. Therefore, the concentration in wastewater is indicative of the prevalence of COVID-19 in the community.
Samples are analysed for the concentration of SARS-CoV-2 RNA and concentration is adjusted for flow (see ‘Uncertainty, data quality, and revisions’). Typically, 4 samples per week are analysed from each STW. However, occasionally fewer samples will be collected and/or analysed. This can be due to several reasons such as EMHP altering sampling strategy because of testing capacity constraints, changing epidemiological priorities and current local response activities
Data shows the concentration of SARS-CoV-2 RNA in wastewater (gene copies per litre). The Limit of Detection is the minimum concentration of SARS-CoV-2 RNA the laboratory is able to detect. This Limit of Detection is theoretically 133 gene copies per litre. EMHP assign this concentration to any samples where no SARS-CoV-2 RNA was detected.
We are exploring the feasibility of adding more data in future releases, such as regional summaries and detection of variants.
Data Sources
Wastewater samples are collected by water companies and transported to an Environment Agency Laboratory. Concentration data are from Environment Agency analysis of wastewater samples.
Figures in this publication show the location of STWs. These locations were obtained from the European Commission urban wastewater website. Note that names differ between those used in this document and the European Commission urban wastewater website, sites can be linked using the ‘STW Site Code’ in the attached data tables.
The figures and analysis presented will evolve over time to ensure the most relevant information is included and the needs of stakeholders are met. These figures will initially be published monthly, from June 2021, and we will continuously evaluate the frequency and date-range based on need and public interest.
How these figures can be used
These figures and data can be used to view the concentration of SARS-CoV-2 RNA in wastewater, which is indicative of prevalence in the community. Due to factors relating to data uncertainty, EMHP recommend interpretation of this data with other data sources such Weekly statistics for NHS Test and Trace (England).
Uncertainty, data quality, and revisions
The figures here are compiled by professional analysts and have been quality assured. However, the analytical pipeline to produce this data should still be considered experimental; it is subject to an ongoing quality assurance process. Any revisions to past publications will be in line with DHSC’s revision policy and highlighted in future publications accordingly. The sites from which EMHP sample can change on a regular basis depending on testing capacity, epidemiological priorities and current local response activities. This can result in changes to specific STWs covered. This means the STW included in subsequent publications may change.
This publication shows STWs as single points. Every STW has an associated geographical catchment area (area from which wastewater flows into the sampling location). These catchments are not yet presented in these statistics publications. There is uncertainty surrounding catchment geography, as catchments vary in size and population covered, and in some cases an STW may not be located within the catchment it serves (for example, if wastewater is pumped to the STW). Therefore, the location of STW should be used as a general guide only. For this reason EMHP do not recommend averaging together STW in a single area to obtain region-level figures.
There are several factors that can impact the quality of the signal recorded from wastewater and introduce uncertainty.
The concentration of SARS-CoV-2 RNA in wastewater may be impacted by weather, for example heavy rainfall wastewater may dilution. EMHP mitigate this by adjusting concentration to consider flow.
Whether samples are ‘composite’ or ‘grab’. Composite samples are where an autosampler (a machine which gathers wastewater at regular intervals over a set time period) gathers wastewater throughout the day. Grab samples are where a single sample is taken at one point in the day and are subject to greater variability; they are influenced by flow characteristics, time of day, and are more susceptible to outliers in the sewage. EMHP aim to mitigate this by sampling during times of peak load and ensuring the sample is collected mid-stream rather than close to the edges or bottom of the pipe.
For the above reasons EMHP advise caution when directly comparing data between Sewage Treatment Works.
If you would like to give user feedback please email Testandtrace.statistics@dhsc.gov.uk.