Measuring the economic social and environmental value of public sector location data
Updated 22 August 2022

© Crown copyright 2022
This publication is licensed under the terms of the Open Government Licence v3.0 except where otherwise stated. To view this licence, visit nationalarchives.gov.uk/doc/open-government-licence/version/3 or write to the Information Policy Team, The National Archives, Kew, London TW9 4DU, or email: psi@nationalarchives.gov.uk.
Where we have identified any third party copyright information you will need to obtain permission from the copyright holders concerned.
This publication is available at https://www.gov.uk/government/publications/measuring-the-economic-social-and-environmental-value-of-public-sector-location-data/measuring-the-economic-social-and-environmental-value-of-public-sector-location-data
A note from the Geospatial Commission
Location data is fundamentally embedded into our daily lives yet its true value is not well understood. It delivers significant benefits for people, organisations and wider society through the location-hungry services and products that underpin our digital society such as live traffic updates on our phones, tracking construction of new infrastructure, and providing key information for emergency resilience planning.
Location data is used by a diverse range of sectors across the UK economy including the public sector. It is increasingly central to policy development and delivery of key government priorities, such as Net Zero and Levelling Up, following its crucial role in supporting management of the COVID-19 pandemic.
Despite its clear importance as a strategic national asset, public sector projects to invest in the creation, improvement and sharing of location data have struggled to understand, assess and articulate the benefits of the investment – which is a necessity to unlock funding. Describing the value of location data is hard because:
- Value is often realised only when location data is combined with other datasets - Once a location dataset is linked with other subject-specific data, it provides new insights and opportunities that inform decisions and operations. This makes it difficult to fully value the location data at any given point in time, with a high likelihood of being underestimated.
- Value varies depending on the intended use – For example, mobile phone data could be considered more valuable for understanding total hourly footfall on high streets, but less valuable for understanding priority land preservation areas. There is also no one size fits all valuation method for data, which can make the decision about the best approach to estimating value difficult.
- Value can be difficult to foresee - Data may have limited use today but be very valuable in the future following changes in processing capability, technology and/or new needs unknown as of today. This makes it very challenging to predict future value with certainty. Furthermore, location data use can also spill over onto the rest of society and the economy, for example timely location data can provide better routing decisions that avoid congestion areas for drivers, resulting in faster journey times (direct impact). Fewer cars on popular roads will ease congestion leading to a reduction in emissions and pollution improving health outcomes (spill over impact). Such value is not routinely captured.
Existing guidance can provide general frameworks for valuing government interventions, however for the reasons outlined above valuing geospatial data requires a more tailored approach. The Geospatial Commission committed to publishing guidance for measuring the economic, social and environmental value of public sector location data investments as part of Mission 1 of the UK Geospatial Strategy to ‘promote and safeguard the use of location data’, reiterated in our Annual Plan 22/23.
Many of the principles set out in this guidance are also relevant for data investments more generally and support commitments to improve the use of digital and data, as set out in the National Data Strategy and the Roadmap to Digital and Data 2022-2025.
The guidance comprises a practical and proportional seven-step framework providing public sector organisations with the tools necessary to consistently and coherently understand and assess the value of location data such as best practice approaches and tangible case studies. Built on a foundation of existing research information and experiences, the framework aims to empower public sector organisations to more effectively drive the investment case for location data. However, it does not assume that government intervention is the only way to achieve impact in the ecosystem.
We hope the structured approach to considering investments and impacts will also be relevant and beneficial for private sector investment decisions relating to the geospatial ecosystem.
We envision this guidance being used alongside the Commission’s published works - namely the Q-FAIR Assessment and the ABC’s of ethical location data use, collectively working in harmony to form the UK’s national location data framework.
We would like to thank Frontier Economics and the diverse range of organisations and individuals who have contributed to the development of the guidance. We see this guidance as a crucial component of addressing the challenges of valuing location data in an accurate and consistent manner and look forward to working with the community to put it into action.
Geospatial Commission
Executive Summary
Geospatial data, otherwise known as location data, plays a significant role for business success, individual convenience and public sector delivery. It tells us where people and objects are and underpins key services used by organisations and individuals daily. If used effectively, location data drives economic, social and environmental value.
Geospatial data (and data more generally) does not always have an established market price: its full value may only be determined after it has been used or applied. This in turn makes it challenging to understand and appraise the value of new or improved geospatial data and can lead to underinvestment in the geospatial data ecosystem. To support organisations in addressing this challenge, the Geospatial Commission commissioned Frontier Economics to develop a practical framework for appraising benefits in this context.
This guidance provides a methodical, logical and consistent framework for measuring the economic, social and environmental benefits associated with geospatial data investments in the public sector. It is a practical resource to value improvements in location data and/or the wider geospatial ecosystem particularly for public sector bodies when building a business case for investment. These investments include creation or acquisition of new data assets, improvements to or maintenance of existing geospatial data assets, or efforts to support the wider ecosystem.
This guidance focuses primarily on public sector appraisals and is guided by and consistent with wider best practice in the public sector, particularly HM Treasury’s Green Book. This guidance tailors the key principles of the Green Book to geospatial data investments, providing a structured approach to understanding and more effectively articulating its benefits and value.
A number of complementary methods were deployed to build on existing work and address evidence gaps including a targeted evidence and literature review and semi-structured interviews with a range of key stakeholders.
The framework for appraising geospatial investments contains seven steps. These steps are illustrated in Figure 1.
Figure 1: Step-By-Step Framework
-
Articulate rationale and strategic fit of investment
-
Classify type of investment
-
Set out how the investment will affect data characteristics
-
Identify data uses or applications
-
Identify potential benefits
-
Prioritise high impact benefits for further in-depth analysis
-
Assess benefits associated with known & unknown uses
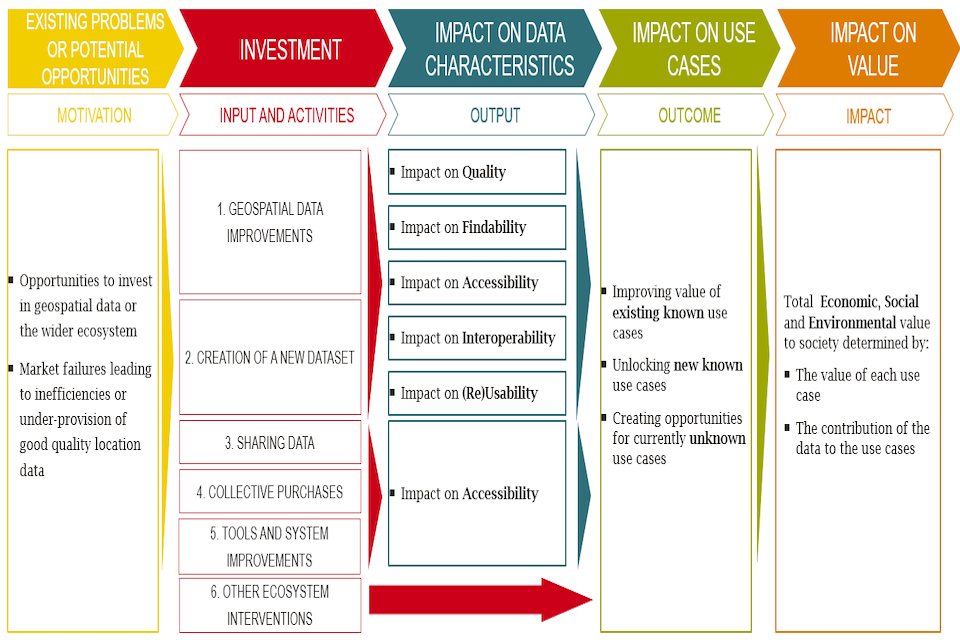
The first five steps of this seven step framework involve development of a conceptual theory of change. This theory of change articulates the rationale behind the intervention, classifies the investment, links it to specific data characteristics (if relevant) and identifies use cases and their benefits. In doing so it enables the user to map out the expected pathways to impact and value.
Steps 6 and 7 relate to the empirical assessment, quantification and monetisation of the benefits included in the theory of change. In general, the user should estimate the value of each use case in full and then consider the specific impact of geospatial data. This approach is broadly applicable and can cover different types of benefits. [footnote 1]
This guidance is intended to be as practically useful as possible, acknowledging the resource constraints that public sector organisations face. Some of the steps cover best practice when developing a business case (e.g. Step 1) whereas others are more novel and are specific to geospatial investments (e.g. Steps 2 and 3). Other steps (e.g. Steps 4, 5, 6 and 7) can be thought of as cross-cutting advice that are key elements of an impactful business case. The guidance can support both decision makers and assessors to better understand and compare the benefits of geospatial data investments.
Introduction
Context
Geospatial data, otherwise known as location data, [footnote 2] describes where places, objects and people are. It takes many different forms and can relate for example to specific building addresses, larger geographic areas, geology or the location of people. There are foundational datasets which relate to the underlying fixed geographic framework (such as addressing and topography), and dynamic datasets which cover spatial patterns of movement by subjects across a fixed geographic framework (such as GPS or mobile phone data).
It plays a significant role for business success, individual conveniences and the public sector delivery. Location data is strategic national asset and underpins a significant amount of activity within the UK economy, society and the environment [footnote 3] as well as existing services used by organisations and individuals daily. These include real-time information on travel disruptions, insurance policies informed by coastal erosion patterns and geo-fenced zones that can support sustainable urban planning.
Public sector organisations operate across multiple areas of the geospatial data ecosystem including the direct supply of geospatial data in some cases. There is a clear economic rationale for this involvement.[footnote 4] For example, compelling commercial motives to supply some forms of geospatial data across all of the UK in a consistent format are not always present, even if there is clear demand for such products. Previous attempts to value geospatial data investments across the public sector have used a variety of different methods and approaches, each with their own strengths, weaknesses and suitability given the context. Challenges in consistently and accurately articulating the value of geospatial data hampers public sector organisations in obtaining resources to fund location data projects. This in turn leads to underinvestment in the geospatial data ecosystem.[footnote 5]
Structure of the report
This report is structured as follows:
- Chapter 1 the introduction
- Chapter 2 sets out general principles and challenges of valuing investments in geospatial data.
- Chapter 3 then presents the entire recommended framework. This covers firstly the rationale for the intervention, broad categories of intervention and the role of data characteristics in determining value. Then potential use cases are set out and benefits associated with interventions are described. Finally, prioritisation of use cases and benefit appraisal methods are considered.
- Chapter 4 presents areas of potential future research which can build on the work undertaken to date.
Annexes:
Annex A presents additional detail on the evidence review and qualitative engagement.
Annex B describes characteristics of data and geospatial data in detail.
Annex C presents theories of change which relate to specific data characteristics.
Annex D sets out example data sources that may be helpful when considering the environmental benefits of an intervention.
Annex E sets out further detail on current methods for valuing location data investments.
Annex F outlines how and when to undertake direct valuation of data.
Accompanying this guidance is a series of case studies demonstrating the application of the guidance to existing investments and interventions by the public sector. Readers are encouraged to use these case studies as learning tools for demonstrating the value of geospatial data investment.
What does this guidance aim to do?
This guidance provides a practical step-by-step framework for appraising the benefits of public sector interventions in the geospatial ecosystem. It is focused on the evidence required for the public sector to make investment decisions. As such the framework that has been developed is consistent with wider best practice in the public sector, particularly HM Treasury’s Green Book. This guidance is a resource to support public sector assessments of value for investments in location data and interventions in the wider geospatial ecosystem when building relevant business cases. Appraisal guidance will also promote the use of location data, improve access to better location data and enable innovation.
What does this guidance not aim to do?
This guidance does not cover all areas of business case development. Nor is the framework intended to be a best practice guide for project evaluation.[footnote 6] This guidance does not aim to provide specific appraisal values or ranges for geospatial data. It is focused on providing a framework for undertaking robust and consistent analysis within a geospatial context. To access public sector funding, an organisation will have to provide a wide range of information. This includes content for each of the standard 5 cases (Strategic, Economic, Financial, Commercial and Management), as set out by HM Treasury’s Green Book. This guidance is not intended to cover all of these areas and should be read in conjunction with other best practice information.
Who is this guidance aimed at?
This framework is intended to be used by both public sector decision makers and assessors. However, the principles of geospatial data valuation will have wider applications beyond the public sector. Private sector organisations who are considering the value for money of geospatial data investments may find it useful to follow some or all of the framework steps, particularly when considering the added value of a particular geospatial solution. This guidance and the underlying framework have been developed with location data in mind. However, many of the challenges that apply to valuation of geospatial data will also apply to other forms of data (which do not contain a locational element). Therefore, the framework described in this document may also be useful when considering investments in data more generally.
When should this guidance be used?
This guidance should be used whenever a public sector body is considering intervening in the geospatial data ecosystem. These interventions could cover creation of data assets, improvements to existing data assets, efforts to support the wider ecosystem and maintenance of existing data assets. It could also cover interventions targeted at making efficiency savings (for example, replacing legacy data, tools and processes).[footnote 7]
This guidance should be used as part of a wider suite of guidance and principles which the Geospatial Commission is developing. This suite will help users to better understand and compare the merits of one investment over another. It includes the Q-FAIR Assessment report, as well as the guidance on Building Public Confidence in Location Data which seeks to support organisations unlock value from sensitive location data whilst mitigating security, ethical and privacy risks.[footnote 8]
How was this guidance developed?
This guidance was informed by evidence that was collected via a number of complementary methods. Frontier’s work was also informed by ongoing communication and feedback with the Geospatial Commission through a series of internal meetings and wider workshops. Overall, the guidance reflects three inputs:
-
A targeted but wide-ranging evidence and literature review. This covered the different types of geospatial data that exist and how to measure the value of data. A full list of sources reviewed are included in Annex A.
-
Qualitative engagement in the form of semi-structured interviews with a range of stakeholders. Topic guides were developed for each interview to ensure that key areas were covered, and interviewees could provide input which aligned with their expertise and experience. Representatives included the Geospatial Commission, public sector holders of geospatial data as well as private and public sector data users. During this phase the primary objective was to identify key geospatial data characteristics that drive value. Potential use cases were also discussed.
-
Case study engagement which consisted of four deep dive examinations into previous geospatial investments. These case studies allowed for further exploration of the different methodologies used to estimate the value of location data, supported by additional desk review using published documentation and material provided by stakeholders. The case studies explore a diverse range of interventions, their impacts and the valuation methods used. The methods and approaches were the key focus to inform development of the guidance. Readers may find it helpful to draw on specific elements of the methodologies used. The four case studies are:
-
National Underground Asset Register (NUAR): This investment involves developing a data-sharing platform to provide a combined, interactive, standardised digital view of the location and attributes of buried assets (such as pipes and cables). This investment addresses the legal, commercial, safety and security concerns expressed by owners of underground assets. These concerns have previously acted as a barrier to bringing together data in a consistent digital format.
-
Public Sector Geospatial Agreement (PSGA): This sets out how Ordnance Survey (OS) provides enhanced location data, services and expertise to the public sector, developers and OS Partners. This has involved significant investments including the provision of improved data sets and facilitating more flexible access to granular data attributes. PSGA members access this data through a customer engagement platform (OS Data Hub).
-
Transport for London (TfL) open data: This example relates to the decision made by TfL to release open information via APIs on timetables, service status and disruption which covers all modes of transport. This decision enables users of the transport network to easily access travel information both through TfL’s Go app, and other customer-facing products and applications created by multiple businesses who use TfL’s open data.
-
HM Land Registry (HMLR) data valuation: HMLR wanted to quantify and evidence the value of its datasets to direct data consumers. This was motivated by an interest in demonstrating the impact of existing datasets and potentially exploring how releasing additional HMLR datasets could drive future economic growth. This model has been applied to four HMLR datasets.
Geospatial Commission
The Geospatial Commission was established in 2018 as an independent, expert committee responsible for setting the UK’s geospatial strategy and coordinating public sector geospatial activity. Its aim is to unlock the significant economic, social and environmental opportunities offered by location data and to boost the UK’s global geospatial expertise. The Commission has a mandate and budget to drive and deliver changes by working in partnership with others.
The Geospatial Commission has a mandate and budget to drive and deliver changes by working in partnership with others. This means they:
- Provide strategic oversight of the geospatial ecosystem in the UK, setting geospatial strategy, policy and standards.
- Hold the budget for the public sector’s largest investment in geospatial data; and
- Make targeted investments in data projects that accelerate innovation and adoption of geospatial data applications.
Principles and challenges of valuing location data Investments
This chapter presents overarching principles which apply to geospatial investments and articulates some of the key challenges with carrying out robust and proportionate benefit appraisal.
Characteristics of Geospatial Data which make valuation challenging
Considering the value of location data investments has several complexities:
(1) Market prices for data might not reflect its full value
- Location data has a wide variety of applications and its benefits often spillover, generating economic, social and environmental benefits that accrue beyond the direct users of the data. Externalities (both positive and negative) occur when benefits or costs are felt by those not initially involved in the initial exchange or use of the data. For example, better vehicle routing based on live road congestion data can lead to less congestion and less air pollution. This results in fewer adverse health outcomes in citizens. These benefits are not captured by market prices, which could result in underinvestment. The full extent of the value generated by geospatial data needs to consider a wide range of potential use cases as well as the direct value, indirect value and spill-over effects for each use case, which can be difficult to assess in full. Some data has very widespread economic, social and environmental value, for example identifiers that provide a ‘golden thread’ to enable other datasets to be linked together.
(2) There are dependencies to extracting value from geospatial data
-
The value of geospatial data may only be fully realised when combined with another dataset. Location data is unique in that it offers spatial insights that can help answer and inform a vast array of potential policy questions. However, given the wide range of potential applications,[footnote 9] it is difficult to be comprehensive and foresee the full breadth of potential impacts. Furthermore, combining datasets may raise important ethical and privacy considerations which may act as a barrier to achieving the full economic, social and environmental value that location data can drive.
-
The value of geospatial data is often one of multiple inputs into enabling decision making. In order to unlock the full value of geospatial data complementary investments in software, hardware and skilled people will be required. The United Nations Initiative on Global Geospatial Information Management (IGIF) has defined nine strategic pathways which can enable the efficient use of geospatial information - reflected in the UK Geospatial Strategy’s 4 missions. One of these pathways is data. However, this needs to be supported by other investments, including: (i) governance, (ii) standards and (iii) capacity building programmes. Geospatial data appraisals should consider the extent to which these supporting factors are in place when assessing potential benefits.
(3) There are uncertainties around when or where benefits can arise
-
Geospatial data can have a large option value (value of retaining options for the future). When valuing location data, it is important to consider existing and potential use cases which may not fully materialise until after the investment has taken place. Some location data today may not seem useful. However, given the right advances in technology, processing capability or changes in societal challenges, it could be important for future applications [footnote 10]. This large option value increases the complexity of any geospatial investment appraisal relative to other forms of appraisal. This particular characteristic is likely to apply to geospatial data to a greater extent than other forms of data because geospatial data has a particularly wide range of potential uses (and does not have suitable substitutes). As a result, the need for a logical and clear articulation of benefits is especially important. This guidance will provide a common framework for this.
-
Geospatial data is an experience good. Its full value is usually determined after use as the suitability of a dataset will vary from one use case to the next. Specific datasets have known traits and characteristics that make them suitable in some situations but not others. For example, aggregated mobile phone data can inform hourly footfall into a city. However, this same dataset is less valuable for understanding habitat preservation areas (unlike SSSI [footnote 11] or AONB [footnote 12] datasets). This makes value appraisals inherently more difficult.
As a result, valuation approaches for location data interventions are not always straightforward. Methods are wide ranging, divergent and inconsistent. Some approaches are expensive and resource-intensive to deploy but highly specific. Others are not sufficiently detailed to inform an assessment of value but require less resources. Chapter 3 sets out the recommended framework that provides the best balance between resource requirements and specificity, enabling a consistent valuation of location data investments.
Importance of joining up across Government
When considering the value of geospatial data, it is vital that public sector organisations are coordinated. Additional value will be generated where different forms of data are brought together and where multiple worthwhile use cases can be identified.[footnote 13] The potential positive implications of this integration should be considered as part of any valuation exercise. The geospatial ecosystem is evolving rapidly and there are common themes and trends that affect multiple public holders of geospatial data simultaneously. These could include improvements in technology and changes in data users’ requirements.
Therefore, multiple public sector holders of geospatial data may face similar decisions about how to improve existing data assets. There may be opportunities to share learnings across different organisations, or if requirements are similar enough, opportunities to acquire data collectively and more efficiently. Likewise advances in technology may mean that certain types of geospatial data can now be provided in a cost-effective way by the private sector. Thus, the optimal role played by multiple public sector organisations in relation to geospatial data may need to evolve over time.
Step-by-Step Framework
The question of how best to value data assets has been considered in previous research. A detailed assessment of methods that have been used in the past is presented in Annex E covering their strengths, weaknesses and when the method is most appropriate. This assessment informed the development of the framework, which is now presented in this chapter. The methods are broadly categorised into three groups: cost-based methods, market-based methods and use-based methods. This chapter sets out our recommended use-based method to value the benefits of location data use - referred to as the “use case approach” from here onwards. This approach is intended to be a proportionate way of capturing value, maintaining analytical rigour and integrity.
Overview of Framework
The framework contains seven steps:
-
Articulate rationale and strategic fit of investment
-
Classify type of investment
-
Set out how the investment will affect data characteristics
-
Identify data uses or applications
-
Identify potential benefits
-
Prioritise high impact benefits for further in-depth analysis
-
Assess benefits associated with known & unknown uses
The first five steps involve the development of a conceptual theory of change (see Figure 3 below). Step 1 articulates the rationale behind the intervention, Step 2, classifies the investment to identify potential gaps or overlaps in intended impact, Step 3 links the investment to specific data characteristics (if relevant) to determine drivers of change to potential applications and uses, whilst Steps 4 and 5 identifies these use cases and potential benefits. Steps 6 and 7 relate to the empirical assessment, quantification and monetisation of the benefits included in the theory of change. Further detail on each step is contained in the following sections. Note that in some cases, Steps 3 and 4 may require more than one iteration in order to be as comprehensive as possible.
Figure 3: Stylised Theory of Change
Existing problems or potential opportunities> Investment> Impact on data characteristics> Impact on use cases> Impact on economic, social and environmental value
Source: Frontier based on desk review and qualitative engagement
Step 1: Strategic Rationale
Prior to the detailed appraisal of economic, social and environmental benefits, it is vital to articulate the underlying rationale for the specific investments in the geospatial data ecosystem and their Strategic Fit.[footnote 14] Strategic Fit may encompass exploration of the underlying problem or opportunity, links to other programmes as well as congruence with policy objectives (see figure below).
Figure 4 Framework Step:1
- Articulate rationale and strategic fit of investment
- Classify type of investment
- Set out how the investment will affect data characteristics
- Identify data uses or applications
- Identify potential benefits
- Prioritise high impact benefits for further in-depth analysis
- Assess benefits associated with known & unknown uses
Figure 5 Elements of strategic fit
- Opportunities or market failures
- Links to other similar projects/programmes
- Links to wider policy objectives
This assessment will generally be included within the Strategic Case of any business case. [footnote 15] Moreover, the impact of data investments will be maximised when supporting investments, such as in capabilities and infrastructure, are made.
Opportunities or Market Failures
The underlying rationale for specific investments will vary depending on the context. These could relate to addressing a specific problem or seeking to take advantage of an opportunity. Q-FAIR (Quality, Findable, Accessible, Interoperable and Reusable) is the Geospatial Commission’s initiative to establish systematic improvements to the UK geospatial data ecosystem. The first Q-FAIR report presents current approaches to using FAIR principles and how their application may benefit users, helping organisations think about problems and opportunities in a consistent way.
Links to Other Similar Projects/Programmes
It is recommended that organisations undertake the necessary due diligence on relevant programmes either existing, planned or underway across the public sector and note how they interact. Organisations should highlight why their proposed intervention either contributes to, enhances or, in some cases replaces existing programmes and projects. The types of programmes that will be considered are highly specific to the intervention under consideration.
Links to Wider Policy Objectives
In particular, organisations should think about how best an investment aligns to the UK Geospatial Strategy, which is aimed at enabling the government to unlock opportunities from location data. This will ensure the use of geospatial data helps to drive broader value by aligning with where the UK is focusing its collective effort, such as science and technology, levelling up and net zero.
Strategic Rationale
The Strategic rationale for the investment under consideration needs to be articulated by the responsible organisation. There are several questions that the organisation should answer to help to tease out this underlying rationale and identify the right investments:
- What is the current situation and why is it not optimal (i.e. what are the opportunities or issues)? [footnote 16]
- What would happen if no action were taken (i.e what is the counterfactual)? 3 What are the goals/objectives of any potential investment? 4 Who are the main stakeholders that any potential investment could impact? 5 Has the organisation making the case for investment engaged with these stakeholders to identify or validate the potential opportunities or issues? 6 Has the organisation thought about and set out a clear list of options for potential investments? 7 How will the investments contribute to the goals listed above? 8 Do the investments have anything in common with other recent investments made in this context by other public sector bodies? Were they successful or unsuccessful? Why? 9 Are there any ethical and privacy risks that need to be considered or mitigated? 10 What are the technical challenges associated with the investments?
The Counterfactual for Investment
Describing the rationale for investment will also require establishing and articulating the counterfactual against which any potential investments would be assessed. In many cases the appropriate counterfactual will be continuation of the status quo. This would be the case where for example a new data set under consideration would never be developed in the absence of public sector investment.
In other cases, the ongoing evolution of technology means that a new data set will be provided by the private sector at some point in the future, which can make the setting of the counterfactual challenging. In these cases, it is important for organisations to engage with stakeholders to understand the progress and scope of this evolution, to then recognise how public sector interventions may be accelerating its development or reducing associated risks.
Step 2: Identifying and Classifying the Type of Investment
There are many possible location data interventions to address a given situation. After determining the overall Strategic Fit of the potential investment (see Step 1) it is important to categorise the various investment options that are being considered to identify any gaps or overlaps in impacts. The specific opportunities and problems identified in Step 1 through Q-FAIR will require different types of solutions. The impact of investing in different categories of investment are described in detail in Step 3 and Annex C.
Table 1 shows a number of different investment categories that have been defined as part of this work. These have been informed by past investments [footnote 16] and potential future interventions identified across a range of stakeholders (see Annex 2) and aimed at making it easier for organisations to consider where their intervention is best classified. [footnote 17]
Figure 6 Framework Step:2
- Articulate rationale and strategic fit of investment
- Classify type of investment
- Set out how the investment will affect data characteristics
- Identify data uses or applications
- Identify potential benefits
- Prioritise high impact benefits for further in-depth analysis
- Assess benefits associated with known & unknown uses
Each investment will have its own: (i) underlying rationale which motivates the deployment of public resources; (ii) data characteristic groups most likely to be impacted (if any); (iii) common use cases that may be unlocked; and (iv) economic, social and/or environmental benefits that may occur as a result of the investment.
Annex C sets out examples of Theories of Change for different types of investments - broadened out to QFAIR categories. Responsible organisations may refer to these examples to help understand the likely impacts of their own investment.
Table 1: List of Geospatial data investment categories
| Investment Category | Explanation | Example |
|---|---|---|
| Improving or maintaining existing geospatial datasets | These are aimed at either maintaining the current contents of existing datasets or improving its quality and interoperability. For improvements, quality affects the specific contents of the dataset, whilst interoperability changes how the data can be used with other data. [footnote 19] These investments can ensure current applications can continue or improve current use cases as well as unlock future use cases to foster innovation, productivity and economic growth. | Maintaining: HM Land Registry have valued some existing datasets which require ongoing maintenance and curation. Future decisions can be guided by this valuation exercise. Improving: The Public Sector Geospatial Agreement (PSGA) replaced the previous Public Sector Mapping Agreement (PSMA) and improved the characteristics of a range of geospatial data assets. The PSGA built on the existing OS offer and facilitated the provision of new, richer data. The PSGA enabled the release of four new OS OpenData products improving data interoperability, including key unique identifiers such as Unique Property Reference Numbers (UPRNs) and Unique Street Reference Numbers (USRNs).[footnote 20] |
| Creation of new dataset | New datasets are typically created to address an identified problem or opportunity. However, a new dataset can have additional uses beyond its primary purpose. These additional uses may be unknown at the time of creation, thereby unlocking more value than initially anticipated. Coordination issues or the absence of commercial incentives mean that certain geospatial datasets do not exist nor are properly maintained by the private sector. This can occur at the national and regional level because the investment costs are high or because the data provider will not be able to capture resulting benefits. However, the investment could yield significant benefits to both users and wider society at large, meaning public sector intervention may be required. | The British Geological Society created the GeoCoast package of datasets to inform and support coastal management and adaptation. Use of this data can facilitate greater understanding of coastal erosion risk, can ensure that coastal defences are placed in the optimal locations and also improve the accuracy of insurance premia. |
| Data sharing policy | Improvements in geospatial data sharing policy seek to make data more available, usually at an affordable price (as set out in licensing terms and arrangements). These tend to affect the findability and accessibility of data, which can open up a wide range of use cases. These use cases can generate new markets, increase competition within existing markets and foster innovation. This sort of investment tends to improve the findability and accessibility characteristics of geospatial data and increase the potential pool of users. Interventions in this category may also reduce administrative and data handling costs amongst the current user base. The associated benefits often relate to efficiencies, productivity and economic growth. Access to affordable geospatial data reduces the barriers to entry for small companies and organisations that could not make use of the data before. The resulting commercialised products and applications can generate jobs and support economic growth. | Transport for London (TfL) made data on timetables, arrivals/departures, service status and disruption openly available to users in stages since 2009 [footnote 21]. Following this intervention, over 600 apps were released based on TfL data and analysis in 2017 suggested that annual economic benefits and savings of up to £130m for travellers, as well as 500 jobs generated in London as a result of this data sharing and subsequent commercial usage. |
| Collective purchases | Collective purchase of geospatial data involves centralised purchasing for a range of public bodies or centralising the licensing agreements for geospatial data. These investments may reduce duplication and lead to cost savings and public sector efficiencies. These investments also have a positive impact on the accessibility of data if new bodies gain access to the data for the first time. | The Geospatial Commission is exploring the use of centrally funded, collective purchase arrangements for geospatial data sets to deliver public sector wide access. For example, having already secured access to aerial photography data for all public sector bodies. |
| Tools and systems improvements | This category of geospatial investments covers developments of data platforms and other mechanisms to aid in the use and dissemination of geospatial data. Depending on the improvement, this can affect the findability, accessibility, interoperability and reusability of a dataset. | The National Underground Asset Register (NUAR) is a data-sharing platform providing a combined, interactive, standardised digital view of the location and attributes of buried assets (such as pipes and cables). |
| Other ecosystem interventions | Interventions outside of those categories above are also important. The United Nations initiative on Global Geospatial Information Management (UNGGIM) has defined nine strategic pathways which can enable the efficient use of geospatial information. One of these pathways is data. However, this data pathway needs to be supported by other investments in the other pathways which include governance, policy, standards and education. Therefore, these supporting investments aim to unlock the full value of existing geospatial assets. | The Geospatial Commission has previously convened a Skills Forum. This forum has a diverse and cross-section membership seeking to enhance the UK’s geospatial capabilities, skills and awareness |
Step 3: Data Characteristics and Links to Q-Fair
This step relates to how a specific intervention is likely to affect data characteristics. The value that can be extracted from a geospatial data asset will depend on its inherent characteristics. Investments to change the data may alter these traits and have knock-on effects on value. An existing data asset’s value will depend on how relevant current traits are for different uses and applications. Understanding how an intervention will affect data characteristics will also help identify relevant use cases and subsequent benefits that can then be valued. These latter stages are covered in the subsequent steps of this guidance.
Some geospatial interventions may not directly alter any characteristics. When appraising the value of investments which do not lead to any change in data characteristics Step 3 of the framework does not need to be followed.
Equally, when valuing whole datasets for the purposes of informing decisions about continued maintenance, we recommend responsible organisations follow a similar methodology to HM Land Registry (see accompanying case studies, Case Study 2 – HM Land Registry) by conducting a Q-FAIR assessment of the data and engaging closely with stakeholders before using the approaches set out in Annex E and Annex F to assess value.
Figure 7 Framework Step:3
- Articulate rationale and strategic fit of investment
- Classify type of investment
- Set out how the investment will affect data characteristics
- Identify data uses or applications
- Identify potential benefits
- Prioritise high impact benefits for further in-depth analysis
- Assess benefits associated with known & unknown uses
Previous work has identified a longlist of data characteristics which can impact on value [footnote 22] by affecting the demand or supply of a dataset. The full list is in Annex B. For the purposes of this guidance a subset of the most relevant geospatial data characteristics has been identified in Table 2.
Table 2: Short list of data characteristics
| Characteristic | Description |
|---|---|
| Where is the data (Location of storage and use) | Where is the data stored and to what jurisdiction is it subject to |
| Source | From where the data has been collected, purchased, obtained or transformed |
| Ownership | Who owns the data from a legal perspective |
| Licensing | Legal instrument specifying the terms and conditions around using and (re)sharing the data |
| Open/Excludable | How data can be accessed: is data freely available or is it part of a private market |
| Price / Cost | For excludable data, what is the price / cost of purchasing it |
| API / ability to query | Software that allows a user to obtain the data filtered and organised as requested by the user |
| Anonymised | Data where the details have been removed so a person cannot be identified by name, address, etc. |
| Ability to (re)share (open source) | Determined by the licensing agreements, open data that can be freely (re)shared |
| Liabilities and risks (from the supplier and passed on to the user) | Legal responsibilities that may trigger a financial loss for the data user, originated at the moment the data was collected (e.g. phone data, with names and addresses) |
| Confidentiality | Protection against disclosure of sensitive or personal information |
| Usage restrictions | Type, duration and source of the limitation to the use of the asset |
| Permissions | Authorisation that allows users to access the data |
| Support | Whether the data is in digital, analogue or mixed format |
| Format / Structure | Defined structure for the processing, storage, or display of data |
| Joinability / Linkability | Number and type of data assets with which it can be linked |
| Unique identifiers | Variable in a dataset that serves as a key or reference to pin down a particular observation |
| Standardised | Formatted in a way such that it conforms with common guidelines |
| Coordinates | Groups of numbers that indicate the position to a point, allowing different layers to come together |
| Authoritative / Reputable source | Trusted to being accurate and reliable |
| Audit trail / Lineage | A record that provides evidence on the sequence of activities and transactions that affected the data |
| Liabilities and risks (for the user) | Potential legal responsibilities that may trigger a financial loss and/or a reputational damage for the data user if they do not comply with the usage restrictions in the data |
| Completeness | Proportion of missing values |
| Consistent / Coherent | Proportion of data-points recorded in the same way |
| Representativeness / Generality | Size of the group/population to which the data refer |
| Interpretable / Good metadata | Ability to be understood and to derive insights, accounting for any potential caveats and limitations |
| Accuracy | Proportion of correct data-points |
| Timeliness | Whether the data asset is real-time, delayed or historic |
| Time Series | The data includes several data periods. Suitability for before and after analysis and to control for more factors. Key driver of the descriptive, analytical and predictive power of the data |
| Granularity / Precision / Resolution | How precise are the data-points in the asset (level of detail) |
| Relevant subject matter | What does the data asset refer to and is it useful for the given purpose |
Source: Frontier review of evidence. The Value of Data Assets. A report for the Department for Digital, Culture, Media and Sport. Frontier Economics. In press.
Note: The short list of data characteristics includes data characteristics that can be targets for investment and may determine fitness for purpose for one or more use cases.
Investments in data assets tend to impact a group of interrelated data characteristics. To acknowledge these interdependencies, relevant characteristics have been grouped into categories which are fully consistent with Q-FAIR. Thinking in terms of groups of characteristics rather than individual traits allows for more practical considerations of impacts, supporting the development of a clear Theory of Change model for decision makers, which maps out the pathway to impact and value.
Project leads considering location data investments should consider the impact on users when undertaking this exercise to identify how their intervention affects the characteristics of data. The figure below sets out groupings of relevant data characteristics that should be considered.
Figure 8: Geospatial data characteristics: Q-FAIR framework
Quality
Objective Quality
“more always better”
Completeness
Consistent/Coherent
Representativeness/Generality
Interpretable/Good metadata
Accuracy
Relevant subject matter
Subjective Quality
“more not always better”
Timeliness
Time Series
Granularity/precision/Resolution
Findability
Where is the data saved/published?
Is the data easily searchable?
Discovery metadata
From an authoritative/reputable source
Have an audit trail/lineage
Accessibility
Ownership of the dataset
Licensing arrangements for the user: Open/Excludable, Price/Cost
Liabilities and risks (for the user)
API/ability to query location data
Size
Interoperability
Processing requirements: Support, Format/Structure
Joinability/Linkability: Unique identifiers, Standardised, Coordinates
(Re)Usability
Anonymised
Ability to (re)share (open source)
Confidentiality
Administrative costs associated with: Usage restrictions, permissions
Source: Frontier
Note: It is important to consider some of the “accessibility categories” separately, since some investments may impact value in conflicting directions. For example, an investment to open data will make it available for more users and new use cases will be unlocked. However, additional administrative costs may come up in order to minimise liabilities and risks for the user to ensure that confidential information is not disclosed.
Quality characteristics can be classified into objective and subjective quality characteristics. Objective quality characteristics are likely to be relevant to most data applications whereas subjective quality traits will be key to determining value only for particular data applications. The quality of the information will be generally determined according to how relevant it is to the use case.
Findability characteristics determine whether the dataset is easily discovered, and the relevant data users are aware of the data’s existence. Certain traits such as the reputability of the source and the quality of the metadata are key to finding data and determining fitness for purpose.
Accessibility characteristics relate to how easy it is to obtain the data. This could include the existence of licensing requirements and whether or not the data is open. More accessible data will allow users to make personalised queries to better understand the data.
Interoperability characteristics determine how easy it is from a technical point of view to use a dataset and merge/link it with other data assets. The structure of data, the availability of unique identifiers and level of standardisation will determine whether the dataset can be used for certain use cases. These characteristics will also determine whether other use cases may be unlocked by being combined with other data.
Reusability characteristics determine whether and how the data can be used to generate value through its (potential) use cases. Reusability characteristics may be related to data security and data governance which impact how data can be used beyond its initial purpose. Certain characteristics such as the level of anonymisation may facilitate handling the data, whereas others such as confidentiality requirements may impose additional administrative costs.
Investments may impact multiple characteristic groups. For example, an investment focused on improving data access by opening up the data may simultaneously lead to the imposition of user restrictions in order to mitigate confidentiality risks, affecting both accessibility and reusability. Understanding what data traits are affected by an intervention is a key part of benefit appraisal.
Step 4: Identifying use cases
Use cases are the ways in which individuals and organisations use or apply location data assets. After determining how an investment option is likely to impact data characteristics (Step 3), organisations should consider any use cases that may be impacted by these changes. An intervention may add value to existing use cases and/or unlock new applications. In some cases, Steps 3 and 4 may require more than one iteration in order to be as comprehensive as possible. Only after these use cases have been considered that the benefits should be appraised (appraisal set out in subsequent steps).
Figure 9 Framework Step:4
- Articulate rationale and strategic fit of investment
- Classify type of investment
- Set out how the investment will affect data characteristics
- Identify data uses or applications
- Identify potential benefits
- Prioritise high impact benefits for further in-depth analysis
- Assess benefits associated with known & unknown uses
Improvements in data characteristics should be targeted at the likely application of the data. In some cases, increasing the frequency of data collection may add value. For example, a frequently updated dataset on the height of buildings may allow users to determine potential risks associated with drone flights in an area. However, at other times, more up-to-date data adds little extra value but bears additional costs.
Examples of use cases
The table below provides examples of use cases associated with various geospatial datasets. This is not intended to be an exhaustive list. Within these examples, location data can allow users to: improve measurement and monitoring (e.g. of how well current policies are working), uncover patterns and trends, make better decisions and deliver better services.
Table 3: Examples of use cases for datasets
| Use case category | Description |
|---|---|
| Local government – education | Local authorities use census data to plan resources such as school places |
| Retail location planning | This is an industry where location of stores in relation to customers is very important. Small area census data are used extensively to maximise returns on investment |
| Utilities | The main water and sewerage companies in England and Wales use census data to plan new investment and monitor leakage |
| Utilities | Excavators need to identify underground assets to dig safely without striking an underground asset |
| Marketing | Geospatial data can be used to facilitate the better adoption of location-based advertising. |
| On-site efficiency and project savings | Excavators need to identify underground assets data so that workers can efficiently orientate themselves on site. Geospatial data can also be used to facilitate digital surveying |
| Site planning and data exchange | Project planners need to identify the location and attributes of underground assets to avoid project delays. Data needs to be shared through a central platform so asset owners can efficiently respond to data requests |
| Construction | Geospatial data can be used to support the optimal route locations for new pipelines or power lines |
| Conveyancing and mortgage lending | Used in the transfer of the legal title to (of) property from one person to another |
| Tax collection | The administration and efficiency of property tax collection is reliant on accurate geospatial data on the location and status of buildings |
| Transport | Businesses such as Waze, Google, Apple and Citymapper can create customerfacing apps to improve the travel experience |
| Housing, land use and planning | Developers can use data to understand impact of construction process on local species |
| Planning | Planners use a range of data (including risk assessment information, environmental data, and land use data) to identify critical and vulnerable infrastructure assets. This allows for better understanding of risks and disaster response planning. Geo-demographic data can also be used by urban planners to forecast demand for public services for example |
| Emergency response | Emergency responders need to access up to date information about their environment (e.g. building access point locations and the locations of traffic congestion) to better understand an emergency and can take immediate informed action |
| Natural resource management | Data is used to ensure land and other natural resources are used sustainably and safeguarded in the long run. This will include data on soil quality, planning permission data and local area air quality data. Location data can also be used to facilitate precision agriculture and automation of farm equipment. Public bodies can use location data to manage the distribution of the support payments they provide |
| Enabling smart infrastructure | Data is needed to support the deployment and optimisation of smart infrastructure such as remote sensors which can enable better management of the road network |
| Managing heritage assets | Data on the location of points of interest can be used to identify sites of archaeological or cultural interest to better protect and safeguard their future |
| Flood risk planning | Geospatial data can be used to understand the likelihood of flooding in a particular location given historical patterns. This type of analysis can provide a holistic view of the entire urban environment and enable better planning for and mitigate of flood events |
| Alternative energy production and distribution | Geospatial data can ensure that organisations know the location of existing infrastructure (in particular electricity). This enables for strategic planning of new renewable energy production, network connections or consumption points (charging stations) |
Source: Frontier based on evidence review and qualitative engagement
Approaches for identifying and categorising use cases
Various evidence sources can be used to create a list of known existing and future potential use cases. The approach used should follow a proportionate approach to appraisal, considering the likely scale of the impact as well as time and resource constraints. Evidence sources could include:
-
Expert internal knowledge: public sector holders of geospatial data have a good understanding of how their datasets are used. They may have also proactively identified areas where potential improvements would add value
-
Previous appraisals or evaluations: previous appraisals or evaluation of similar investments may have focused on particular benefits or use cases.
-
Direct discussion with stakeholders: this could include data users, industry stakeholders, members of the six partner bodies to the Geospatial Commission, or the Geospatial Commission itself. This is an effective method, but care may need to be taken to ensure that the views presented are representative (readers may wish to consider more formal expert elicitation approaches to help ensure balanced views [footnote 23], but this is not a requirement). This is relevant here as this method will typically involve a small sample size and typically be more practical to undertake given resourcing constraints.
-
Focus groups/stakeholder workshops: this involves gathering together a panel of informed stakeholders (e.g. data users), industry bodies or a trade association. Care needs to be taken to ensure that the views presented within the group are likely to relate to the full population.
-
Questions in Government consultation documents or discussion papers: these publications present an opportunity to formally invite responses.
-
Surveys: conducted using a representative sample.
-
Qualitative interviews with specific stakeholders: this process typically involves targeted and open questions with specific stakeholders (including feedback from existing users) to understand key problem areas or opportunities in depth.
Engagement with stakeholders tends to be more effective when stakeholders are familiar with the data (given that data is an experience good). In contrast, where discussions relate to unfamiliar data, this can make it more challenging for users to conceptualise potential use cases. In these circumstances, appraisers should consider articulating these in a way that relates to the user’s experience of using similar types of data.
Known Vs Unknown use Cases
For an existing dataset, some use cases will already exist and be enhanced or changed following an investment. Other use cases will be new and enabled for the first time, with some more challenging to predict.
For the purposes of this guidance three categories of use case are defined:
-
Known use cases which either exist currently or can be predicted to develop in the future with a relatively high level of certainty and granular understanding of users and associated economic, social and environmental benefits. For example, improving or maintaining UKHO data will allow for continued use by the commercial shipping market for safe navigation.
-
Known Unknowns relate to specific future use cases which can be identified at some level (“known”) but are subject to some uncertainty (“unknown”). For example, investing in the collective purchase of aggregated mobile phone mobility data across the public sector may have applications in relation to planning decisions or infrastructure. However, predicting each of the precise applications ahead of time is challenging.
-
Unknown Unknowns are use cases which are not possible to predict (“unknown”) with any level of confidence ahead of time (“unknown”). These are more likely with investments which affect a wide range of stakeholders, such as accessibility, findability, and interoperability which can increase the potential user base of the data asset. For example, improvements in technology or the emergence of specific societal challenges or behaviour change may lead to applications for current data which are not currently foreseeable.
Step 5: Identification of benefits
Step 5 sets out the types of benefit an intervention could generate. Holders of location data should use this step to make informed decisions about data access policies based on the scale of public good it can generate.
Figure 10 Framework Step:5
- Articulate rationale and strategic fit of investment
- Classify type of investment
- Set out how the investment will affect data characteristics
- Identify data uses or applications
- Identify potential benefits
- Prioritise high impact benefits for further in-depth analysis
- Assess benefits associated with known & unknown uses
Benefit categories
Investments that improve existing use cases or create new use cases can ultimately lead to a range of benefits. Benefits created by geospatial data use cases will tend to fall into one of three broad categories:
-
Economic benefits affect the economy at a local or national level and capture changes to the location and volume of economic activity.[footnote 24]
-
Social benefits cover wider impacts on individuals from an investment and capture the extent to which people’s ability to live happy and healthy lives are impacted.
-
Environmental benefits cover any change to the natural environment and landscape, whether adverse or beneficial, resulting from an intervention.
Identification of benefits should cover all three categories. Examples of benefits that fall under each category are outlined in Figure 11 below. These examples are not intended to be comprehensive, and a specific intervention may generate different benefits.
Figure 11: Examples of Economic, Social and Environmental benefits
Economic Value
- Business creating more employment or becoming more productive (allowing for higher wage premia);
- Creation of international trade opportunities
- Reductions in business travel or commuting time;
- Governments delivering public services and policy making more efficiently;
- Interventions which increase human capital can have positive labour supply effects;
- Avoidance of economic disruption associated with negative outcomes (eg resilience planning)
- Appraisers could also consider changes in the structure of the economy, benefits from dynamic clustering or agglomeration
Environmental Value
- Impacts on air quality;
- Reductions in greenhouse emissions;
- Improved water quality;
- Reduced risk of flooding;
- Improvements in stock of natural capital (this includes both the living and non-living aspects of ecosystems). Stocks of natural capital provide flows of environmental or “ecosystem’ services over time;
- Better management of biodiversity and natural landscape
Social Value
- Impacts on physical activity;
- Reductions in accidents and mortality;
- Improved longevity and quality of life;
- Reductions in leisure travel time; and
- Reductions in crime
Source: Frontier based on review of evidence,
Notes: Useful data sources that can help inform assessments of economic value are included in Annex D
Central to the approach of this guidance is the notion of proportionality. In some instances it may be pragmatic to value specific high-priority benefits, whilst in other situations it may not be worthwhile. This is discussed further in the next subsection.
Appraisers should balance the level of effort and resources required to assess the direct, indirect and spillover effects of an intervention against the resources available. Thought should also be given to the practicality and feasibility of the benefits being realised. In particular, considering what processes, tools and other dependencies that might act as limiting factors.
Beneficiaries and other affected parties
Alongside identifying benefits, it is important to identify beneficiaries and all potential stakeholders who may be affected by the data intervention (both positively and negatively - where the latter is referred to as disbenefits), in-line with HM Treasury Green Book. Relevant stakeholders may be (i) upstream producers, gatherers or acquirers of information; (ii) data users, (iii) those who manage, transform, or store data, (iv) those who use the data to set policies or standards, and (v) wider members of society who may be impacted indirectly.
Like many other forms of data, the value of geospatial data will not solely accrue to the data user. Value can be subdivided into several different categories, based on who the value accrues to:
-
Direct use value: where value accrues to users of geospatial data or data assets. This could include the public sector using geospatial data to better manage public assets like roads and highways. These are typically more straightforward and common to assess as they are more immediate and certain.
-
Indirect use value: where value is also derived by indirect beneficiaries who interact with direct users. This could include users of the public assets who benefit from better public service provision. These are typically less straightforward as some dependencies that affect the behaviour and activities of affected parties, which are less certain
-
Spillover use value: value that accrues to others who are not a direct data user or indirect beneficiary. This could, for example, include lower levels of emissions due to improved management of the road network by the government. The benefits of lower emissions are felt by all of society, even those who do not use the road network. These are typically the most challenging to assess as there are further dependencies and factors that can affect behaviour, making them the most uncertain category.
Logic models and theories of change
The first five steps of the guidance can be summarised in a theory of change diagram. For the purpose of this guidance a logic model framework has been used to highlight the mechanisms by which geospatial data investments could produce value. Logic models are recognised as best practice within evaluation and appraisal guidance - see HM Treasury Magenta Book.
Theories of change prompt the appraiser to identify key aspects of an investment and highlight the causal link from inputs and activities to expected outputs, outcomes and impacts. These are helpful in theoretically stress-testing the relevance of potential investment options. In particular, they can:
- Articulate how various options are expected to work, setting out all the expected steps to achieve the desired outcome;
- Identify where the uncertainties and risks lie (i.e. what assumptions the investment relies on and why it may or may not work, including any supporting evidence);
- Draw any commonalities in outcomes and impacts from investments aimed at particular data characteristics or parts of the geospatial ecosystem; and
- Establish a clear narrative and link between types of investment, data characteristics, use cases and feasible valuation methods.
For the purpose of this guidance, the first five steps of the framework can be summarised in the general theory of change below. Annex C sets out more detailed theories of change associated with investments that impact data quality, findability, accessibility, interoperability and reusability.
Figure 12: Generic Theory of change for geospatial data investments
This figure sets out a theory of change for geospatial data investments, covering 5 stages: (1) Existing problems or potential opportunities (2) Investment (3 )Impact on data characteristics (4) Impact on use cases (5) Impact on value
Source: Frontier,
Note: Annex C sets out more detailed theories of change associated with investments that impact data quality, findability, accessibility, interoperability and reusability.
The accompanying case study report sets out how the logic model framework has been applied in previous geospatial data interventions. Only certain elements of each case study have been explored in detail as part of this work. More detailed explorations of each case study can also be found in the accompanying case study report.
Key takeaways from the case studies
Variation: the four case studies illustrate the significant variation in context that applies to individual data investments. This in turn leads to a wide variety of potential economic, environmental and social impacts. These diverse impacts are linked to geospatial investments in particular (relative to other forms of data investment). As described in the following subsection this has implications for the valuation methods used. In particular this reinforces the importance of tailoring approaches to specific investments.
Benefit appraisal: the case studies also reinforce some of the benefit valuation challenges that were discussed in Section 2. In particular externalities associated with geospatial data’s usage and the lack of established markets for geospatial data may require specific attention.
Stakeholder engagement: finally, the case studies all emphasise the importance of stakeholder and user engagement. This engagement is crucial to understand use cases and provide context for the investment’s rationale.
Step 6: Prioritisation of benefits
This step describes how to prioritise effort when considering the impact of a geospatial data investment on a wide range of potential benefits and use cases that were identified in previous steps of the framework.
Figure 13 Framework Step:6
- Articulate rationale and strategic fit of investment
- Classify type of investment
- Set out how the investment will affect data characteristics
- Identify data uses or applications
- Identify potential benefits
- Prioritise high impact benefits for further in-depth analysis
- Assess benefits associated with known & unknown uses
Certain investments may lead to a large number of potential use cases. As such, it may not be proportionate or possible to quantify and monetise all benefits that relate to each of these use cases.
Prioritisation criteria
In line with best practice included in HMT’s Green Book the appraiser should focus on uses cases / benefits which meet the following criteria:
- They are expected to generate the largest economic, social and environmental impacts;
- They are perceived to be most important to stakeholders; and
- They are quantifiable via proportionate analysis.
These criteria can be used to create a shortlist of high priority use cases.
Prioritisation Methods
There are multiple approaches that can be used to aid with prioritisation decisions.
-
Internal discussion:For relatively low-cost investments, prioritisation could rely on internal expertise and market experience within the appraising organisations to assess different use cases / benefits against the criteria listed above.
-
Stakeholder engagement: As noted above, understanding which use cases are likely to be most important from the point of view of data users is likely to be an important factor in deciding which elements are subject to detailed appraisal. Speaking directly to existing and potential customers could help to inform prioritisation decisions.
-
Multi-Criteria Decision Analysis (MCDA) could also help to identify the best performing use cases for further examination. MCDA is a set of techniques, with the goal of providing an overall ordering of options, from the most preferred to the least preferred option. The extent to which each option meets each criterion can be considered transparently and objectively using both quantitative and qualitative information side-by-side.[footnote 25]
Regardless of the method used, the prioritisation process should be documented and the underlying rationale behind the prioritisation decision should be clearly outlined (including reference to the three criteria above).
Step 7: Assessment of Benefits
Having identified use cases and potential benefits, it is important to understand their significance and where possible quantify and monetise them in a robust way. This is the focus of this step. Assessment should generally consider each use case separately, and consider the most appropriate methodology in each case.
This step outlines a spectrum of methods for assessing existing and potential future known use cases. These include approaches which are (i) fully quantitative, (ii) indicatively quantitative, and (iii) qualitative. While unknown use cases cannot be quantified to the same extent, some of the indicative quantification and qualitative approaches can equally be applied.
As set out in Annex E there are multiple ways that benefits of data can be valued - each of these approaches has their own strengths and weaknesses. Multiple approaches can be used in parallel to assess the benefits, however using different approaches in conjunction with each other does raise the possibility of doubling counting. Extra care should be taken to understand the theoretical and practical underpinnings of the methods in question and the suitability of the approaches for simultaneous use.
Figure 14 Framework Step:7
- Articulate rationale and strategic fit of investment
- Classify type of investment
- Set out how the investment will affect data characteristics
- Identify data uses or applications
- Identify potential benefits
- Prioritise high impact benefits for further in-depth analysis
- Assess benefits associated with known & unknown uses
The figure below outlines a summary of the valuation approaches that this guidance recommends for geospatial data interventions. These approaches are informed by previous work undertaken to value data (see Annex E) and by qualitative engagement undertaken as part of this project. Benefits should be monetised where possible to provide a common metric for comparison relative to the investment costs, however it is recognised that this is not always possible nor practical.
Figure 15: Valuation Approaches
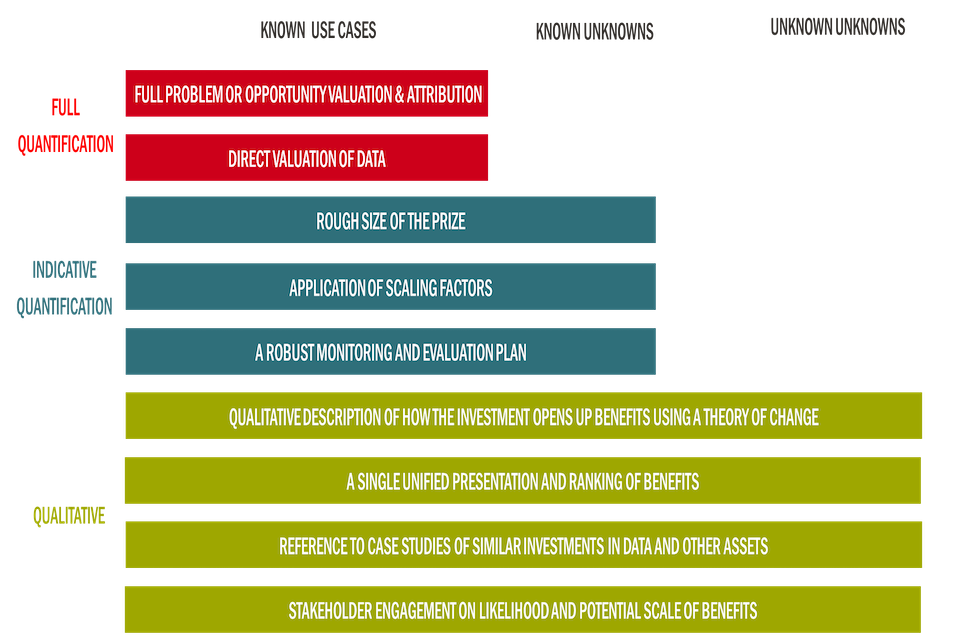
This figures sets out the different methods that are appropriate to use when assessing the three types of use cases: known use cases, known unknowns and unknown unknowns.
Most of the approaches shown in the figure are collectively referred to as the “use-case approach” (barring the Direct Valuation of Data, which are recommended for use in exceptional circumstances). The focus of the use-case approach is to estimate and derive value based on the different applications affected by the geospatial investment. The first category of approaches (full quantification - except direct valuation) is likely only to be feasible when considering the benefits from known use cases. The second category of approaches (indicative quantification) may be most appropriate when considering known unknowns. Unknown unknowns are best tackled using a qualitative approach.
Known use cases: Full problem or opportunity valuation and data attribution
This is the recommended approach for most geospatial data investments assessing known use cases given its specificity, ability to capture indirect and spillover benefits and relatively low resource requirements. Appraisers should first estimate the full cost of a problem or opportunity that a geospatial investment can change (Part 1), covering the economic, social and environmental cost to society as a whole. Then the second step is to determine the contribution of the investment to resolving the problem or opportunity (Part 2). This approach aligns with what is known as “use-based methods” in the literature as set out in Annex E.[footnote 26]
Part 1 Full valuation of the problem/opportunity
The problems/opportunities for the prioritised use cases should first be valued in their entirety. A topdown approach is generally used to facilitate this – starting from a high-level benefit or cost. Examples from the case studies are below:
NUAR
-
Use case: NUAR could help reduce the risk of construction projects striking underground assets. These strikes lead to direct costs incurred by companies such as costs of repair and additional materials (economic costs). They also lead to wider indirect costs (including traffic delays and environmental damage - wider societal and environmental costs).
-
Method: A damage cost approach was implemented in this case to estimate the scale of the current problem. Historical estimates of strike costs were reviewed and used to calculate the average cost across different utilities. This evidence base included both direct economic costs (costs of repair and additional materials) and wider indirect costs (traffic delays, disruption and environmental damage). These average costs were multiplied by the estimated rate at which strikes occur (which came from historical data) to determine the overall cost of the problem.
-
Deployment considerations: The appraiser should use the theory of change developed in previous stages of this guidance to consider what costs are likely to be relevant and whether evidence currently exists for each category (economic, social and environmental)
TfL Open Data
-
Use case: Commuters need access to up-to-date information on travel disruptions when making commuting decisions. If users of London’s travel network do not have the right information they could make suboptimal decisions, have poor travel experiences and spend more time travelling than they should.
-
Method: Travel time savings as a result of better information can be monetised. These impacts fall under the category of economic benefits and represent the value travellers place on preferable activities they can undertake in the saved time. Valuation of this opportunity involved estimating the total amount of time spent by passengers using TfL’s network and multiplying this by standard values for the value of travel time saved which are published by DfT.This will represent the total size of the opportunity
-
Deployment considerations: Appraisers would need to consider who the potential pool of individuals affected are. The type of travel would also need to be considered (commuting, employer’s business, and leisure) as this determines which values should be used.
These examples are not comprehensive. In line with the wide range of potential economic, social and environmental benefits, HMT’s Green Book describes methods that could be used to value other problems or opportunities such as: assessment of subjective wellbeing, valuing the length and quality of life, and valuing abatement in greenhouse gas emissions which could also be used in this context. Annex D provides links to resources that readers may find useful.
Part 2 Attribute the impact of data
The second part involves determining the contribution of the intervention to resolving the problems/addressing opportunities. In many instances, use cases involve geospatial data being used alongside other data and inputs such as equipment and infrastructure. This makes attribution the most challenging part of the valuation process.
Appraisers must first determine whether attribution is plausible and what reasoning can justify the specific proportion assigned to the investment. For example, determining the true marginal impact of TfL’s open data initiative was extremely challenging. The case study concluded that time saved from the third-party applications built from their data was a direct result of the intervention given that those same applications and products would not exist without the initiative.
When precise attribution is attempted, it is acknowledged that some of this analysis will partially be assumption-driven. Appraisers should:
-
Look to rely on the best available evidence and be transparent about any assumptions and level of certainty. For example, by assigning a confidence level supporting the attribution assumption or by testing the robustness of the assumption with sensitivity testing. Evidence used can be established, evolving and developing, and/or indicative.
-
Seek to be consistent in how attribution assumptions are applied across business cases. Starting with standard benchmarks helps with this.
-
Use judgement informed by expertise and input from stakeholders (industry, users, evidence from similar programmes/projects).
Examples of evidence used to guide attribution efforts include:
-
NUAR reduced risk of strikes: The Utility Strike Avoidance Group carried out surveys of utility companies and contractors to determine the cause of strikes. Data from these surveys was analysed to determine the proportion that could be eliminated by better access to geospatial data via NUAR. It is assumed that NUAR could lead to a 30% reduction in strikes based on the proportion of issues that could be potentially linked back to geospatial data, where 5% and 0% were also tested.
-
NUAR total efficiency savings: The NUAR platform will also allow teams to avoid abandoning projects as they can better plan around critical underground assets. Currently a small number of excavations are abandoned and the analysis assumed that 56% of abandonments could be avoided as a result of better access to underground geospatial data, based on the proportion of excavations that involve application of mapping data.[footnote 27]
In addition to the use case specific sources of evidence that were drawn on in the above examples it may also be possible to draw on more generic existing external benchmarks to help provide guidelines for attribution of geospatial data’s impact (see table below).
Table 4: Examples of external attribution benchmarks
| Source | Scope | Method | Estimate |
|---|---|---|---|
| Goodridge and Haskel (2015) | Contribution of big data to UK GDP | Used survey data to compute total labour costs in “big data” occupations and engaged with industry experts to assess the percentage of costs used to build data assets in each occupation | Estimated that in 2010, “big data” contributed £5.7bn to UK GDP equivalent to 0.3% of national GDP at the time |
| Hickling Arthurs Low (2016) [footnote 28] | Macroeconomic impact of geospatial data in Canada | Each sector of the Canadian economy was modelled using economic equations and national statistics data. Across each sector, a detailed literature review was carried out to estimate the importance of geospatial data to output and productivity. | The modelling suggests that geospatial data contributed $22bn per year to the Canadian economy, equivalent to 1.1% of national GDP. The macroeconomic impact varied across sectors and was estimated to be highest in the Mining, quarrying, and oil and gas extraction sector (4.5% of sector output). |
Source:Frontier review of evidence
These estimates can be used as a starting point for the total possible impact of geospatial data in a specific sector.[footnote 29] Relying solely on this type of generic external evidence (even where it is sector specific) is not sufficient. Some tailored use case specific evidence will be needed. A what-if analysis may also be helpful in showing the switching values for attribution levels - that is, the level of attribution needed in order for benefits to equal the spending costs of public sector intervention.[footnote 30]
In exceptional circumstances, it may be relevant and proportionate to value a use case for a specific investment in data directly via methods such as Willingness-to-Pay surveys, without first quantifying the value of the overall use case. However, these approaches are not always practical to implement given resource constraints. Examples of how to apply these approaches are set out in Annex F.
Known unknowns: Indicative quantification
Full monetisation of each benefit associated with each use case is not always practical nor proportionate. This is because, as set out in Chapter 2, geospatial data has a large option value and specific geospatial data assets will have a very wide range of potential uses in some cases, such as with foundational geospatial datasets which can be put to an almost limitless set of uses [footnote 31].There may also be instances where benefits cannot be quantified due to a lack of available information. Examples of benefits that were not monetised were identified in the case studies which informed this framework, such as the indirect benefits of the PSGA or TfL’s Open Data encouraging active travel enabling healthier citizens.
In other cases potential benefits associated with specific use cases can be quantified in an indicative manner which is less precise but also less resource intensive. Options for this type of approach are set out below.
Approximate size of the prize estimates
Description of method: This method involves estimating the scale of the problem or opportunity that could in theory be solved via the intervention under consideration. This method should be used when full valuation of the problem or opportunity (see description above) is not possible.
How to implement: Steps 1 to 5 of the guidance should be used to firstly describe the problem or opportunity under consideration and map out the potential pathway to impact. Assuming detailed inputs do not exist which would allow for precise quantification, a range of proxy information could be used. The proxy information should seek to identify who or what is affected by the problem or opportunity and the extent of that effect.
One opportunity may relate to better management of flood plains. To understand the approximate scale of this opportunity it may be possible to gather information on the number of dwellings in affected locations and combine this with average house prices and an illustrative assumption regarding the negative impact flood risk plays currently (e.g. depresses house prices by 10%). These inputs could then be combined to provide an approximate size of the prize.
This is clearly less precise and requires a number of caveats compared to surveying residents to understand current economic costs or carrying out a systematic review on the link between flood risk and asset prices. However, it may still be beneficial depending on the context of the intervention.
Applying scaling factors to known benefits
Description of method: This method involves starting with a fully monetised benefit and using that as a baseline to estimate other benefits which cannot be quantified.
How to implement: It may be that a specific use case is expected to lead to benefits for both (1) direct data users and (2) wider society as an indirect result of the data’s usage. The benefits that accrue to users themselves may be fully quantifiable via the use-case approach or contingent valuation approach, for example. However, the indirect benefits may be harder to value directly. Scaling factors can be implemented to fill this gap by assuming indirect benefits are some multiple of the direct benefits.[footnote 32]
The size of this multiple could be based on expert judgement within the appraising organisation, consultation with industry and stakeholders, historical evaluation evidence and/or high-level information on the number of potential indirect beneficiaries and the average size per beneficiary relative to direct beneficiaries. This same approach could be used to scale up benefits from one use case to another completely separate use case. However, the limitations and caveats of this approach must be highlighted upfront. Sensitivity testing around these assumptions is also highly recommended.
When these types of approaches are implemented, it is important that the appraiser is clear on why full quantification is either not practical or possible and what justifications they are presenting for the assumptions used. A robust monitoring and evaluation plan should also be put in place after the appraisal to help generate evidence that will allow for more thorough forward-looking quantification of benefits in the future.
Unknown unknowns: Qualitative assessment
Qualitative assessments are typically important when considering unknown unknowns, where it is not possible to monetise benefits (because the level of uncertainty is too high for example). These are still important impacts (and in some instances can be more important than direct impacts) that should be assessed, acknowledged and recorded as part of the wider assessment of value alongside any quantified or indicative benefits. For location data investments, it is often the case that benefits are wide ranging, where its timing and scale is uncertain.
For these non-quantifiable benefits, the qualitative approach should include:
-
Describing in detail how the opportunity is realised. Organisations should use the Theory of Change model developed in Steps 1 to 5 to clearly articulate to decision makers how an intervention is expected to address an identified problem or opportunity, explaining the expected impact and crucially how the impact will occur, as well as any dependencies and risks. This is particularly useful for interventions that affect data sharing policy and impact a wide range of users and sectors.
-
Engagement with stakeholders on the likelihood and magnitude of new opportunities. This could be with data users or industry experts and via interviews or workshops. Organisations may seek to use anecdotal evidence from stakeholders as supporting material to help strengthen the narrative and reasoning behind the expectations of impacts.
-
Referring to benefits achieved in case study investments in data and other similar assets. Similar investments could include for example other investments in similar data characteristics (e.g. other investments in accessibility), or those of similar scale and complexity. International as well as domestic examples may also be relevant.
-
Ranking quantitative and qualitative benefits to illustrate importance. Ranking benefits from largest to smallest, including benefits that cannot be quantified can be beneficial in helping to ensure that unquantified benefits are not neglected when their impacts are still potentially large. A similar option is to use a subjective scale of 0 to 10 to rank the significance of unquantified benefits (which could capture both the number of potential users and the potential impact).
In lieu of quantifiable benefits, a strong narrative and logical reasoning becomes a more crucial element of the case for investment, providing decision makers with a richer picture of how the investment will affect the geospatial ecosystem, specific groups of stakeholders and society more widely.
Future areas of research and next steps
This guidance aims to provide a practical step-by-step framework for appraising the benefits of public sector interventions in the geospatial ecosystem. This will help to achieve greater consistency in approaches used to value geospatial data across the public sector.
This chapter sets out potential future extensions to this guidance and additional research that could be carried out to build on this piece of work and address specific limitations.
Development of standardised values
This guidance has emphasised the value of assessing the benefits of each intervention on a case-by-case basis. In the future it may be worth exploring whether certain standardised values could be developed for specific categories of geospatial investment. These values would suggest likely ranges of impacts for groups of similar potential interventions based on past experience. This would significantly reduce the burden on appraisers but may mean that subtle differences between similar interventions are not fully accounted for.
Significant further work would be required to determine the feasibility of this approach and compile the required evidence base to inform the values.
Private sector data sharing
This guidance has focused on geospatial data investments in a public sector context. Further research could be carried out to build on this work and consider the potential value of incentivising greater private sector geospatial data sharing. Some research has already been carried out in this context. Future work could focus specifically on geospatial data and consider what levers government could pull to incentivise greater private sector geospatial data sharing in an ethical manner.
Assessment of unknown unknowns
As described in the previous sections geospatial data has large option value. Therefore, all potential use cases for a new or improved data asset may not be apparent at the appraisal stage. This makes it very difficult to comprehensively quantify and monetise all future benefits as some of these impacts may arise from “unknown unknowns”.
Going forward it may be helpful to maintain a library of ex-post evaluation evidence which relates to previous geospatial investments. This will mean that evidence on actual benefits realised can be compared systematically to evidence on benefit appraisal estimates produced for the same set of interventions. This comparison will provide information on benefits from “unknown unknowns” that were related to use cases which were not precisely identified at the appraisal stage. In particular it would be helpful to understand:
- Which categories of investment are most likely to produce these types of benefits;
- How large are these benefits relative to the magnitude of anticipated benefits; and
- Whether it would have been possible to anticipate those benefits using different methodologies of approaches.
Annex A - Evidence review and qualitative engagement
A.1 - Literature review
We undertook a non-systematic review of evidence from academic literature and “grey” literature (including think-tanks, international organisations, consultancies, Government publications) on the characteristics of data, data valuation and the case studies.
This involved targeted searches for relevant terms on Google and Google Scholar (e.g., “data asset valuation”; “value of data”), using existing reviews and references included in those, and sources shared with Frontier by the Geospatial Commission and organisation invoked in the stakeholder engagement.
The list of sources reviewed are as follows:
- Almirall, Ros, Craglia, and Moix. (2008). The Socio-economic Impact of Spatial Data Infrastructure of Catalonia. Office for Official Publications of the European Communities
- AlphaBeta (2017). The Economic Impact of Geospatial Services
- Anmut. How To Value Your Data Assets A Methodology
- Athey (2021). The Economic Value of Data for Targeted Pricing
- Bank of England. Cost-benefit analysis of monetary and financial statistics
- Bernknopf and Shapiro (2015). Economic Assessment of the Use Value of Geospatial Information.
- Cabinet Office (2018). An Initial Analysis of the Potential Geospatial Economic Opportunities
- Companies House and BEIS (2019). Companies House data: valuing the user benefits
- ConsultingWhere Limited and ACIL Tasman (2013). Assessing the Value of OS OpenData to the Economy of Great Britain – Synopsis
- Coyle and Manley (2021). Potential social value from data: an application of discrete choice analysis
- Coyle and Nguyen (2020). Valuing goods online and offline: the impact of Covid-19
- Deloitte (2017), Assessing the value of TfL’s open data and digital partnerships
- Deloitte for the Department for Business Innovation & Skills (2013). Market assessment of public sector information
- Eftec et al. (2021), Mapping the Species Data Pathway: Connecting species data flows in England
- European Commission (2020). The European Data Monitoring Tool
- European Data Portal (2015). Creating value through Open Data
- European Public Sector Information Platform (2013). Understanding the impact of releasing and re-using open government data.
- EY. How can we place a value on health care data. [Blog post]
- Farboodi and Singal (2021). Valuing Financial Data Frontier Economics (2021). Increasing access to data across the economy. A report prepared for the Department of Digital, Culture, Media and Sport
- Frontier Economics (2022). Geospatial Data Market Study. Report for the Geospatial Commission.
- Frontier Economics (forthcoming), The value of data assets
- Geospatial Commission (2020), UK Geospatial Strategy 2020-2025
- Geospatial Commission (2021), Unlocking the value of location data [blog post]
- Geospatial Commission (2021). National Underground Asset Register (NUAR). Economic Benefits Paper
- Geospatial Commission (2021). Annual Plan 2021/2022
- Geospatial Commission (2022). How fair are the UK’s national geospatial data assets? Assessment of the UK’s National Geospatial Data
- Goodridge and Haskel (2015). How does big data affect GDP? Theory and evidence for the UK.
- Hickling Arthurs Low, Canadian Geomatics Environmental Scan and Value Study, Geoconnections
- HMLR (2021). Transforming the property market: Annual report and accounts 2020/21
- HM Treasury (2018). The economic value of data: discussion paper.
- HM Treasury (2020). Magenta Book. Central Government guidance on evaluation.
- HM Treasury (2022). The Green Book. Central Government Guidance on Appraisal and Evaluation.
- Hogge (2016). Transport for London. Get set, go!. Govlab.
- Iansiti (2021). The Value of Data and its Impact on Competition
- London Economics (2018). Value of satellite-derived Earth Observation capabilities to the UK Government today and by 2020
- Lowe, J. (2008). Value for money and the valuation of public sector assets.
- Macauley (2005). The Value of Information: A Background Paper on Measuring the Contribution of Space-Derived Earth Science Data to National Resource Management
- Natural Resources Canada, Value Study Findings Report into Canadian Geospatial Data Infrastructure
- ONS (2012). 2011 Census Benefits Evaluation Report
- OECD (2016). Automation and Independent Work in a Digital Economy. Policy Brief.
- OECD (2019). Enhancing Access to and Sharing of Data Reconciling Risks and Benefits for Data Re-use Across Societies
- OECD (2020). Measuring the economic value of data and cross-border data flows
- OECD (2020). A Roadmap toward a Common Framework for Measuring the Digital Economy OECD, a report for the G20 Digital Economy Task Force
- Open Data Institute and the Bennett Institute for Public Policy (2020). The Value of Data: Summary Report Open Data Institute and the Bennett Institute for Public Policy (2020). The Value of Data: Literature Review
- Open Data Institute (2021). Policy to Unlock the Economic Value of Data
- Oxera (1999). The Economic Contribution of Ordnance Survey GB
- Oxera (2013). What is the Economic Impact of Geospatial Services
- Pollock (2011). Welfare gains from opening up Public Sector Information in the UK
- Saunders and Brynjolfsson (2016). Valuing information technology related intangible assets
- Stone and Aravopoulou (2018). Improving journeys by opening data: The case of Transport for London (TfL). The Bottom Line.
- Ubaldi (2013). Open Government Data: Towards Empirical Analysis of Open Government Data Initiatives. OECD Working Papers on Public Governance
- UN - GGIM (2018). Integrated Geospatial Information Framework. A strategic guide to develop and strengthen national geospatial information management. Part 1: overarching strategic framework
- World Bank. Starting an Open Data Initiative. [Blog post]
A.2 - Stakeholder engagement
This report reflects input from the following stakeholder organisations:
- Coal Authority
- British Geological Survey (BGS)
- Ordnance Survey (OS)
- Valuation Office Agency (VOA)
- Her Majesty’s Land Registry (HMLR)
- UK Hydrographic Office (UKHO)
- Geospatial Commission
- Department for Business, Energy and Industrial Strategy (BEIS)
- Department for Transport (DfT)
- Greater London Authority (GLA)
- Natural England
- Department for Levelling Up, Housing and Communities (DLUHC)
- Geolytix
- Groundsure
Annex B – Data characteristics
Table 5: Long list of data characteristics
| Characteristic | Description | Source |
|---|---|---|
| Support | Whether the data is in digital, analogue or mixed format | DCMS |
| Source | From where it has been collected, purchased, obtained or transformed | USGS |
| Size | How big the dataset is, in terms of storage volume (TBs) or number of observations | KPMG |
| Rationale for collection | Why the data has been collected (e.g., legal requirement, service provision, deriving insights) | DCMS |
| Data content / subject matter | What does the data asset refer to (e.g., geospatial data, business data, personal data) | DCMS, Coyle et al |
| Variety | Suitability for cross-sectional / panel analysis and to control for more factors. Key driver of the descriptive, analytical and predictive power of the data | CEBR/SAS |
| Findability | As defined in FAIR principles e.g., are (meta)data are assigned a globally unique and persistent identifier | Go Fair |
| Functional form of returns / Scalability | The extent to which an increase by 10% in the amount of data generates an increase in returns above, below or at 10% | Coyle et al Haskell and westlake |
| Timeliness | Whether the data asset is real-time, delayed or historic | Coyle et al |
| Completeness | Proportion of missing values | PWC |
| Validity | Proportion of invalid data-points (e.g., temperature recorded as “abc”) | GSMA |
| Consistency | Proportion of data-points recorded in the same way | PWC |
| Precision | How precise are the data-points in the asset. E.g. number of decimals or detail on geo-spatial data | Ginsburg et al |
| Accuracy | Proportion of correct data-points (e.g. thermometer being 2°C above or below real value) | Deloitte,PWC |
| Targetability | Extent to which a specific group can be singled out | Deloitte |
| Generality | Size of the group/population to which the data refer (e.g. geospatial data is applicable to the entire population living/active in the area covered) | CEBR/SAS |
| Representativeness | RE the population under analysis: randomised sample, semirandomised, self-selected | Coyle et al |
| Interoperability/ Reusability | Technical standards that allow use of data across systems/platforms | Coyle et alGo Fair |
| Linkability | Number and type of data assets with which it can be linked | Coyle et al, PWC, Haskell and westlake |
| Collection method | The process through which the data has been collected (e.g. scraped online, phone interviews, observed in nature) | DCMS |
| Accessibility/Excludability | How data can be accessed: internal, named, group-based, public, open | Coyle et al |
| Use restrictions | Type, duration and source of restriction to the use of the asset | PWC |
| Ownership | Who owns the data from a legal perspective | Bird and Bird |
| Location (of storage and use) | Where is the data stored and to what jurisdiction it is subject. | Deloitte |
| Liabilities and risks | Type, duration and source of liability and risks generated by the asset | PWC |
| Uniqueness and exclusiveness / scarcity | Number and type of similar data assets available | Deloitte, OECD |
| Functional form of costs / sunkness | Relationship and nature of fixed costs, semi-fixed costs and variable costs associated with the asset | Coyle et al, Haskell and westlake |
| Complementary assets | Investment in other intangibles e.g. copyright, patents, market research required to make use and extract value from the asset | Haskell and westlake |
| User of data (by industry) | In which industry the data is used. This characteristic could be merged with ownership but is presented separately here to reflect how it is discussed in the literature. | OECD |
| User of data (by function) | By which function the data is used. This characteristic could be merged with ownership but is presented separately here to reflect how it is discussed in the literature. | Coyle et al |
| Stage in the data value chain | The phase where the data asset is in its lifecycle. The OECD proposes five stages: collection, aggregation, analysis, use, monetisation. Coyle et al. 7: raw data, processed data, integrated data, analysis, actionable insights, action, (potential) value. | OECD,Coyle et al |
| User of data (by business model) | How is the data used in the organisation(s). This characteristic could be merged with ownership but is presented separately here to reflect how it is discussed in the literature. | OECD,PWC,Deloitte |
Source: Frontier review of evidence. The Value of Data Assets. A report for the Department for Digital, Culture, Media and Sport. Frontier Economics. In press.
Note: This guidance focuses on a subset of this long list of data characteristics that would drive value of geospatial data assets
Annex C – Theories of change
The figures below provide detailed examples of theories of change associated with changes in specific data Q-FAIR data characteristic groups.
Quality
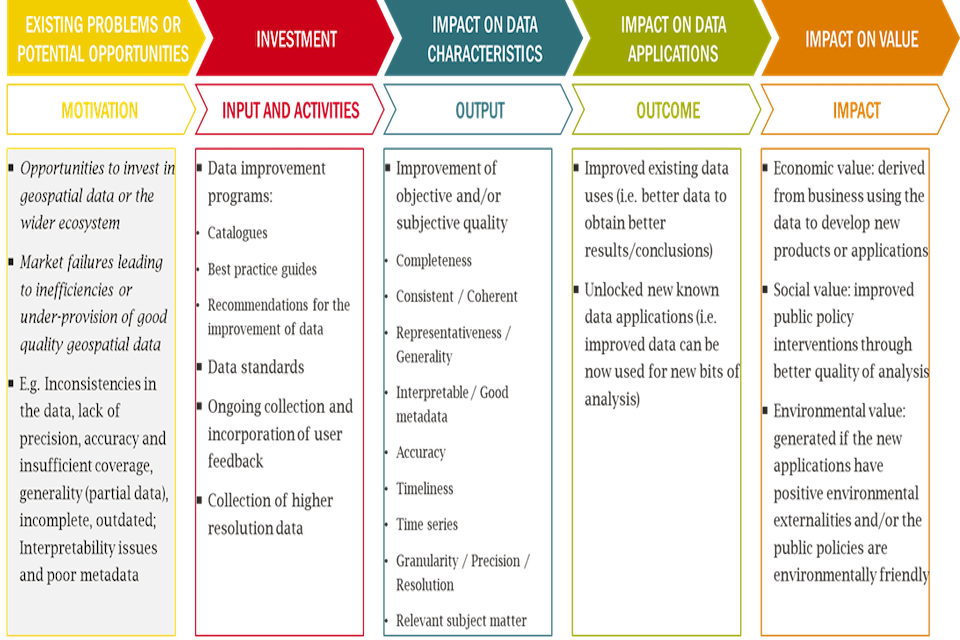
An example theory of change for an investment in geospatial data quality. This covers 5 stages (1) Existing problems or potential opportunities (2) Investment (3 )Impact on data characteristics (4) Impact on use cases (5) Impact on value
Source: Frontier
Note: (i) The existing problems or potential opportunities can be identified by both data users and data suppliers. The Q-FAIR framework is a useful tool to identify the relevant gaps and whether it would be useful from the user perspective to fill them in. (ii) The types of investments undertaken to tackle those problems and opportunities should be linked back to the IGIF pathways
Findability
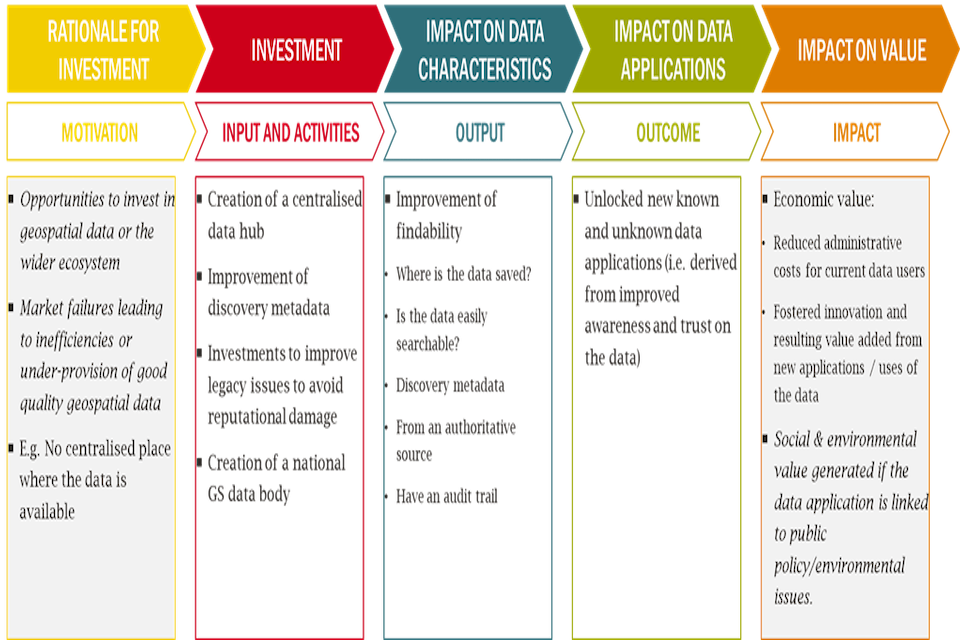
An example theory of change for an investment in geospatial data findability. This covers 5 stages (1) Existing problems or potential opportunities (2) Investment (3 )Impact on data characteristics (4) Impact on use cases (5) Impact on value
Source: Frontier
Note: (i) The existing problems or potential opportunities can be identified by both data users and data suppliers. The Q-FAIR framework is a useful tool to identify the relevant gaps and whether it would be useful from the user perspective to fill them in. (ii) The types of investments undertaken to tackle those problems and opportunities should be linked back to the IGIF pathways.
Accessibility
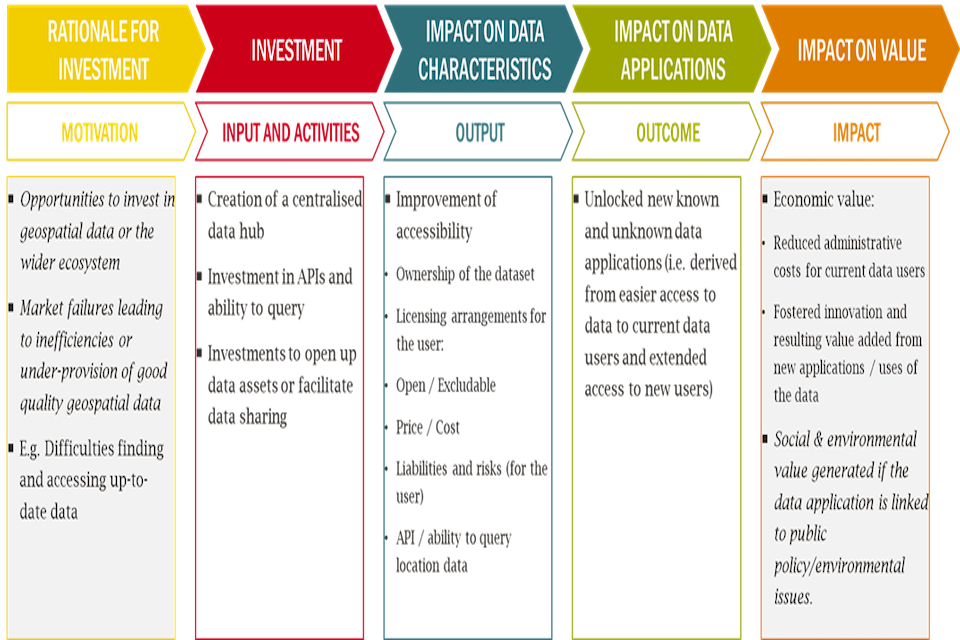
An example theory of change for an investment in geospatial data accessibility.This covers 5 stages (1) Existing problems or potential opportunities (2) Investment (3 )Impact on data characteristics (4) Impact on use cases (5) Impact on value
Source: Frontier
Note: (i) The existing problems or potential opportunities can be identified by both data users and data suppliers. The Q-FAIR framework is a useful tool to identify the relevant gaps and whether it would be useful from the user perspective to fill them in. (ii) The types of investments undertaken to tackle those problems and opportunities should be linked back to the IGIF pathways.
Interoperability
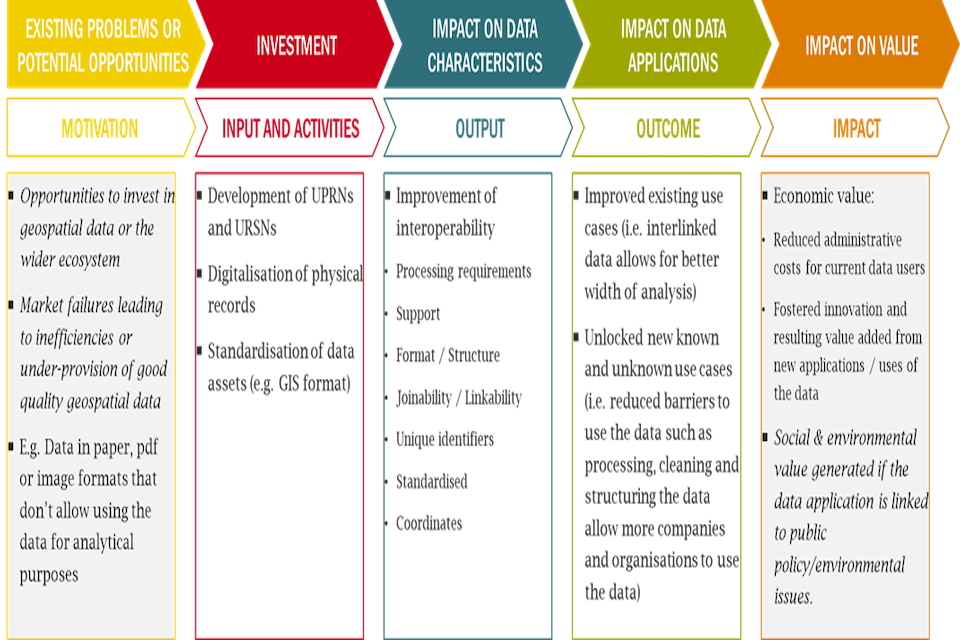
An example theory of change for an investment in geospatial data interoperability. This covers 5 stages (1) Existing problems or potential opportunities (2) Investment (3 )Impact on data characteristics (4) Impact on use cases (5) Impact on value
Source: Frontier
Note: (i) The existing problems or potential opportunities can be identified by both data users and data suppliers. The Q-FAIR framework is a useful tool to identify the relevant gaps and whether it would be useful from the user perspective to fill them in. (ii) The types of investments undertaken to tackle those problems and opportunities should be linked back to the IGIF pathways.
Reusability
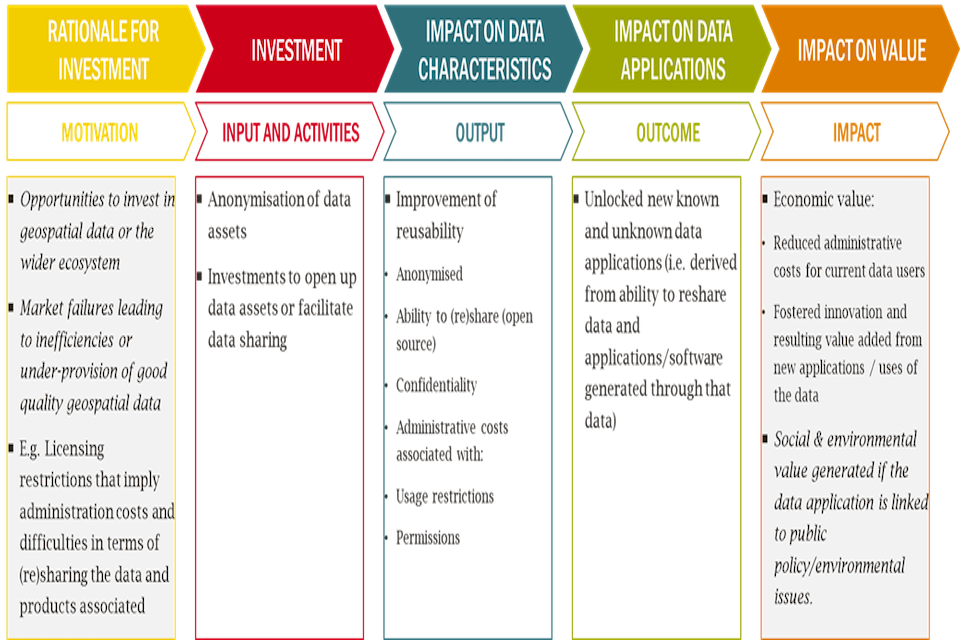
An example theory of change for an investment in geospatial data reusability.This covers 5 stages (1) Existing problems or potential opportunities (2) Investment (3 )Impact on data characteristics (4) Impact on use cases (5) Impact on value
Source: Frontier
Note: (i) The existing problems or potential opportunities can be identified by both data users and data suppliers. The Q-FAIR framework is a useful tool to identify the relevant gaps and whether it would be useful from the user perspective to fill them in. (ii) The types of investments undertaken to tackle those problems and opportunities should be linked back to the IGIF pathways.
Annex D – Environmental appraisal data sources
The table below includes examples of data sources which may be useful when carrying out environmental benefit appraisal.
Table 6: Environmental benefit sources
Annex E – Current methods for valuing location data investments
This Annex outlines categories of methods that have been used in the past as well as considering their strengths and weaknesses. The findings informed the development of the framework which is presented in Chapter 3.
E.1 - Data valuation approaches
The existing literature sets out a variety of approaches for valuing data. These methods can be broadly categorised into three groups: cost-based methods, market-based methods and use-based methods.
E.1.1 - Cost-based methods
Cost-based methods value data according to the costs incurred when collecting, storing and analysing that information. Cost-based methods can be based on historic costs (i.e. costs incurred in production) or replacement cost (i.e. how much it would cost to reproduce an asset). To implement cost-based methods it is necessary to determine which costs should be counted towards the value of a data asset.
Then the assessor must explore how these costs vary over time. Organisations’ financial and accounting information can provide an indication of costs in some cases. However, previous research has shown that organisations rarely value their own data in a comprehensive way[footnote 33]. This can limit the value of accounting information and mean that primary data is needed.
A cost-based approach was used by Goodridge and Haskel (2015) at the entire economy level. The authors estimated that in 2010, “big data” contributed £5.7bn to UK GDP. This estimate was based on survey evidence on total labour costs in “big data” occupations. Similarly, Statistics Canada undertook an estimate of the value of data by looking at labour costs incurred in their production plus associated non-direct labour costs such as the costs of the associated human resource management and financial control, electricity, building maintenance and telecommunications services.However, such approaches do not capture the value to users or wider society.
E.1.2 - Market-based methods
Market-based methods use market prices to value data. These market prices could relate to:
- Market prices of data itself. This is a “bottom-up” method, which reflects current transaction value placed on a traded dataset by the market. One example is a study by the IDC, that estimated the revenues of “data suppliers” in the UK at €1983bn in 2019 This was the aggregated value of all the data-related products and services generated by Europe-based data suppliers.
- Market-based method using market value of companies who make use of data. This a “top-down” method that consists of (i) attributing part of the market value of data-intensive companies to data; (ii) calculating the difference in market value of dataintensive and non-data-intensive companies; or (iii) reviewing the price paid for datadriven companies in acquisitions. Previous studies have for example estimated the proportion of businesses’ market value that can be attributed to Information Technology (IT) assets [footnote 34]. In the future, similar methods could be used to assess more specifically the value of data-related assets.
In terms of data collection and sources, these methods mainly rely on transaction data. Some of this data is publicly available. However, prices charged for data and valuations of equity exchanged outside of financial markets are not always publicly available. In the case of public sector-owned datasets, only some will have a market price. Where that’s not available, some approaches have used a comparable dataset with a market price as a proxy.
E.1.3 - Use-based methods
Use-based methods are a broader group of methods to estimate the value to businesses, consumers or wider society of using data [footnote 35]. Use-based methods estimate the return from using data for businesses, or the willingness to pay for data or data-intensive goods by consumers. This group of methods could include:
- Relative performance of data-intensive firms. The business performance of more “dataintensive” firms can be compared against peers who appear similar but are less dataintensive. Relevant metrics could include productivity, profit margins, or sales. For example, Brynjolfsson, Hitt, & Kim (2011) found that US firms that adopt data-driven innovation have output and productivity that is 5-6% higher than what would be expected given their other investments and information technology usage.
- Specific benefits of data use. Data also has a range of other specific use benefits which are discussed in detail in Chapter 3. AlphaBeta (2017) estimated that digital maps reduce travel time by 12% on average, that consumers value digital maps at up to $105 per user per month and that geospatial data saved consumers more than 21 billion hours in 2016, with related reductions in congestion and pollution.
- Contingent valuation: This focuses on the benefits of data more directly, according to how it serves the end user’s demand. Contingent valuation often uses surveys to ask consumers and data users about their willingness to pay or accept changes in a data asset (or a data-driven product). Coyle & Nguyen (2020) applied contingent valuation techniques to estimate how much consumers value different ranges of digital and physical goods and services.
- Real options valuation: This focuses on the estimation of the value of data where the future benefits of its use are uncertain. Value is estimated as a function of the current benefits of data use, the variance of these benefits, and the cost of developing or accessing the data. This method estimates the option value of data – that is, the value of being able to purchase and use it in the future. In theory, this method should implicitly account for both the opportunity cost of purchasing the asset earlier as well as the future benefits generated by the asset.
These methods will often use econometric techniques to estimate the value of an asset according to its uses. The key challenge for these methods is whether the standalone impact of an asset can be isolated from other contributing factors to firm/consumer outcomes. In some cases, the methods are particularly resource and time intensive.
E2 - Comparison of Methods
The table below sets out the strengths and weaknesses of each of the three methods described above. It also describes where different approaches are likely to be appropriate.
Table 7: Strengths and weaknesses of each method
| Method | Relative Strengths | Limitations and Weaknesses | When the method is appropriate |
|---|---|---|---|
| Cost-based methods | Widely applicable to different industries,Consistent with valuation approaches applied to other assets (e.g. in Energy, Telecoms and Water sectors),Where available, can be useful benchmarks of potential scale | Underestimates value when data is by-product from other activities so cost of production is low,Depends on willingness of organisations to share this information (potential commercial sensitivity),Weak indicator of future value. Therefore not well suited to determining potential value of new applications. Likewise less useful to assess the impact of policies that aim to improve certain characteristics of data assets | Cost-based methods are best-suited to very broad valuations of data (e.g. across the whole economy), and examples where the value of data is stable over time, Due to their focus on costs, they typically provide a lower-bound estimate of the value of data |
| Market-based methods using market prices of data | Simple to calculate provided adequate information exists on market prices,Partially reflects the benefits of the data used (value assigned by the market to data), but depends on how well the market functions. For example, if users know more about the potential uses of the data than the data supplier, the market price would only capture a proportion of the true value to the user,Where datasets are similar and comparable, broad estimates can be proxied (with the necessary caveats) | Does not reflect social or environmental benefits of data use, Not widely applicable as not all data is exchanged through market transactions (relatively uncommon), Limited precision because market transactions involving data are relatively infrequent | Market-based methods are a reliable benchmark to value data assets when there are significant volumes of transactions. However, market prices for data are often not available and it is difficult to disentangle the value of data from other digital and intangible assets, As a result, these methods are likely to provide a consistent but underestimate of the true value of data to an organisation |
| Market-based methods using market value of companies | Wide scope of use cases as accounts for the full variety of ways that data adds value to a business, Partially reflects the benefits of the data used (value assigned by the market to data), but depends on how well the market functions. Market value/total revenue would only capture a proportion of the true value to the user | In practice, defining and identifying whether a company is “location datadriven” could be challenging. Location data use varies and many companies operate across multiple industry sectors and different stages of the value chain | |
| Use-based methods | Flexible and broadly applicable, where methods can be tailored to the specific context based on how the data is used, and for what purpose,Typically do not underestimate value to the user for a given use case systematically (if specified correctly),Can distinguish and disaggregate between the value of different datasets and their individual characteristics,Can assess potential future value of data,Focusses on the welfare impacts of an investment, as recommended by HM Treasury’s Green Book | Applying some of these methods can be relatively resource-intensive (some more than others),In some cases, it may be difficult to compare across firms/organisations because the flexibility can lead to different approaches and outputs,Specific use-based methods can be deployed in a variety of ways and will have their own limitations. For example, contingent valuation methods assume respondents sufficiently understand the data asset in question and will reveal their true preferences as they would in a normal market. This may not always apply. Results may be biased if respondents do not take the questions seriously or want to achieve a specific outcome,Limited precision due to challenges around disentangling data’s value add relative to other inputs | Use-based methods are the most appropriate method for assessing the full impact of data policy changes, because of their flexibility and ability to account for differences in use case and scenarios, allowing at a more granular level. The associated resource requirements and precision of estimates can vary depending on the method |
Across these three broad categories of methods, the use-based methods provide the best balance of specificity and relevance to location data whilst covering the relevant impacts that satisfy a public sector appraisal of value.
Annex F – Direct valuation of data
In exceptional circumstances, it may be relevant to value a specific investment in data directly, without quantifying the value of an overall use case. This departs from the use case focus, however these approaches are not always practical or timely to implement given resource constraints.
This might involve assessing the market price of a dataset which will reflect some of the direct economic benefits (though not social/environmental or indirect benefits) associated with multiple use cases. It may not capture all of the direct economic benefits (as direct valuation will not capture additional consumer surplus over above the market price paid).
Alternatively, where there are changes to specific data characteristics, market prices will not exist. In those cases it may be possible to use contingent valuation methods such as a willingness to pay (WTP) survey which estimate direct benefits to data users. This approach is another example of “use-based methods” that exist in the literature. Specific advantages and limitations of this approach are set out in Annex E. The extent to which a direct valuation is appropriate will depend on the relative balance of direct and indirect benefits expected to be realised.
Examples of both of these direct valuation approaches are below:
-
HMLR’s data valuation model allows for the direct calculation of revenue generated by their data users.
-
Method: Estimates of revenue generation experienced by users are computed based on a number of parameters. HMLR’s data model firstly considers the number of companies in specific sectors that use the dataset in question and the average revenue of those companies. Engagement with users provides an indication of how important the data is to companies in that sector and the proportion of business activity that relates to the dataset. This information comes from a mixture of external sources (e.g. ONS data on the size of specific sectors) and engagement with users. These metrics can then be combined [footnote 36] to provide an indication of revenue generation amongst a certain user group.
-
Advantages: Considers actual business impacts [footnote 37] rather than willingness to pay. This revenue can then be translated into gross value added across the economy. Limitations: Focuses on current users only. Captures only benefits which accrue to users rather than wider impacts.
Deployment considerations: Requires extensive engagement with current user base. -
PSGA willingness to pay analysis.
- Method: A WTP survey that was undertaken on behalf of Ordnance Survey attributed prices levels to different data products and features including: Update Frequency, Ease of Access, Resolution and Authority. The WTP methodology produced detailed price estimates and ranges for different products and how they might vary going forward if specific characteristics were altered.
- Advantages: Allows for valuation of both existing products and indications of how that valuation might change if further investments are made in the data.
- Limitations: Unable to capture indirect benefits. Requires respondents to be sufficiently well informed regarding the data asset in question and provide unbiased responses.
Deployment considerations: Likely to be resource intensive to carry out in a robust manner.
-
Economic, social, environmental; direct, indirect and spillover benefits. ↩
-
Geospatial data and location data are used interchangeably in this guidance. ↩
-
The strategic importance of location data has been further emphasised by the recent publication of the Levelling Up White Paper, which highlighted the importance of “high-quality, timely and robust spatial data” and the need for government Departments to be more spatially aware. ↩
-
See Geospatial Data Market Study Report for greater detail ↩
-
As noted in the Geospatial Data Market Study geospatial is an ecosystem rather than a market, where location data is present and used in a wide range of sectors in the UK economy. ↩
-
For best practice, see HM Treasury Magenta Book guidance ↩
-
More detail on categories of investment is included in Chapter 3. ↩
-
As well as sitting alongside existing best practice guidance for appraisal e.g. HMT’s Green Book which provides guidance on how to appraise and evaluate policies, projects and programmes in central government. ↩
-
As noted in the Geospatial Data Market Study geospatial is an ecosystem rather than a market, where location data is present and used in a wide range of sectors in the UK economy. ↩
-
For example, Coal Authority data is now being used to identify natural and sustainable mine water to heat and cool homes and businesses to support the UK’s net zero commitments. ↩
-
Sites of Special Scientific Interest ↩
-
Areas of Natural Beauty ↩
-
For example, the Roadmap for Digital and Data, 2022 to 2025 promotes a ‘buy once, use many times’ approach to technology to realise efficiencies, requiring a joined up approach across government to leverage its combined purchasing power and reduce duplicative procurement costs. ↩
-
Market failures in relation to accessing data have been described in greater depth elsewhere e.g. Increasing access to data across the economy ↩
-
Guide to developing the project business case. Better business cases for better outcomes. ↩
-
It is recommended to use the Q-FAIR framework as a structured way of thinking about what some of those gaps might be and therefore what needs to change. ↩ ↩2
-
Undertaken or overseen by the Geospatial Commission and other public sector bodies ↩
-
See following Step 3 for a detailed explanation of the relevant geospatial data characteristics and their links to the Q-FAIR framework. ↩
-
See accompanying case studies - PSGA Case Study 3 for more details ↩
-
Open data covers real-time and static datasets. First TfL datasets were published in 2009, with other datasets released thereafter: Journey Planner API, Live Bus arrivals, Unified API, Cycle route & hire data, infrastructure data, Step-free access data, Station busyness data, ULEZ boundaries and other network statistics. ↩
-
The value of data assets. A report for the Department for Digital, Culture, Media and Sport. Frontier Economics. In press. ↩
-
Knol, A.B., Slottje, P., van der Sluijs, J.P. et al. The use of expert elicitation in environmental health impact assessment: a seven step procedure. Environ Health 9, 19 (2010) ↩
-
As per HMT Green Book Guidance any economic transfers should not be counted as an economic benefit. Economic transfers cover movement of resources between people and organisations without any change in overall economic output. For example, when the burden of payment for a location dataset is moved from one entity to another, but the overall access/use policies for users remain the same, the net economic benefit will be unchanged. ↩
-
MCDA offers multiple advantages over informal judgement as it is open and explicit, provides an audit trail and the supporting materials can also be used as an important means of communication. ↩
-
Frontier Economics (forthcoming), The value of data assets. See specific benefits of data use description in Section 3. ↩
-
Data for this proportion comes from the number of searches carried out via an industry wide portal (Line Search Before U Dig [LSBUD]) ↩
-
Hickling Arthurs Low, Canadian Geomatics Environmental Scan and Value Study, Geoconnections ↩
-
Care will be needed in terms of how best to interpret these figures. For example, one intervention may involve creating an entirely new data asset whereas another may involve improving an existing geospatial asset in the same sector. The marginal attributable impact of the latter is likely to be smaller than the former and adjustments to the benchmarks above may be needed to account for that. ↩
-
Switching values approach set out in HMT’s Green Book. This refers to the scale that an assumption would need to change by to make an option unviable from a benefits and costs perspective. ↩
-
This also applies to data more broadly in some cases. For example, the ONS’s evaluation of Census data benefits elected to not monetise certain benefits including the Office for Budget Responsibility using Census data as a basis for their forecasts. ↩
-
This multiple could be greater than 1 (when indirect benefits are expected to outweigh direct benefits) or less than 1 (when direct benefits are expected to outweigh indirect benefits). ↩
-
See The Value of Data Assets Frontier Economics (In Press) ↩
-
For example, Saunders and Brynjolfsson (2016) conclude that here is a 45% to 76% premium in market value for firms with the highest IT capabilities, compared to firms with the lowest IT capabilities. ↩
-
The literature often refers to these methods as “income-based” or “revenue-based”, especially when applied to businesses (e.g. OECD, 2020). We consider income-based methods as a subset of use-based methods, as data can be used to generate income but can also be used for a variety of other purposes. ↩
-
Revenue Generation = SIC revenue Revenue related to data Business relevance factor Business dependency rating Adoption rate ↩
-
The model also includes cost savings experienced by public sector users. ↩