Mandatory gender pay gap reporting: summary of reported data for 2018/19 (HTML)
Published 22 July 2019

© Crown copyright 2019
This publication is licensed under the terms of the Open Government Licence v3.0 except where otherwise stated. To view this licence, visit nationalarchives.gov.uk/doc/open-government-licence/version/3 or write to the Information Policy Team, The National Archives, Kew, London TW9 4DU, or email: psi@nationalarchives.gov.uk.
Where we have identified any third party copyright information you will need to obtain permission from the copyright holders concerned.
This publication is available at https://www.gov.uk/government/publications/mandatory-gender-pay-gap-reporting-summary-of-reported-data-for-201819/mandatory-gender-pay-gap-reporting-summary-of-reported-data-for-201819-html
Mandatory Gender Pay Gap Reporting
Summary of reported data for 2018/19
July 2019
1. Executive summary
The gender pay gap (GPG) is the difference in the average hourly wage of all men and women across a workforce. If women do more of the less well paid jobs within an organisation than men, the gender pay gap is usually bigger.
From spring 2017, employers with 250 or more employees in England, Wales and Scotland[footnote 1] are legally required to report annually on the gender pay gap within their organisation both on their own website, and via a dedicated Governmental reporting portal. This report summarises the data that employers reported under the second year of the regulations.
Overall employer compliance with the regulations stands at over 99% of identified organisations as of 17 July 2019. At the deadline, 96% of employers had reported (94% of public sector organisations, and 96% of private sector organisations).
Key findings on reported GPGs are as follows:
- 78% of reported median GPGs favoured men, 14% favoured women, and 9% of employers reported a median GPG of exactly 0%
- 88% of reported mean GPGs favoured men, 11% favoured women, and 1% of employers reported a mean GPG of exactly 0%
Companies who reported in both 2017/18 and 2018/19 were matched based on their organisation name.[footnote 2]
- 48% of reported median GPGs narrowed (the GPG is closer to zero than the previous reporting period) and 44% widened
- 53% of reported mean GPGs narrowed and 44% widened
82% of employers reported they had more women than men in their lowest 25% of earners and 17% reported they had more women than men in their highest 25% of earners.
Table 1: Reported GPGs and bonus gaps by gender
| Measure | In favour of men | Zero | In favour of women |
| Median Pay | 77.8 % | 8.6 % | 13.6 % |
| Mean Pay | 87.9 % | 0.8 % | 11.4 % |
| Median Bonus | 62.1 % | 20.5 % | 17.4 % |
| Mean Bonus | 75.0 % | 9.5 % | 15.5 % |
Table 2: Changes in reported GPGs between 2017/18 and 2018/19
| Change | Median Pay GPG | Mean Pay GPG |
| Narrowed | 48.1 % | 52.8 % |
| No change | 7.9 % | 3.0 % |
| Widened | 44.0% | 44.2 % |
As of June 2019, an estimated 52% of in-scope employers had published an action plan outlining how they intend to tackle their GPG.
2. Background
The gender pay gap (GPG) is the difference in the average hourly wage of all men and women across a workforce. If women do more of the less well paid jobs within an organisation than men, the gender pay gap is usually bigger.
From spring 2017, employers with 250 or more employees in England, Wales and Scotland are legally required to report annually on the GPG within their organisation both on their own website, and via a dedicated governmental reporting portal. This report summarises the data reported under the second year of the regulations including:
- employer compliance with the regulations
- distributions of reported metrics by industry
- estimates of the proportion of employers producing an action plan to tackle their GPG
There are different regulations covering employers in the public sector and those in the private and voluntary sectors.
2.1 Public sector
Most public sector employers in England must follow the Equality Act 2010 (Specific Duties and Public Authorities) Regulations 2017. This includes most government departments, the armed forces, local authorities, NHS bodies, maintained schools and academy trusts and universities. The full list can be found in Schedule 2 of the regulations. If a public sector employer listed in Schedule 2 has 250 or more staff on 31 March, then they must publish their data by 30 March of the following year.
Public bodies in Scotland and Wales are not required to comply with these regulations as they are subject to separate, devolved arrangements. However, they can choose to report their data on a voluntary basis.
2.2 Private and voluntary sector
Private and voluntary sector employers must follow the Equality Act 2010 (Gender Pay Gap Information) Regulations 2017. Public sector employers not listed in Schedule 2 above must also follow these regulations. If a private or voluntary sector employer (or a public sector employer not listed in Schedule 2) has 250 or more employees on 5 April, they must publish their data by 4 April of the following year.
3. Measures used
The regulations require in-scope employers to report on 14 distinct metrics, as detailed in Table 3.
Table 3: Metrics required under GPG Information Regulations 2017
| Type | Metrics Required | Description |
| Difference in hourly rate | Median gender pay gap | The gap in the median hourly rate of pay between male and female employees expressed as a percentage ‘(A minus B) divided by A multiplied by 100’, where A is the median hourly rate of pay of all male relevant employees, and B is the median hourly rate of pay of all female relevant employees. |
| Difference in hourly rate | Mean gender pay gap | As above, but taking the gap in the mean hourly rate of pay between male and female employees instead of the median. |
| Proportion of women in each pay quartile | Proportion of men and women in each pay quartile (reported as 8 values between 0 and 100). | To calculate the quartiles, employers must sort their employees according to hourly pay, and then split them into 4 equal groups (“pay quartiles”). They are then required to report on the proportions of men and women in each pay quartile. |
| Who received bonus pay | Proportion of women and men receiving bonus pay | The proportion of employees receiving a bonus, split by gender. Bonuses include anything that relates to profit sharing, productivity, performance, incentive and commission. They must be received in the form of cash, vouchers, securities, securities options, and interests. |
| Difference in bonus pay | Median bonus bay gap Mean bonus pay gap |
As for “Difference in hourly rate”, but bonus pay is treated as annual, rather than hourly. Note that only employees receiving bonus pay are included in the calculations. |
More details on these measures are provided in the GEO/Acas guidance “Managing Gender Pay Gap Reporting”.[footnote 3]
Private and voluntary sector employers (and public sector employers not listed in Schedule 2 of the regulations) must also publish a written statement on their own website. The statement must confirm that the published information is accurate and must be signed by an appropriate senior person. The name and job title of that person must be published on this website.
3.1 Median and mean GPG measures
Employers are required to report both their median and mean GPG.
The median measure requires employers to sort all their male and female employees in order of hourly earnings, take the middle employee from each list, and compare their earnings. This is useful, because they show the typical situation in the organisation – a small number of very highly paid men or women would not greatly distort the numbers. However, this could also be a shortcoming, as it would not show inequalities at the highest and lowest levels.
The mean measure requires employers to add up the hourly rate of all their male and female employees, and divide each total by the number of employees. This is useful as it places the same value on every employee’s earnings. However, the value could be distorted, particularly by employees on very high pay (the National Living Wage is likely to reduce the level of variance at the lowest levels of pay).
As the median and mean measures consider different things – and can be quite different within a single organisation – providing both gives a fuller picture of how gender pay equality plays out within individual employers.
4. Data
This report makes use of the figures reported by employers now available on the gender pay gap viewing service.
In addition, further research was undertaken in April to June 2019 to quantify the number of employers producing action plans to tackle their GPG, details of the methodology is provided later in this report.
4.1 Gender pay gap viewing service
All data reported by employers are available online at the gender pay gap viewing service.[footnote 4] Reports can be viewed for individual employers for each reporting year, and the data for all employers across each reporting year are also available as a compiled data table.[footnote 5] The service includes a comparison tool that allows users to choose multiple organisations to easily view and compare gender pay gap data between them.
The viewing service includes all 14 gender pay gap metrics for each employer (see Table 3), as well as the variables listed in Table 4.
Table 4: Additional employer data available on GPG viewing service
Company, Mutual or Charity Number: Optional
Sector (public or private and voluntary): Mandatory
Industry: Optional. For organisations with a Company Number, this is automatically populated as Companies House Standard Industrial Classification (SIC) – note that the accuracy of this data is reliant on organisations keeping their Companies House record up-to-date. Where employers have entered multiple SIC codes, the analysis in this report has used the first displayed code to classify industry. For public sector employers which do not have company numbers, this has been manually assigned for all in- scope.
Name and job title of the individual responsible for reporting: Compulsory only for private and voluntary sector employers, and public sector employers not named in Schedule 2 of the regulations.
Organisation Address: Not mandatory, but required in order to register on the portal. This is likely to be the address of the employer’s Head Office, or the office location of the individual reporting. It may not be representative of the geographical spread of that employer’s workforce.
Number of employees: Optional. Banded as follows – less than 250, 250 to 499, 500 to 999, 1,000 to 4,999, 5,000 to 19,999, 20,000 and above
Date by which the employer was required to report: Compulsory, automatically populated based on sector.
Date of reporting: Compulsory, automatically populated.
Whether the employer reported on time: Compulsory, automatically populated.
Link to narrative report: Optional. Employers were given the opportunity to provide a narrative explaining the reason for any GPG within their organisation.
All GPG metrics provided on the viewing service are self-reported, and employers are responsible for the accuracy of data provided. The Equality and Human Rights Commission are responsible for investigating breaches of the regulations, which includes the submission of inaccurate data, and have published their enforcement strategy.[footnote 6]
Employers can adjust their reported data for 2018/19; this report is based upon data extracted from the portal on 17 July 2019.
5. Reported data
5.1 Employer compliance with the GPG regulations
Table 5 shows the numbers and proportions of employers complying with the regulations, split by sector (as defined within the regulations). Numbers in brackets show the change in reporting in 2017/18.
Table 5: Employer compliance with regulations by sector
| Sector | Estimated number of organisations in scope for regulations[footnote 7] | Number (%) of employers complying by deadline | Number (%) of employers complying after deadline | Total (%) of compliant employers |
| Public | 1,626 (down 3) | 1,532 (94%) – down 2% | 94 (6%) – up 2% | 1,626 (100%) |
| Private and Voluntary | 8,713 (up 90) | 8,374 (96%) – up 3% | 333 (4%) – down 3% | 8,707 (99.9%) |
| Total | 10,339 (up 87) | 9,906 (96%) – up 2% | 427 (4%) – down 2% | 10,333 (99.9%) |
Notes: Figures correct as at 17 July 2019.
Change on previous compliant figures not shown for total compliant employers as the 2017/18 report was released later in October, where compliance was at 100%.
In addition, 469 employers that were not in scope for the regulations opted in to reporting their GPG data. Of these, 406 were from the private and voluntary sectors, and 63 were from the public sector.
Overall, 10,802 employers have submitted data in the 2018/19 reporting year, with 6 left to report.
Figure 1 shows in-scope employer compliance by week of reporting, up to the final reporting deadline. A large proportion of employers reported towards the end of the compliance period. Of those reporting on time:
- 1,273 (78%) of in-scope public sector employers reported in the final 30 days (to 30 March 2018), 865 (53%) did so in the final week
- 7,224 (83%) of in-scope private and voluntary sector employers reported in the final 30 days (to 4 April 2018), 5,206 (60%) did so in the final week
Figure 1: Employer compliance with regulations by week of reporting in 2019
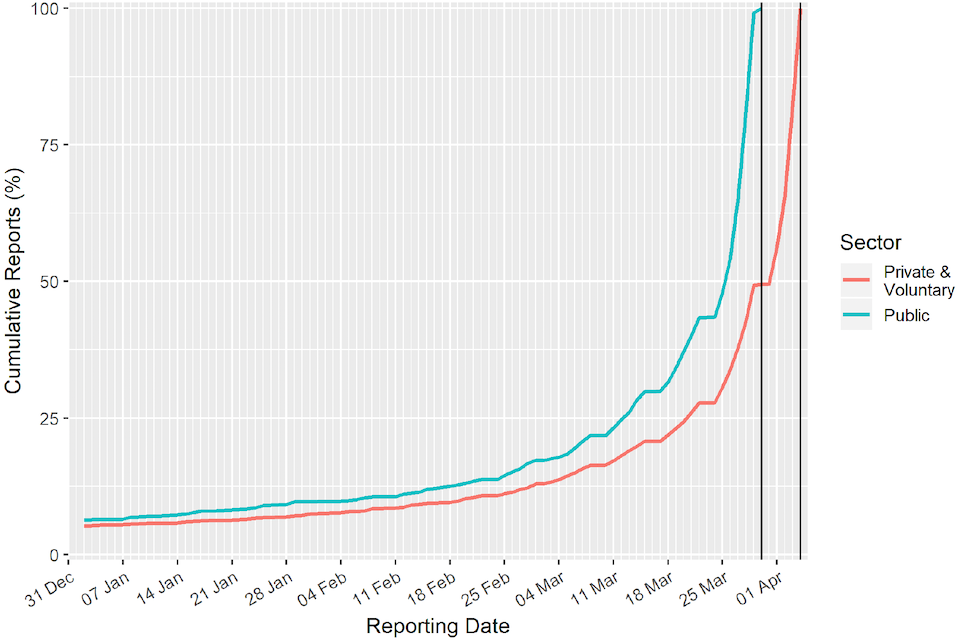
Includes only in-scope employers reporting before the compliance deadlines.
5.2 Distribution of reported gender pay gaps
Figures 2 to 5 show the distribution of median and mean reported GPGs as well as density distributions (these represent comparable distributions if there were an equal number of private and public companies). A positive gap means that men are paid more than women on that measure. It should be noted that because GPGs are expressed with reference to men’s salary, the maximum possible GPG is 100% (women being paid nothing), but there is no theoretical lower limit.
- 78% of reported median GPGs were favouring men, 14% were favouring women, and 9% of employers reported a median GPG of exactly 0%
- 88% of reported mean GPGs were favouring men, 11% were favouring women, and 1% of employers reported a mean GPG of exactly 0%
There are a higher proportion of median pay gaps of 0% among the reported figures than might have been expected, particularly given that figures are required to be reported to one decimal place. These could be legitimate; for the median, in particular, this could occur in a firm where over half of the lowest paid women and men are on the same rate of pay (for example, the National Living Wage). However, some gaps of 0% may be the result of miscalculated or misreported data.
All GPG metrics provided on the viewing service are self-reported, and employers are responsible for the accuracy of data provided. The Equality and Human Rights Commission are responsible for investigating breaches of the regulations, which includes the submission of inaccurate data, and have published their enforcement strategy.[footnote 8]
Figure 2: Distribution of reported median GPGs

Figure 3: Density of reported median GPGs
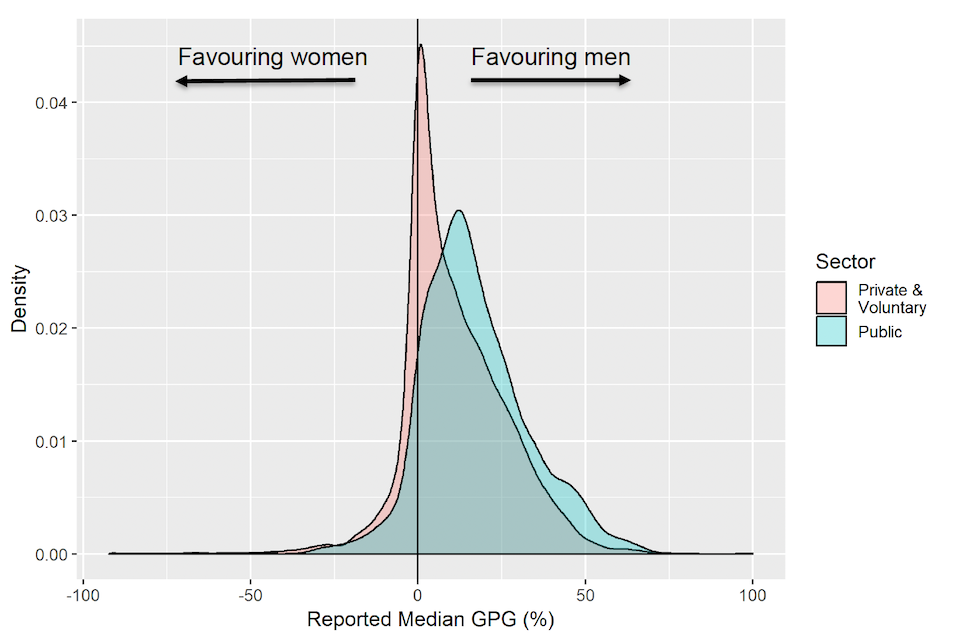
Figure 4: Distribution of reported mean GPGs

Figure 5: Density of reported mean GPGs

5.3 Industries with the highest GPGs
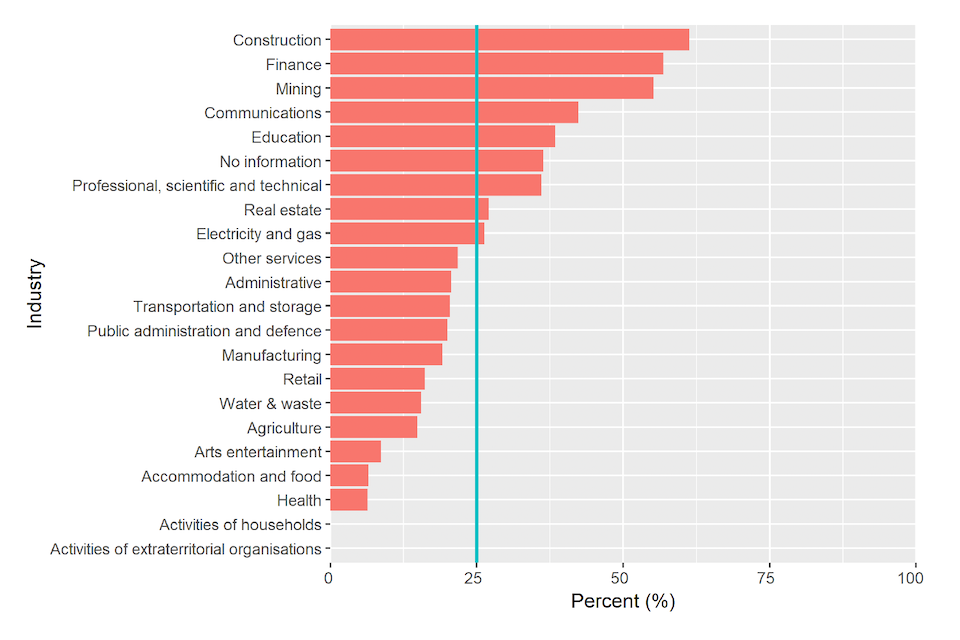
Figure 6 takes the highest 25% of GPGs within the private and voluntary sector and shows what proportion of each industry has employers within this group. If all industries had a set of GPGs similar to each other we would see each industry have around a quarter of their organisations fall in highest 25%.
Within the private sector over 50% of organisations within construction, finance and insurance and, mining and quarrying had gender pay gaps in the highest 25% of the private sector.
Communications, education, and professional scientific and technical activities were also noticeably over represented in having gender pay gaps from the highest 25%.
Figure 6: Distribution of the highest 25% of reported GPGs in the private sector
6. Employer action plans
In order to understand more about employer engagement with reducing the gender pay gap in response to the regulations, the Government Equalities Office estimated the proportion of employers who had externally published an action plan outlining their intention and plans to reduce their GPG. As of June 2019, 52% of in-scope employers had published an action plan. This shows no substantive change from levels found in May 2018.
6.1 Approach
A random sample of in-scope employers was drawn from the data reported at 26 April 2019, with a supplementary sample drawn on June 3rd 2019 to replace a small number of duplicates in the original sample. The final sample of 400 in-scope employers allowed an estimate to be made with a 5% margin of error.
The definition of an action plan used in this exercise was as follows:
a document in which the employer has considered their gender pay gap and has offered a next step (for example, a target, plan, or aim) to implicitly or explicitly reduce or maintain their GPG.
This definition was designed only to identify an action plan at the broadest level, not to reflect on their quality.
Note that to qualify as an action plan, the document must include a commitment to take an action (or multiple actions) to reduce or maintain their GPG, rather than simply an explanation of the causes.
Two assessors considered whether each of the 400 sampled employers had provided an action plan meeting this definition; this exercise took place over 30th April - 7th June 2019.
For each employer, assessors looked at any URL provided in their GPG report (available for just over two-thirds of the sample), briefly reviewed the wider company website (including a search where available), and undertook an internet search of the company name and the search term “gender+pay”. If an action plan could not be found via this approach, it was deemed not to be publicly available via reasonable access attempts.
The 2 assessors compared results, and a third assessor moderated where any discrepancies emerged.
6.2 Findings
Of the sample, action plans meeting the above definition could be found for 206 employers (52%). We therefore estimate that 47% to 57% of employers have published an action plan to tackle their gender pay gap. The results in the previous year showed an estimated 48% (43% to 53%) of employers had published an action plan, although the current estimate is 4% higher, the difference is still within the margin of error.
-
This excludes public bodies in Scotland and Wales as they are subject to separate devolved regulations. ↩
-
Organisations who were not in scope for both years or have changed their name have not been matched. 9,583 (93%) of organisations in 2018/19 were matched in the previous reporting period. ↩
-
https://www.equalityhumanrights.com/en/publication-download/closing-gap-enforcing-gender-pay-gap-regulations ↩
-
The number of in-scope organisations was taken as the organisations who were in-scope in 2017. Organisations are responsible for updating the gender pay gap portal if they have changed to be in scope of regulations. Some organisations who were in scope in 2017/18 may no longer be in 2018/19. ↩
-
https://www.equalityhumanrights.com/en/publication-download/closing-gap-enforcing-gender-pay-gap-regulations ↩